Energean in 2021:
Our Year of Transition
The Leading Independent E&P Player
in the East Mediterranean
←
→
Page content transcription
If your browser does not render page correctly, please read the page content below
Energean in 2021: Our Year of Transition The Leading Independent E&P Player in the East Mediterranean
Disclaimer

This presentation contains certain forward-looking statements that are subject to
the usual risk factors and uncertainties associated with the oil and gas exploration
and production business.

Whilst Energean believes the expectations reflected herein to be reasonable
considering the information available to them at this time, the actual outcome may
be materially different owing to factors beyond the Group’s control or within the
Group’s control where, for example, the Group decides on a change of plan or
strategy.

The Group undertakes no obligation to revise any such forward-looking statements
to reflect any changes in the Group’s expectations or any change in
circumstances, events or the Group’s plans and strategy. Accordingly, no reliance
may be placed on the figures contained in such forward-looking statements.

                                                                                       2
Energean – The Largest E&P Company Listed on LSE
& First in the World to Commit to Net Zero Emissions
                                                                                                         9 Countries                            +1 Billion Boe
                                                                                                            Of operation                             2P reserves &
                                                                                                            Med-focused                              2C resources*

                                                                                                         +200 Kboed                                         +70%
                                                                                                          Medium-term                                 Gas-weighted
                                                                                                        production target                               portfolio

                                                                                                         Governance                                 Management
                                                                                                         Premium listing                               30 years
                                                                                                            on LSE                                  experience in gas

                                                                                                            Net Zero                                  ESG & HSE
                                                                                                           Emissions                                   A rating MSCI
                                                                                                    Commitment by 2050                                Gold by MAALA

    * Pro forma as at 31.12.2020. Includes an additional 219 MMboe of 2P reserves to be acquired from Kerogen Capital. Reserves information is unaudited and subject to further
    review.                                                                                                                                                                       3
2020: Strong Delivery Despite
a Challenging Year
Key Milestones Achieved
Strong Delivery Against Strategic Goals Despite COVID-19 Related Challenges

                                                                   80% Y-o-Y Increase in 2P reserves to 956 MMboe (2019: 341 MMboe)*

                                                                                           Production 48.3 Kboepd (74% gas)
 Strong Operational
    Performance                                                             Karish development 87% Complete at 31 December 2020

                                                                              Took FID on Karish North (Israel) and NEA / NI (Egypt)

                                                               Closed Edison Acquisition – Operational Footprint Expanded to 9 Countries

   Continued                                                             Agreed to Acquire Kerogen’s 30% Holding in Energean Israel
Commercial Success
                                                                                   Increased signed GSPAs in Israel to 7.4 Bcm/yr

  Optimised Capital                                                      $437 Million Capex Reduction versus January 2020 guidance
 Structure & Strong
 Financial Discipline                                                    $1.2 Billion Cash & Undrawn Facilities at 31 December 2020**

                                                                          67% Y-o-Y Reduction in Carbon Intensity to 22.2 kgCO2/boe
 Advanced Net Zero
     Strategy                                                                    Roll Out of ‘Green Electricity’ at Prinos in Greece

       * Pro forma as at 31.12.2020. Includes an additional 219 MMboe of 2P reserves to be acquired from Kerogen Capital. Reserves information is unaudited and subject to further
       review.                                                                                                                                                                       5
       ** Adjusted for the new $700 million term loan that was secured post-balance sheet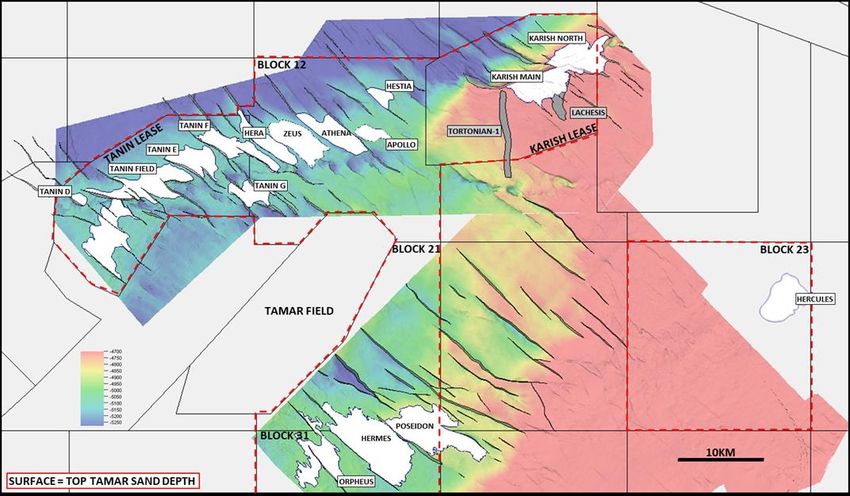
Our Transition into the Top Tier of European E&Ps
                  Moving into the top tier of E&Ps expected to enhance liquidity, valuations & investor attention

                  1.200                                                                                        Norwegian Peers         LSE-Listed Peers
 WI 2P Reserves

                  1.000

                   800
    (MMboe)

                   600

                   400

                   200

                     0
                          Energean   Peer 1   Peer 2   Peer 3     Peer 4   Peer 5   Peer 6   Peer 7   Peer 8       Peer 9        Peer 10   Peer 11

                   250
 WI Production

                   200
    (Kboed)

                   150

                   100

                    50

                      0
                           Peer 1    Peer 2   Peer 3   Energean   Peer 4   Peer 5   Peer 6   Peer 7   Energean       Peer 8       Peer 9    Peer 10
                                                        Target                                         Today

                              Top 5 European E&Ps by scale

                                                                                                                                                          6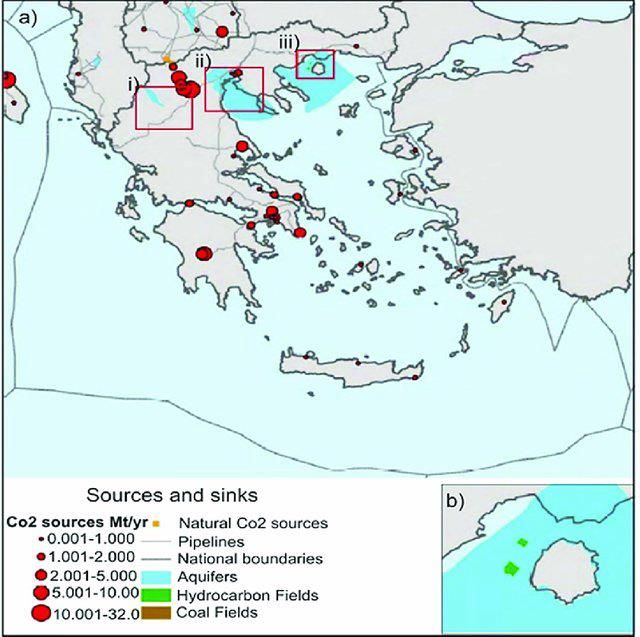
2021: Our Year of Transition
2021 Guidance and Medium-Term Targets
Substantially Improved Medium-Term Outlook
Through successfully delivering our strategic objectives in 2021 we will achieve our Medium-Term Targets which underpin
our goal of generating sustainable Free Cash Flow and delivering a sustainable dividend

                          2021 Guidance                                                 Medium-Term Targets

      Production
 (excludes any contribution                     35.0 – 40.0 kboed                 Production
                                                                                                              200
                                                                                                               Kboed
        from Israel)                                                                                       (up from 160))

Cost of Production*                             $195 – 215 million                Revenues
                                                                                                          $2,000
                                                                                                                Million
                                                                                                          (up from $1,400)

  Development &
 Production Capital                             $510 – 590 million            Cost of Production*
                                                                                                         $9 – 11
                                                                                                              / boe
    Expenditure                                                                                          Down from 10 -12

 Exploration Capital
                                                  $35 – 50 million                   G&A
                                                                                                        $25 – 35
    Expenditure                                                                                               Million
                                                                                                                =

 Decommissioning
                                                $25 – 32.5 million                 EBITDAX                $1,400
   Expenditure                                                                                                Million
                                                                                                          (Up from $900)

  Consolidated Net
                                             $2,000 – 2,200 million           Net Debt / EBITDAX           < 2.0x
       Debt

           * Operating Costs plus all royalties.
           SG&A costs of approximately $35 - 40 million anticipated in 2021                                                  8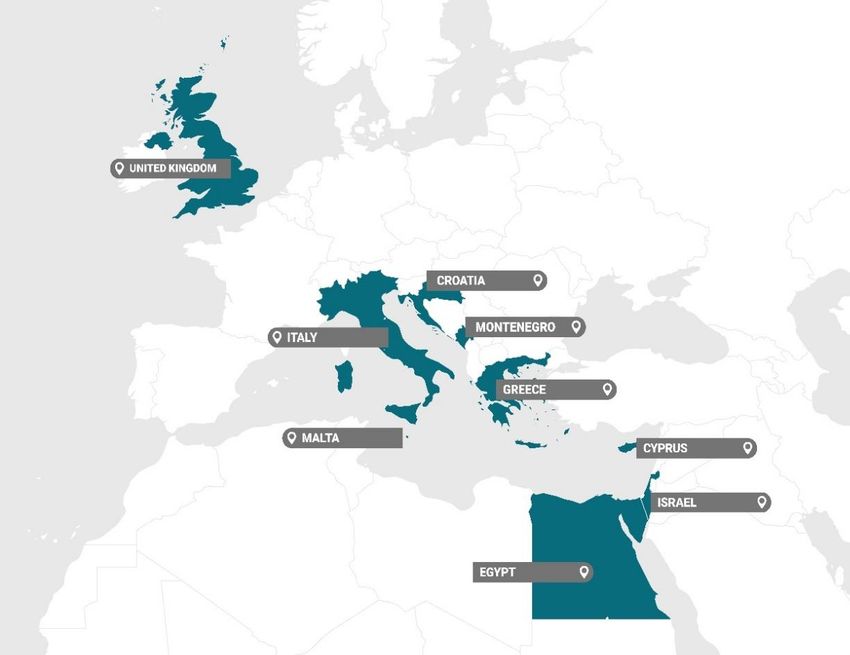
Focused on Monetising 1 Billion Barrels of Reserves
 to Deliver Production of more than 200 Kboed
         W.I. 2P Reserves + 2C Resources 2016-20E*                                                                       W.I. Hydrocarbon Production 2021+

        1.200                                                                                                      250
                                                        2016-20E CAGR 45%
                                                                                                                                                                Medium-term Target
                                                                                                                                                                    200 kboe/d
        1.000
                                                                                                                   200
                                                                                                                                      Key growth drivers

         800                                                                                                                         • Karish & Karish North
                                                                                                                   150               • Incremental liquids
MMboe

                                                                                                           Kboed
         600                                                                                                                         • Abu Qir infill drilling
                                                                                                                                     • NEA/NI development
                                                                                                                   100

         400

                                                                                                                    50
         200

           0                                                                                                         0
                2016            2017          2018             2019           2020                                                    2021                          Medium-term Target
                                Israel    Egypt   Europe                                                                                  Israel     Egypt      Europe

                * Pro forma as at 31.12.2020. Includes an additional 219 MMboe of 2P reserves to be acquired from Kerogen Capital. Reserves information is unaudited and subject to further
                review.                                                                                                                                                                       9
Revenues Forecast to Reach Over $2 Billion
Growth Underpinned by Gas Sold Under Fixed-price Contracts

                 Revenue Outlook 2021-25                                                                            Revenue Outlook % 2021-25

                                                                                                                            3%              2%
                                                                                                              9%                                             7%             7%
                                              Medium-term Target
                                                   $2 billion

                                                                                                                            41%             42%
                                                                                                                                                            37%            36%
                                                                                                             39%

                                                                                                                            56%             56%             56%            56%
                                                                                                             53%

              2021          2022            2023          2024          2025                                 2021           2022            2023            2024           2025
 Gas sold under fixed price contracts         Gas sold at market prices                              Gas sold under fixed price contracts          Liquids with Brent-linkage
 Liquids with Brent-linkage                                                                          Gas sold at market prices

            Based on a Brent price of $50/bbl in 2021, $55/bbl in 2022 and $60/bbl flat real 2023+
                                                                                                                                                                                  10
Creating a Sustainable Low-Cost Business
Secured Lower Unit Cost of Production Further Targeted Cost Optimisation Expected
18 • Full, bottom-up internal review initiated
• Operating cost reductions
16
• Third party tariff optimisation
14
• Mothballing
12 Medium-term Target • Production efficiencies, such as gas
$9 - 11 / boe reinjection, to reduce power consumption
10
• Cost driven performance-management
$/boe
8 • Further savings expected and not yet reflected in
forecasts
Medium-term Target
6 $4 - 6 / boe • Karish, Karish North & Tanin operating costs
expected to be $70 – 80 million per year
4
• Approximately $1/boe on plateau (excludes
royalties)
2
• Limited variable costs
0
2021 2022 2023 2024 2025
Unit Operating Costs Unit Operating Costs + Royalties
11Disciplined Capital Allocation Remains a Priority
Development & Production Capex 2021-24 W.I. Capex Allocation 2021-24
600 100%
17% 21%
33%
80%
52%
500
60%
40% 83% 79%
400 67%
48%
20%
$ Million*
300 0%
2021 2022 2023 2024
Greenfield Brownfield
200
Strong ability to reduce capital spend in a
low commodity price environment
100
Investing ~80% of capital expenditure in
greenfield assets in 2021
0
2021 2022 2023 2024 Increasing spend on brownfield assets
Israel Croatia Egypt Italy UK through 2024 to optimise Edison portfolio
* Excludes exploration and appraisal expenditure
12Capital Allocation Prioritising Total Shareholder Return
With Core Focus On Distribution Policy That Underpins Sustainable Dividend
Sustainable Target for inaugural
Dividend
2022 dividend
Organic > 20% 40% IRR Karish North
Growth IRR Project Sanctioned
Capital
Structure < 2x Net debt / EBITDAX target
$1.85/boe acquisition price
Disciplined Value for Kerogen’s 30% holding
M&A Accretive in Energean Israel
13Current Capital Structure
Net Debt Position* Committed Facilities
To be refinanced in 2021
Group net debt: $1,241 million • $1.45bn PFF ($1.15bn drawn)
• $(201) million cash Israel • Extended maturity to September 2022
• $1,442 million debt • Non-recourse to parent
PFF • Interest payments & other project costs covered by
facility
Energean Israel net debt: $1,057 million
• $(37) million cash • $700 million Term Loan
• $1,094 million debt Term • Maturity July 2022
Loan • Primary uses to fund Kerogen acquisition and Karish
North development
Energean PLC excl. Israel net debt: $184 million
• $(164) million cash
• $348 million debt • $280m RBL facility (current borrowing base $237m;
availability expected to increase June 2021) with
Egypt $75m accordion
RBL • LIBOR + 4.75% yrs 1-3 / LIBOR + 5.75% yrs 4-6
• 6-year term, semi-annual redeterminations
Full Year 2021 Guidance • 3-year grace period with first amortisation July 2023
•
$2,000 – 2,200 million Greek •
Outstanding loans as of 31 December $127m
Scheduled principal repayments of $19m per
RBL semester
* Accounting net debt
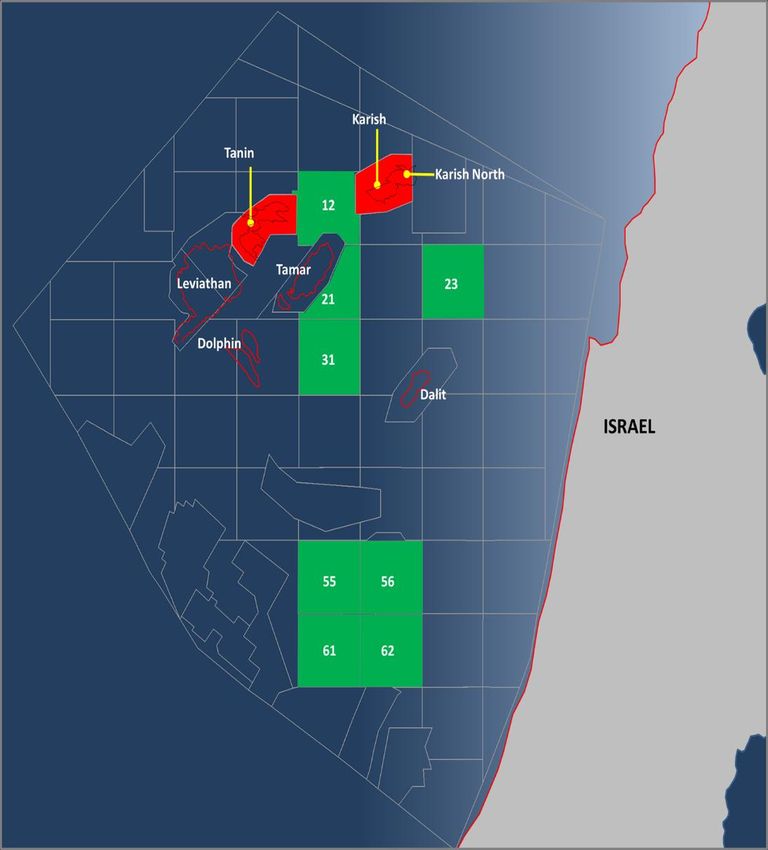
14Project Updates: Israel
Karish Project – First Gas Expected Late 2021
                 Project Close to 90% Complete Despite COVID-19 Related Challenges in 2020
At 31 Dec 2020

                                                                                                                                                KARISH
                           FPSO                                     SUBSEA                                 ONSHORE
                                                                                                                                               PROJECT
                           ~93%                                      ~76%                                  *90-100%
                          complete                                     complete                                 complete                         ~87%
                                                                                                                                                  complete

                 •   Main modules & pipe racks              •   14-line mooring system &             •   Installation of production rate
                     lifting campaign completed                 deepwater subsea production              measurement system at Dor
                     3Q 2020                                    system fully installed                   commenced Aug 2020
                 •   Final lifts of module-1 & flare        •   90-km gas sales pipeline             •   Mechanical completion &             First Gas Dec 2021 –
                     expected in 1Q 2021                        scope close to completion                commissioning expected 1Q          1Q 2022 depending on
                 •   Sailaway to Israel expected            •   Tie-in manifold successfully             2021
                     in Sept / 4Q 2021                          installed Oct 2020 &                 •   Installation of onshore pipeline
                                                                                                                                              further ramp up of
                                                                connected to gas sales                   commenced Jun 2020 &                    workforce in
                                                                pipeline Nov 2020                        expected to complete 1Q 2021             Singapore
                                                            •   Riser installation campaign          •   Civil works progressing well &
                                                                expected to commence &                   expected to complete 2Q
                                                                complete 1Q 2021.                        2021.

                           * 90% inclusive Energean scope of work; 100% under the TechnipFMC EPCIC
                                                                                                                                                                    16
Karish North Sanctioned – First Gas Expected 2H 2023
FID Reached 21-Months After Announcement of 32 Bcm Discovery
Low-Cost High-Return Tieback to FPSO
2P Reserves 241 MMboe (84% Gas)
Initial Capex ~$150 Million
($0.6 / Boe)
300 MMscf/d
Well Deliverability (per well)
Minimal
Operating Costs (Incremental)
IRR +40%
Capex Profile (Including Riser & Oil Train)
200
150
$ Million
First Second
100 Gas Development Well
50
0
2021 2022 2023 2024 2025
Initial Capex Riser + Oil Train
17Focused on Developing & Expanding Liquids Output
Through Committed Investment Programme
• 100 MMbbl 2P liquids certified by DeGolyer & MacNaughton CPR:
Material Reserves • 17.4 MMbbl (21.4%) increase in 2P liquids (light oil) volumes
& Production • 28 kbpd production over a 5-year plateau period
• Further growth targeted from appraisal of potential oil rim in 2022
• Project to install second oil train and riser on Energean Power FPSO sanctioned
• Oil train increases liquids production capacity to 40 kbopd (from 21 kbopd)
Committed & Fully- • Allows maximum gas output of 8 Bcm (from 6.5 Bcm)
Funded
• Approximately $100 million of capex fully funded by new term loan
Infrastructure
• Expected to become operational in 2022
• 800,000 barrels of liquids storage capacity on FPSO
Ample Storage • Storage capacity not a restricting factor to liquids production
Capacity • Additional gas debottlenecking opportunities under evaluation that would allow gas
production above rates of 8 Bcm/yr
• Low carbon barrels added to portfolio
Low Carbon • Liquids production expected to have no discernible impact on Scope 1 & 2 CO2
emissions
Emissions
• Carbon intensity of 4.5 kg CO2/boe anticipated
18Investment Synergies Targeted from Low-Cost
Deepwater Tie-Back Options
Approx. Distance from FPSO 5 km 15-30 km 40-55 km
Karish Karish North Block 12 Tanin
Approximate Life of Field
capex/boe
$6/boe $1.5/boeIsrael – 7.4 Bcm/yr Gas Sales Agreements
Secured Revenues with 93% of Energean Power FPSO Capacity Utilised
Protection
1.8 Bcm/yr new Against
Take-or-Pay / High Quality
GSPAs Signed Floor Pricing Downside
Exclusivity Counterparties
in 2020 Commodity
Price Risk
9
Energean Israel Gas Supply Profile
8
7,4 7,4 7,4 7,4 7,4
7,2 • December 2021 – Karish first gas
7 6,7 6,8
• 2022-23 – Ramp up of 18 contracts
6 signed with independent power
producers (IPPs) including both recently
5 privatised IEC stations, Alon Tavor &
Bcm/yr
4.2*
Ramat Hovav, and blue-chip industrial
4
customers including ORL and ICL
3
• 2024 – Continued ramp up
2
• 2025 – Commencement of IPM contract
1 & continued ramp up of other contracts
0 • 2026 – Plateau gas supply reached
2020 2021 2022 2023 2024 2025 2026 2027 2028 2029 2030
Karish, Karish North & Tanin Gas Supply
Energean Power FPSO Capacity
* Company estimate during 12-month transition from existing suppliers
204-Well E&A Programme Targeting >1 bn boe
Prospective Resources to Commence Early 2022
Karish North drilled as part of a 5-well programme providing cost synergies
KM 04 + Pilot Hole (PH)
ATHENA 01
A discovery would significantly
de-risk prospects in the rest of
Block 12
Audited
Approx.
Prospect Size
Well Type Cost PoS
(Recoverable)
$ Million
MMboe*
Athena-01 Exploration 35 140 84%
94% +
KM-04 + PH Appraisal 45 176 + 64
72%
Exploration
Hermes-01 40 200 56%
(Optional)
Hercules- Exploration
50 488* Tbc
01** (Optional)
KN-01 ST-
04
Development 50 NA 100% HERMES 01 HERCULES 01
* Recoverable Volume”: is the sum of the unrisked mean recoverable volumes with recovery factor (gas) = 0.7 and recovery factor (oil) = 0.4. This represents the total recoverable
reserves targeted by the well bore 21
** Not yet audited. Management estimates presentedProject Updates: Egypt
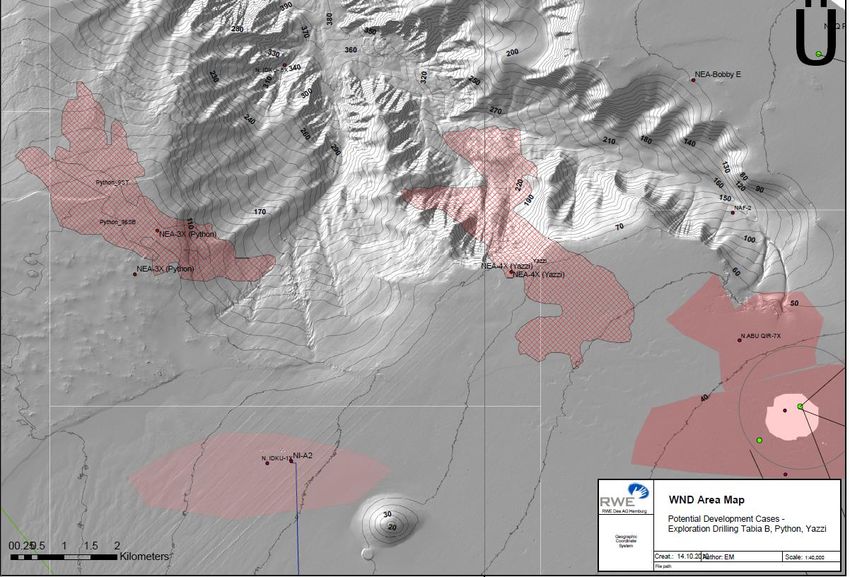
NEA / NI Sanctioned – Monetisation of Well Defined,
  High Return Drilling Opportunities
                        Key Project Metrics

        Peak Production                 15 – 16 Kboed

         2P Reserves                     49 MMboe
                                             (87% Gas)
                                                                  PYTHON
                                                                  SUBSEA
                                                                   WELL
                Capex
Proposed Acquisition of Kerogen’s 30% Holding in Energean Israel Limited
Agreed to Acquire Kerogen Capital’s 30% holding in
Energean Israel Limited (EISL) for $380-405 Million
      Compliments our gas-weighted portfolio                                  Group 2P+2C to reach +1 billion boe

                                                                       Energean            Acquired assets              Pro-forma
• Natural strategic fit that gives full control over capital
                                                                                                    14%
  structure of EISL                                              29%                                                    26%

• Adds 219 MMboe 2P reserves (86% gas)
                                                                                71%                                                  74%
                                                                                                          86%
      • Group 2P + 2C set to grow to >1 Bnboe (74%
        gas)
                                                                   Gas       Liquids

•   Attractive transaction metrics
      • $1.74 - $1.85 /boe                                                   Group production to reach +200 kboed
      • 1x forecast Minority EBITDAX                                   250
      • Payback achieved within three years
      • 43% discount to EV                                             200

                                                                       150
•   Full control over EISL enables capital structure           Kboed
    optimisation                                                       100

• Low carbon intensity hydrocarbons (< 4.5 kg                           50

  CO2/boe)
                                                                         0
                                                                              2021        2022            2023   2024         2025
                                                                   Energean       Acquired Assets

                                                                                                                                           25
Transaction Structure & Financing
Part of use of proceeds for Term
Up-Front
$175 Million Payable on completion Loan provided by J.P. Morgan &
Consideration Morgan Stanley
Deferred Cash Contingent on Practical Completion To be funded by optimised capital
$125-150 Million of Karish structure
Consideration
Additional Deferred
$30 Million Payable December 2022 Funded by free cash flows
Consideration
Conversion price £9.50 / 0% coupon
Convertible Loan
$50 Million rate / Maturity 31/12/2023 December Satisfied by new share issuance
Notes 2023
$380-405 Total
Highly accretive to plc leverage ratio
Million Consideration
26Milestones to Completion
Transaction Close Expected 1Q 2021
Timing Milestone
30 Dec 2020 Transaction announcement
Jan / Feb 2021 Israeli Petroleum Commissioner Approval
Feb 2021 Publication of Circular
Feb 2021 EGM & shareholder votes
Feb / Mar 2021 Closing of the Proposed Transaction
27ESG & Our Path to Carbon Neutrality
Creating a Low Carbon Business with Industry-
Leading ESG Credentials
                                                                                     First E&P Company Globally to Commit to
                                                                                            Net Zero Emissions by 2050
                                          Net Zero
                                       Carbon emissions by 2050

                                                                                      Visibility on Absolute Carbon Emissions
                                                                                    Intensity to Half the Current Global Average
Rolling Three-year Emissions Target
30

                                                           Current global average
25
                                                                                     +70% Gas-Weighted Portfolio (2P + 2C)
                                         +85% reduction by 2023 versus
20                                                2019 base year
                                          2023 target = Approx. half the
15                                        current global average for oil &
                                                    gas industry
10
                                                                                       Executive compensation tied to ESG
                                                                                         performance targets from 2020
 5

 0
         2020*       2021      2022       2023      2024           2025
                                                                                    Committed to Transparency & Adherence to
                 Carbon emissions intensity – kgCO2e/boe                                        the 17 UN SDGs
     •   Pro forma Energean + Edison

                                                                                                                               29
Prinos – Carbon Capture & Storage Initiatve
Multiple CC&S Opportunities Under Evaluation in Greece
Greece Sources of CO2 Emissions Possible CO2 Storage Sites in Greece
Mesohellenic Western Prinos
Industry Facilities # CO2 Emitted (kt)
Trough Thessaloniki Basin
Energy Sector 21 36,463
Minerals 6 13,422
Production &
Processing of 2 708
Metals
2
Chemicals 490
Total 31 51,083
Prinos CC&S Project Under Evaluation
• Focused on meeting our carbon neutral by 2050 target and
leading the Mediterranean region’s energy transition
• Evaluation of Carbon Capture & Storage projects in the
Prinos basin initiated in late 2020
• Prinos subsurface volumes sufficient to sequester up to 50
million tonnes of CO2
• Use of captured CO2 for enhanced oil recovery (EOR) also
under investigating – to unlock additional upstream value
* Enhanced Oil Recovery
302021: The Outlook
2021-22 Outlook
Continue Strong Performance Versus Strategic Goals & Deliver Our Year of Transition

                                 Deliver First Gas at Karish & Develop Karish North         2021 - 2023

    Operational                              Develop NEA / NI in Egypt                      2021 - 2022
    Performance
                                Deliver (up to) 5-well E&A programme, offshore Israel       2022 - 2023

                                             Kerogen Acquisition Close                       1Q 2021

Commercial Success             Sign GSPAs to fill remaining space in the Karish FPSO           2021

                                      Sign offtake agreement for Karish liquids                2021

                                 Optimise EISL capital structure through refinancing           2021
  Optimised Capital
 Structure & Strong                            Define dividend policy                          2021

 Financial Discipline
                                        Bring net debt / EBITDAX below 2.0x                  Mid-term

                                         Align with TCFD recommendations                       2021

 Advanced Net Zero              Roll Out of ‘Green Electricity’ across operated assets       Ongoing
     Strategy
                            Evaluating converting Prinos into Greece’s first CC&S Project    Ongoing

                                                                                                          32
Q&A
33You can also read