INVESTOR PRESENTATION - November 2018 - YPF
←
→
Page content transcription
If your browser does not render page correctly, please read the page content below
INVESTOR PRESENTATION
November 2018

                        1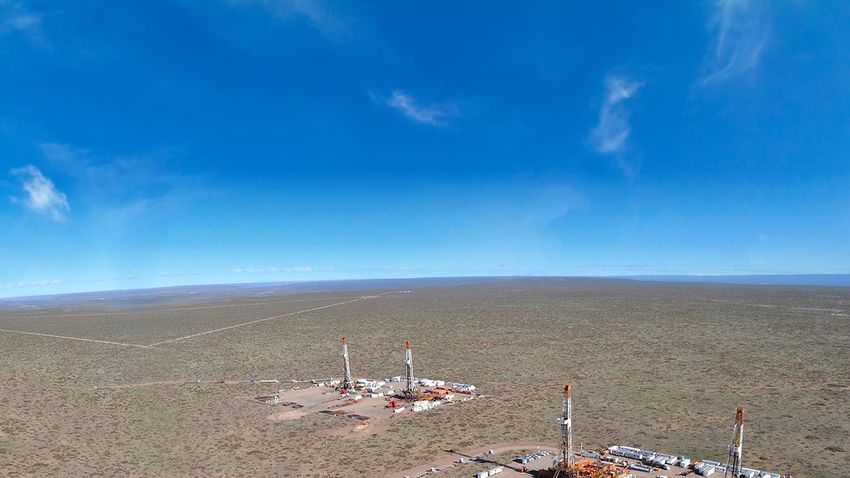
IMPORTANT NOTICE

Safe harbor statement under the US Private Securities Litigation Reform Act of 1995.

This document contains statements that YPF believes constitute forward-looking statements within the meaning of the US Private Securities Litigation Reform Act of 1995.

These forward-looking statements may include statements regarding the intent, belief, plans, current expectations or objectives of YPF and its management, including statements with respect to
YPF’s future financial condition, financial, operating, reserve replacement and other ratios, results of operations, business strategy, geographic concentration, business concentration, production
and marketed volumes and reserves, as well as YPF’s plans, expectations or objectives with respect to future capital expenditures, investments, expansion and other projects, exploration
activities, ownership interests, divestments, cost savings and dividend payout policies. These forward-looking statements may also include assumptions regarding future economic and other
conditions, such as future crude oil and other prices, refining and marketing margins and exchange rates. These statements are not guarantees of future performance, prices, margins, exchange
rates or other events and are subject to material risks, uncertainties, changes and other factors which may be beyond YPF’s control or may be difficult to predict.

YPF’s actual future financial condition, financial, operating, reserve replacement and other ratios, results of operations, business strategy, geographic concentration, business concentration,
production and marketed volumes, reserves, capital expenditures, investments, expansion and other projects, exploration activities, ownership interests, divestments, cost savings and dividend
payout policies, as well as actual future economic and other conditions, such as future crude oil and other prices, refining margins and exchange rates, could differ materially from those expressed
or implied in any such forward-looking statements. Important factors that could cause such differences include, but are not limited to, oil, gas and other price fluctuations, supply and demand
levels, currency fluctuations, exploration, drilling and production results, changes in reserves estimates, success in partnering with third parties, loss of market share, industry competition,
environmental risks, physical risks, the risks of doing business in developing countries, legislative, tax, legal and regulatory developments, economic and financial market conditions in various
countries and regions, political risks, wars and acts of terrorism, natural disasters, project delays or advancements and lack of approvals, as well as those factors described in the filings made by
YPF and its affiliates with the Securities and Exchange Commission, in particular, those described in “Item 3. Key Information—Risk Factors” and “Item 5. Operating and Financial Review and
Prospects” in YPF’s Annual Report on Form 20-F for the fiscal year ended December 31, 2017 filed with the US Securities and Exchange Commission. In light of the foregoing, the forward-looking
statements included in this document may not occur.

Except as required by law, YPF does not undertake to publicly update or revise these forward-looking statements even if experience or future changes make it clear that the projected
performance, conditions or events expressed or implied therein will not be realized.

These materials do not constitute an offer to sell or the solicitation of any offer to buy any securities of YPF S.A. in any jurisdiction. Securities may not be offered or sold in the United States absent
registration with the U.S. Securities and Exchange Commission or an exemption from such registration.

Cautionary Note to U.S. Investors — The United States Securities and Exchange Commission permits oil and gas companies, in their filings with the SEC, to separately disclose proved, probable
and possible reserves that a company has determined in accordance with the SEC rules. We may use certain terms in this presentation, such as resources, that the SEC’s guidelines strictly
prohibit us from including in filings with the SEC. U.S. Investors are urged to consider closely the disclosure in our Form 20-F, File No. 1-12102 available on the SEC website www.sec.gov.

Our estimates of EURs, included in our Development Costs, are by their nature more speculative than estimates of proved, probable and possible reserves and accordingly are subject to
substantially greater risk of being actually realized, particularly in areas or zones where there has been limited history. Actual locations drilled and quantities that may be ultimately recovered from
our concessions will differ substantially. Ultimate recoveries will be dependent upon numerous factors including actual encountered geological conditions and the impact of future oil and gas
pricing.

                                                                                                                                                                                                               2
CONTENTS

COMPANY DESCRIPTION

BUSINESS PLAN 2019-2023

                          3
YPF TODAY

A 95-year-     Publicly        The largest        World-class      The leading downstream player        YPF Luz fifth-
old            traded          O&G producer       shale producer   in Argentina                         largest power
company        corporation     in Argentina                                                             generator in
                                                                   • 3 refineries: 50% of Argentina´s
               since 1993 on                                         capacity. Over 320 kbbl/day        Argentina:
               the NY and BA                      The biggest
               Exchanges                          outside the US   • +1,500 gas stations. +36% Market
                               542 Kboe/d (LTM)
                                                                     Share                              1.8 GW
                               41% Market                          • +55% Market Share of diesel and
The Company USD 3,400 (LTM)                       98.4 K boe/d      gasoline
                               Share
that invests
most in                                                            • 120 branches covering the agro
                                                  659 productive    sector
Argentina                                         wells
                                                                   • #1 petrochemical manufacturer:
                                                                     output of over 2.2 mm tons/year                     4
LEADING ARGENTINE O&G COMPANY

UPSTREAM                                                                      DOWNSTREAM
MARKET SHARE BREAKDOWN (%)                                                    MARKET SHARE BREAKDOWN (%)

 Oil                                          Others                          Crude Processing 1                No. of Gas Stations 2
 Production 1                                           20%
                                                                                            Others
                                                                                                                   Others
                                                   2%                   45%
                                                  3%                                       4% 2%
                                                                                                                            27%
                                                  4%                                 16%                                             35%
                                                                                                    61%
                                                   5%
                                                                                                                       6%
                                                            21%                     17%
                                                                                                                        6%
                                                                                                                             12% 14%

                                                 Others
 Gas                                                                          Gasoline 1                        Diesel 1
                                                        19%             38%
 Production 1                                                                              Others                           Others
                                                  4%
                                                                                              5%                              7%
                                                   6%                                       4%                              5%
                                                                                       15%                56%          15%           59%
                                                       8%
                                                            10%   15%
                                                                                          20%                              14%

 Source: IAPG
 (1)   Cumulative January – September 2018.                                                                                                5
 (2)   As per 20-F 2017.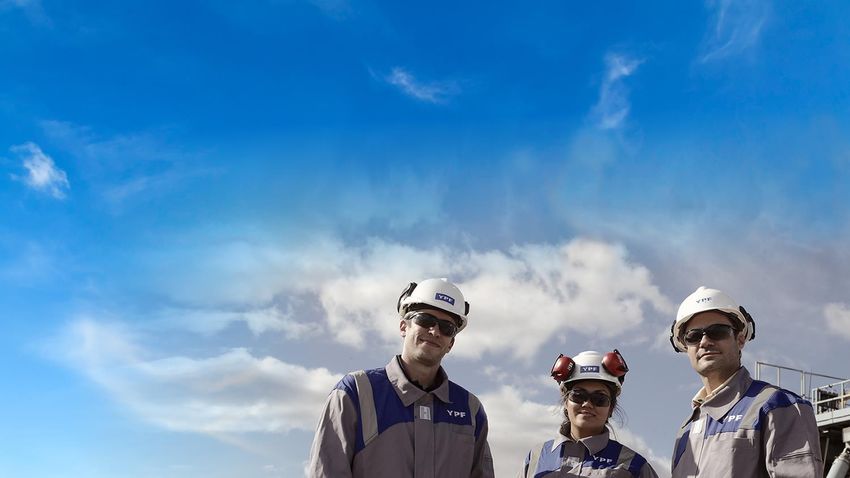
INTEGRATED ACROSS VALUE CHAIN

  Oil                                                         Domestic
                                                                         Purchases                Domestic market

  business                                                    market
                                                                                                  83% Domestic prices (gasoline, diesel)         90%
                                                                                                  17% International prices (bunker, jet fuel,
                                                                                                  petrochemicals, lubricants, LPG and others)

                                             Production                              Refining     Exports
                                             228 Kbbl/d                              285 Kbbl/d   International prices
                                                                                                                                                    10%
                                                                                                  (naphtha, LPG, jet fuel, petrochemicals,
                                                                                                  fuel oil, soybean oil and meal and others)

  Natural gas                                                                                     32%                                      36%
                                                                                                  Residential                              Power
  business                                                                                        + CNG                                    plants
                                            Upstream                                 Domestic
                                            43 mm m3/d                               market
                                                                                                  32%
                                                                                                  Industrial

Production figures and natural gas business as LTM Q3 2018.
                                                                                                                                                          6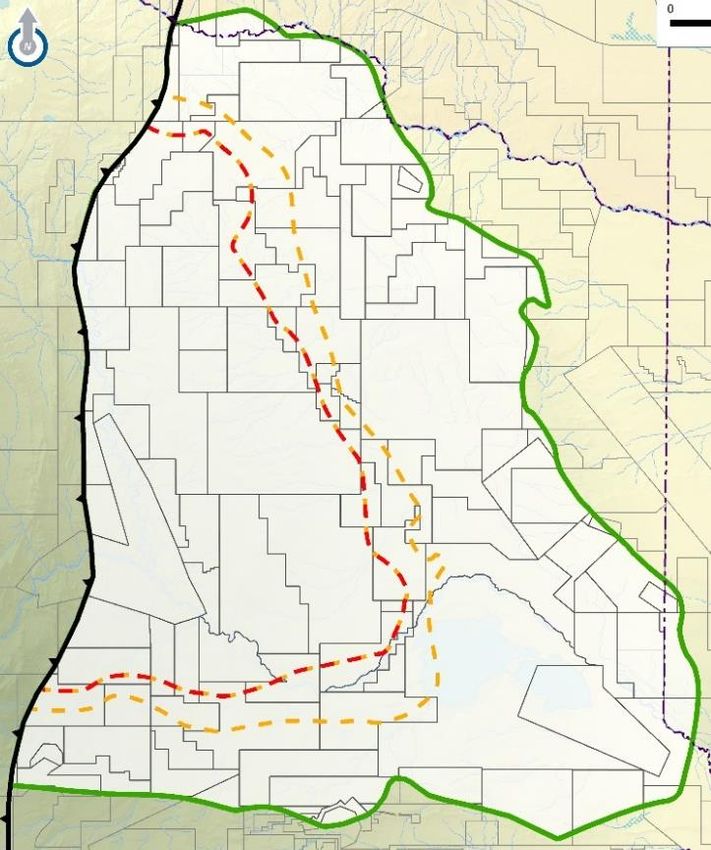
UPSTREAM: SIGNIFICANT POTENTIAL WITH
  LEADING MARKET POSITION

Cuyana
                                                                                         YPF has 112 concessions in the most productive Argentine
Proved reserves: 29 mm boe
                                                                                         basins (total reserves 1P: 929 mm boe) and 23 exploration
% liquids: 99%                                                                           blocks in the country
% gas: 1%
Production: 7.1 mm boe
                                                                                         2017
Neuquina
Proved reserves: 590 mm boe                                                              Proved reserves 1              Production share
% liquids: 40%
% gas: 60%
Production: 141.5 mm boe                                   Noroeste                                                                                     Others

                                                           Proved reserves: 29 mm boe      Gas                                                          18%

                                                           % liquids: 10%
                                                           % gas: 90%                      48%                          Pluspetrol
                                                                                                                        3%
                                                           Production: 6.3 mm boe
                                                                                                                        Sinopec
                                                                                                                        3%
                                                           Golfo San Jorge                                                                                       YPF
                                                                                                                        Pampa
                                                           Proved reserves: 243 mm boe                                                                           41%
                                                                                                                        3%
                                                           % liquids: 85%
                                                           % gas: 15%                                                   Tecpetrol
                                                                                                                        4%
                                                           Production: 39.5 mm boe

                              Austral                                                                                    Wintershall
                                                                                                                         5%
                              Proved reserves: 37 mm boe
                              % liquids: 12%
                                                                                                              Liquids                                   Pan American
                                                                                                                                                        17%
                              % gas: 88%
                              Production: 8.2 mm boe
                                                                                                              52%                                   Total Austral
                                                                                                                                                    6%

                                                                                          Total: 929 mm boe              Total: 359.3 mm boe

Source: Company data 2017.                                                                                                    Source: IAPG, as of September 2018.
(1) As of December 2017.
                                                                                                                                                                       7
PROVED RESERVES ESSENTIALLY FLAT

  TOTAL HYDROCARBON RESERVES
  (MBOE)

                                                  1.212   1.226
    1.132                                 1.083                   1.113
            1.014   982    1.005   979                                    929

     2008   2009    2010   2011    2012   2013    2014    2015    2016    2017

                                                                                 8
DOWNSTREAM: SOLID MARKET LEADERSHIP

                                                                                                   Monthly Diesel Sales (Km3)
                                                                                                   800
       Luján
    Proved      de Cuyo
            reserves:       refinery
                      85 M boe                                                                                                     +8.7%
  A % liquids: 98                                                              D                   750         2018
       Capacity:
    % gas:  2       105.5 kbbl/d
    Production: 8.8 M boe                                                                          700                                             2017

                                                                                                   650
      La Plata    refinery
  BProved  reserves:
   % liquids: 98
                     85 M boe

       Capacity:
    % gas: 2        189 kbbl/d                                                                     600                                     2016
    Production: 8.8 M boe
                                                  A
                                                                                                   550

                                              C                                                    500
                                                                      B                                  Jan Feb Mar Apr May Jun   Jul Aug Sep Oct Nov Dec

                                                                                                   Monthly Gasoline Sales (Km3)
                                                                                                   500
                                                                                                   480            2018             +2.9%                  2017
                                                                                                   460
                                                                          Plaza Huincul refinery                                                          2016
                                                                      C                            440
                                                                          Capacity: 25 kbbl/d      420
                                                                                                   400
                                                  Oil pipeline                                     380
                                                                          Refinor(1)
                                                  Products pipeline   D                            360
                                                                          Capacity: 26.1 kbbl/d    340
                                                  Terminals
                                                                                                   320
                                                                                                   300
                                                                                                         Jan Feb Mar Apr May Jun   Jul Aug Sep Oct Nov Dec
Source: 20-F 2017.                                                                                                                                               9
(1) YPF owns 50% of Refinor (not operated).
FUEL PRICES ALREADY IN LINE WITH IMPORT PARITY
  AFTER GRADUAL ADJUSTMENTS

FUELS BLENDED PRICE VS IMPORT PARITY(1)
(% VARIATION)

      Oct-17      Nov-17         Dec-17         Jan-18         Feb-18         Mar-18         Apr-18        May-18         Jun-18         Jul-18         Aug-18        Sep-18         Oct-18         Nov-18

                                                                                 Import Parity                  Fuels Blended Price

(1)    Import parity includes international reference price for heating oil, RBOB and biofuels, each of them weighted by sales volumes of our regular and premium diesel and gasoline. Fuels blended prices
       and Import Parity prices based on monthly average prices, except for November 2018 that refers to prices as of November 7, 2018.
                                                                                                                                                                                                              10
SIMPLIFYING CURRENT PROCESSES
2018 MAIN INITIATIVES
TRANSFORMATION
STRATEGY Well construction optimization
Upstream operational efficiency
Logistic optimization
15 +1,000 Energy efficiency
Key People people with
fully dedicated transformation Downstream operational efficiency
objectives
130 66
company critical
projects projects
11MANAGEMENT BY OBJECTIVES
INCENTIVE-BASED COMPENSATION
Company-wide objectives cover Approximately
Sustainability, Efficiency, Capital 82% 1,000
Discipline, Financial Discipline of employees receive
short-term cash bonus employees
and Transformation
based on objectives receive long-term
and performance stock compensation
Over 90 units have
specific objectives
Approximately 12,000 employees
have individual objectivesOUR CASH POSITION IS ENOUGH TO COVER
NEXT 12 MONTHS DEBT MATURITIES
FINANCIAL DEBT AMORTIZATION SCHEDULE (1) (2) USD denominated debt
DETAILS
(In Millions of USD) Peso denominated debt
1,759 1,767 89.8% denominated
in USD and 10.2%
1,461 1,491 in Argentine Pesos
1,306
Average interest rates
of 7.34% in USD
and 36.70% in Pesos
675 693
601 625
489 Average life
of 6.3 years
Net Debt /Recurring
Cash &
Equivalents (3)
2018 2019 2020 2021 2022 2023 2024 2025 2027+
LTM Adj. EBITDA
1.7x (3)(4)(5)
(1) As of September 30, 2018.
(2) Converted to USD using the September 30, 2018 exchange rate of Ps 41.15 to U.S $1.00.
(3) Includes cash & equivalents, including Argentine sovereign bonds BONAR 2020 and BONAR 2021.
(4) Net debt to Recurring LTM Adj. EBITDA calculated in USD. Net debt at period end exchange rate of Ps 41.15 to U.S $1.00 and Recurring
LTM Adj. EBITDA calculated as sum of quarters.
(5) Recurring LTM Adj. EBITDA = Adjusted EBITDA excluding the profit by revaluation of YPF S.A.'s investment in YPF Energía Eléctrica
(YPF EE) for Ps 12.0 billion in Q1 2018. 13CONTENTS
COMPANY DESCRIPTION
BUSINESS PLAN 2019-2023
14OUR STRATEGY
Operational Profitable
excellence and growth
sustainability
STRATEGIC
Financial PLAN Innovation
discipline and technology
Transformation Integrated
of our operations energy company
and cultureSAFETY AND SUSTAINABILITY AS CORE VALUES
TOTAL IFR
# of people injured for each million hours worked
2012 - 2018
(1)
1.89 YPF IFR ARPEL TIDLP
ESG TARGETS BY 2022
1.05 1.05
0.91
0.91
0.74
10% CO2 emissions
reduction
0.84
0.76 0.80 0.73
0.60
70% ofbefuels produced will
low-sulphur content
0.51
Renewable energy producer.
#1 Representing 20% of our total capacity
2012 2013 2014 2015 2016 2017 Sep-2018
(1) ARPEL TIDLP = # of injuries with days lost per million hours workedOUR TARGETS
5-YEAR BUSINESS PLAN / 2019-2023
(2)
PRODUCTION RESERVE Adj. EBITDA CAPEX NET DEBT
CAGR R.R (1) CAGR PER YEAR TO EBITDA
2019 - 2023 2019 - 2023 2019 - 2023 2019 - 2023 2023
5-7% >1x 10% 4-5 BUSDPLANNING FOR OUTSTANDING PRODUCTION GROWTH
Building on our strength as unconventional leader outside USA
PRODUCTION (KBOE/DAY) Oil NGL Gas
2018-2023
5-7%
CAGR
+20%
Favoring High return &
Short cycle developments
3 FIDs before end 2018
+55%
Supported by strong
portfolio with low break
even price
2018 2019 2020 2021 2022 2023PRODUCTION GROWTH DRIVEN BY UNCONVENTIONAL PROJECTS
TOTAL PRODUCTION (KBOE/DAY) Unconventional CAPEX Unconventional
2018-2023 Conventional 2019-2023 Conventional
5-7%
CAGR
~70% 31%
33%
~3.6 BUSD
per year
69%
67% ~30%
2018 2019 2020 2021 2022 2023WHILE ACTIVELY MANAGING THE DECLINE OF OUR CONVENTIONAL FIELDS
CONVENTIONAL PRODUCTION (KBOE/DAY) Secondary Natural gas
2018-2023 Primary Tertiary
Base curve
-14% -5%
Per year
Per year Smoothing the decline
rate by accelerating
implementation of IOR/EOR
Deploy technology to optimize in
real time and reduce downtime
Improved reservoir management
and secondary recovery
Replicate confirmed
success in tertiary recovery
and continue de-risking
2018 2019 2020 2021 2022 2023EXPANDING UNCONVENTIONAL OUTPUT FROM VACA MUERTA
UNCONVENTIONAL PRODUCTION (KBOE/DAY)
2018-2023
Tight gas La Amarga Chica Rincón del Mangrullo Other Shale Projects
Base curve Loma Campana Bandurría Sur A. De la Arena
+150%
VACA MUERTA
2019-2023
~18 Average operated rigs
~1,700 shale wells
2018 2019 2020 2021 2022 2023MAJOR SHALE PROJECTS
GAS OIL
2019 Rincón del Mangrullo Loma Campana Ph2
La Ribera La Amarga Chica
Bandurria Sur
2020 Aguada de la Arena San Roque
La Calera Bajada de Añelo
A. Pichana Oeste
Pampa de las Yeguas I
2021 Bajo del Toro
LLL West
Chihuido de la SN
2022 LLL Sur
Operated Operated
Non operated Non operatedLOMA CAMPANA CONTINUOUSLY INCREASING WELL PRODUCTIVITY
AVERAGE CUMULATIVE OIL PRODUCTION (KBOE)
200
Cum. Production
150
+ 40%
(2016 - 2018)
100
Avg 2018 (27 stg) 22 wells - EUR 900 kboe
50
Avg 2017 (21 stg) 30 wells - EUR 720 kboe + 35% 40% increase in IP 270
Avg 2016 (17 stg) 56 wells - EUR 660 kboe
0
35% increase in EUR
1 2 3 4 5 6 7 8 9 10 11 12 13 14 15 16 17 18 19 20 21 22 23 24 25 26 27 28 29 30
MonthsAND REDUCING DEVELOPMENT COST AND OPEX
DEVELOPMENT COST (USD/BOE) OPEX (USD/BOE)
29 16
-62%
-56%
-14%
-27% ~7
~11 ~6
~8
2015 Q3 18 2023 2015 2018 2023SHALE GAS DEVELOPMENT DRIVES A NEW PARADIGM IN GAS MARKET
Similar to USA, Argentina is shifting from gas importer to gas exporter
240
Domestic base demand Potential production
Mm3/d Mm3/d
220
200
180
160
140
120
100OPPORTUNITIES ALONG THE INTEGRATED GAS VALUE CHAIN
UPSTREAM MIDSTREAM EXPORTS POWER GENERATION PETROCHEMICALS
# 1 acreage holder MEGA: Potential 2019 Expect 3 to 4 GW Under study:
outside USA expansion under study Exporting gas to Chile of new thermal - Urea
Small scale LNG installed capacity in - Methanol
Underground Argentina by 2023
+450,000 storage: feasibility - Polyethylene
core net acres study 2024+ - Polypropylene
(+95% undeveloped) Large scale LNG
Transportation: under study
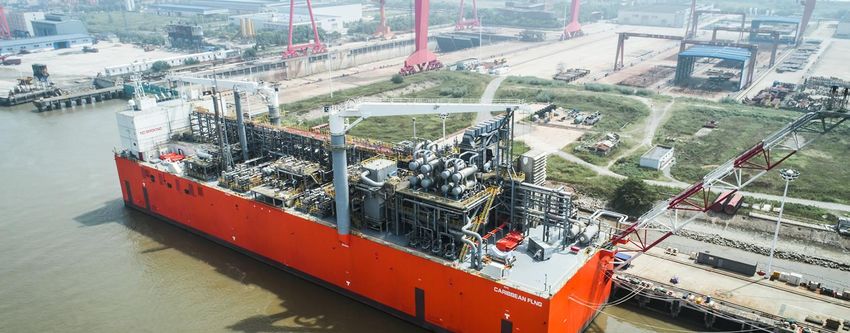
3rd party projectTANGO FLNG BARGE-BASED FLOATING LIQUEFACTION UNIT
First step towards positioning
Argentina as an LNG export player
Arriving Q1 -2019 –
LNG production Q2 2019
Expected sales around
USD 200 million per year
LOCATED LIQUEFACTION CAPACITY STORAGE CAPACITY CONTRACT SUPPLIER
Bahía Blanca 500,000 ton/year, 16.100 m3 LNG 10-year EXMAR
port equivalent to 2,5 MMSm3/d
of natural gasDOWNSTREAM BUILDING ON OUR LEADING POSITION TO DELIVER VALUE OPTIMIZING PURSUING LOGISTIC OUR OPERATIONS EFFICIENCY 100% Crude oil self sufficiency by 2021 Oil pipelines expansion +15% Crude processing Road trains improvement +20% Diesel and gasoline production Export infrastructure development -5% OPEX reduction New San Lorenzo terminal
RESHAPING OUR BUSINESS
TO PROFIT FROM SHALE GROWTH AND NEW TECHNOLOGY

A CLEANER PLATFORM                               DIGITAL TRANSFORMATION

 IMO 2020 full compliance                         Analytics to optimize our
                                                  processes, asset integrity
                                                  and predictive maintenance
 Low sulphur fuel specs

                                                 Satellite monitoring
 Low carbon project integration                  of pipelines

                                                  Digital integrated planning

 IMO: International Maritime Organization
WE EXPECT YPF LUZ TO INCREASE ITS POWER-GENERATION CAPACITY
7 YPF POWER GENERATION CAPACITY 900
2018-2023
800
6
Pipeline + M&A
Current capacity + awarded / under construction 700
5 Pipeline
and 600
M&A
opportunities
4 500
3 400
2.4 GW 300
2 1.9 GW
1.7 GW 200 Renewable energy
1 representing 20%
100
of our total capacity
0 0
2017 2019 2023E
2023INVESTING WITH FOCUS ON PROFITABLE GROWTH
(1)
ADJUSTED EBITDA CAPEX BREAKDOWN
2019-2023
CAGR
+10%
5%
19%
~4.5 BUSD
per year
76%
Upstream
Downstream
Other segments
2018 2019 2020 2021 2022 2023
(1) Adjusted EBITDA = Operating income + Depreciation and impairment of property, plant and equipment
and intangible assets + Amortization of intangible assets + unproductive exploratory drillings.INCREASING FREE CASH FLOW
Net debt/ EBITDA at 1.5x
CFFO Net debt/ CAPEX Dividends
CASH BUILD-UP (BUSD) EBITDA + interest
2019-2023 + taxes
1.5x 1.5x
Up to (1)
Additional cash
1.4x 4.2 BUSD for investments
0.7x
Cumulative
1.5 BUSD free cash flow
2019 2020 2021 2022 2023
(1) Considers the maximum potential level of net indebtedness to reach a ratio of 1.5xINVESTOR PRESENTATION
November 2018
33You can also read