Agility Earnings Call Presentation - Q1 2021 Results Thursday, 20th May 2021 - Agility ...

Page created by Alicia Caldwell
 
CONTINUE READING
Agility Earnings Call Presentation - Q1 2021 Results Thursday, 20th May 2021 - Agility ...
Thursday, 20th May 2021

Agility Earnings Call
Presentation
Q1 2021 Results
Agility Earnings Call Presentation - Q1 2021 Results Thursday, 20th May 2021 - Agility ...
Disclaimer

        This presentation is strictly confidential and is being shown to you solely for your information and may not be
        reproduced, retransmitted, further distributed to any other person or published, in whole or in part, for any purpose.

        This presentation has been prepared by Agility Public Warehousing Company KSCP (“Agility”) and reflects the
        management’s current expectations or strategy concerning future events and are subject to known and unknown risks
        and uncertainties.

        Some of the statements in this presentation constitute "forward-looking statements" that do not directly or exclusively
        relate to historical facts. These forward-looking statements reflect Agility’s current intentions, plans, expectations,
        assumptions and beliefs about future events and are subject to risks, uncertainties and other factors, many of which
        are outside Agility’s control. Important factors that could cause actual results to differ materially from the expectations
        expressed or implied in the forward-looking statements include known and unknown risks. Agility undertakes no
        obligation to revise any such forward-looking statements to reflect any changes to its expectations or any change in
        circumstances, events, strategy or plans. Because actual results could differ materially from Agility’s current
        intentions, plans, expectations, assumptions and beliefs about the future, you are urged to view all forward-looking
        statements contained in this presentation with due care and caution and seek independent advice when evaluating
        investment decisions concerning Agility.

        No representation or warranty, express or implied, is made or given by or on behalf of Agility or any of its respective
        members, directors, officers or employees or any other person as to the accuracy, completeness or fairness of the
        information or opinions contained in or discussed at this presentation.

                                                                                                                                      2
Agility Earnings Call Presentation - Q1 2021 Results Thursday, 20th May 2021 - Agility ...
Agenda

  1   DSV-GIL Transaction overview
  2   Financial Highlights

  3   Business Segments
  4   Sustainability

  5   Q&A

                                     3
Agility Earnings Call Presentation - Q1 2021 Results Thursday, 20th May 2021 - Agility ...
DSV-GIL Transaction Overview

                               4
Agility Earnings Call Presentation - Q1 2021 Results Thursday, 20th May 2021 - Agility ...
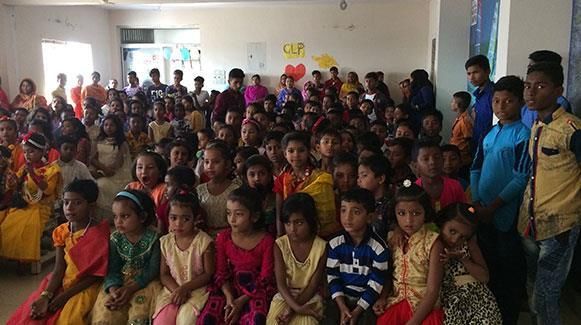
Key terms of DSV acquisition of Global Integrated Logistics
 Agility to remain a key supply chain player and becomes the second largest shareholder
 in DSV and hold a Board seat

                                                          • DSV will acquire Agility’s Global Integrated Logistics (“GIL”) business in exchange for 19.3M shares
                Overview                                  • After completion of the transaction, DSV has agreed to nominate an Agility designee to DSV’s Board of Directors
                                                          • Agility will be the 2nd largest shareholder in combined company, based on today’s shareholder register

               Transaction Terms                         • GIL business valued for an Enterprise Value of ~ $4.2 Bn (KWD1.3 Bn) and Equity Value of $4.1 billion (KWD 1.2 Bn) at
                                                           announcement

                                                          • Expect GIL to be reported as part of Agility financials until Completion as per IFRS 5
                Reporting                                 • Post Completion the management intends to report the investment in DSV as a Financial asset at fair value
                                                            through other comprehensive income i.e. Through Equity as per IFRS 9. This accounting treatment is subject to
                                                            final Board approval.

                Timing                                    • Completion of the transaction is expected towards the end of the third quarter of 2021

                                                          • Services Agreement: DSV to provide Agility with certain services in connection with its SHIPA business
                                                          • Framework Agreement: DSV to (i) appoint Agility as the developer of choice for any development in MEA
                Other Agreements
                                                            (excluding, South Africa), India; and (ii) provide Agility with the opportunity to be a strategic partner in any future
                                                            real estate funds or investments

                                                                                                                                                                                      5
*The transaction is subject to satisfaction of regulatory conditions and approval by Agility’s shareholders.
Agility Earnings Call Presentation - Q1 2021 Results Thursday, 20th May 2021 - Agility ...
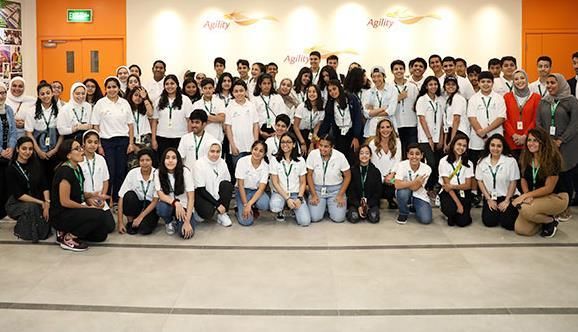
Agility has been clear that consolidation is a priority
And the timing is right to act now

                                                Agility has been open to                       Changing industry
    Increased scale is needed
                                                consolidation for some                      dynamics make this good
      in a competitive sector
                                                        years now                                   timing

   Wider industry consolidation has          GIL was built by acquisition; it’s how   Industry even more attractive for M&A
    been occurring for years                   the industry works                       because of:
   Economies of scale are critical in        GIL today is subscale; ranked 21st        COVID-19: supply chain disruption,
    freight forwarding, with significant       in the industry, in terms of                logistics as an essential industry
    commercial and operation benefits          Revenues in 2020                          E-commerce: accelerated
   The industry is getting more              Some past consolidation and                 dramatically, with gains in the last
    competitive, with growing customer         merger attempts were made by GIL;           year equivalent to gains in the last
    expectations around better                 but targets are scarce (with high           ten
    capabilities and reach                     valuation) and integration risks are      Digital: Technology is reshaping
                                               material                                    supply chains and underlying cost
                                                                                           considerations of manufacturing

                                                                                                                                  6
Agility Earnings Call Presentation - Q1 2021 Results Thursday, 20th May 2021 - Agility ...
Why DSV
          DSV shows significant financial robustness
           DSV has secured a high rating from both S&P (A-) and Moody’s (A3)
           The recent EBIT performance is strong, and superior if compared to GIL’s
           The firm shows resiliency through economic cycles, being solid and supported by reputable shareholders

          DSV has a proven track-record of integration
           DSV has extensive experience of integrating acquired businesses and delivering synergies
           It has also shown significant improvements in terms of ability to grow organically

          DSV and GIL have good complementarity
           The two firms combined will become a strong player in the market, taking advantage of significant synergies
           Good complementarity in terms of products and services offered, geographical focus, and customers served
           Similar corporate culture with focus on customer service, entrepreneurship and corporate responsibility

          DSV is valuing GIL at a significant premium
           DSV offer is valuing GIL at an enterprise value of $4.2 Bn as of announcement date
           This offer comes with a significant premium to GIL standalone valuation based on a range of methods including current trading level
            of peers, precedents and intrinsic valuation

          DSV and Agility will explore other forms of collaboration
           In addition to the offer for GIL, DSV has offered other forms of collaboration
           These would cover different areas, such as Real Estate, e-commerce, CSR platform and more
           Agility is not exiting the logistics industry, it remains a key player in Supply Chains Globally

                                                                                                                                                  7
Agility Earnings Call Presentation - Q1 2021 Results Thursday, 20th May 2021 - Agility ...
The combined company creates a top-three industry leader
Third-party logistics providers by 2020 revenue in USD billion

  1                    DHL Logistics (DE)                                                                                                  32.4
  2                  Kuehne + Nagel (CH)                                                                                            25.4
      Combined DSV Panalpina + Agility…                                                                                      21.7
  3                     DB Schenker (DE)                                                                              19.4
  4                   Nippon Express (JP)                                                                         18.5

 5                    DSV Panalpina (DK)                                                                       17.7
                      C. H. Robinson (US)                                                               15.1
  6
                       XPO Logistics (US)                                                        11.3
  7
                                  UPS (US)                                                      11.0
  8
                          Expeditors (US)                                                10.1
  9
                            J. B. Hunt (US)                                        9.2
 10
                             Dachser (DE)                                    7.7
 11                        Sinotrans (CN)                                   7.4
 12                   CEVA Logistics (CH)
                                      (FR)                                  7.4
 13                            Bolloré (FR)                           6.6
 14                     SNCF Geodis (FR)                        5.8
 15                           Kintetsu (JP)                5.2
 16                   Kerry Logistics (HK)                5.1
 17                             Gefco (FR)               4.9
 18                    Samsung SDS (KR)                  4.8
 19                        NYK Group (JP)                4.7
 20                    Rhenus & Co. (DE)                 4.7

 22                       Agility GIL (KW)         4.0
      Source: Journal of Commerce, DSV estimates

                                                                                                                                                  8
Agility Earnings Call Presentation - Q1 2021 Results Thursday, 20th May 2021 - Agility ...
DSV Panalpina Diluted Adjusted Earnings per share (DKK)
16% (20x) CAGR 2002 – 2020 , consistent long term performance

                                                                                                                             33.7

                                                                                                                      26.5

                                                                                                        22.1   22.1
                                                                                                 18.4

                                                                                   12.9   13.4
                                                               9.5   10.1   10.5
                                                         7.8
                                 5.8   6.1         6.2
                           4.5               3.9
                     3.4
   1.7   1.9   2.3

   2002 2003 2004 2005 2006 2007 2008 2009 2010 2011 2012 2013 2014 2015 2016 2017 2018 2019 2020                              Q1
                                                                                                                              2021
                                                                                                                             (TTM)

                                                         CAGR +16%

                                                                                                                                     9
Agility Earnings Call Presentation - Q1 2021 Results Thursday, 20th May 2021 - Agility ...
GIL / DSV Growth Rate Q1 2021

                                            DSV                                     Q1 2021           GIL

                                      USD 1,227 Mn                                  Net Revenue   USD 256 Mn
                                      16.5% Vs Q1 2020                                Growth      16.2% Vs Q1 2020

                                       USD 483 Mn                                      EBIT         USD 54 Mn
                                       95.8% Vs Q1 2020                               Growth        936.6% Vs Q1 2020

                                           39.4%                                    Conversion
                                                                                      Ratio
                                                                                                      20.1%

          USD / DKK 6.3444                                                                                              USD / KWD 0.3022

                                                                                                                                           10
Note: DSV numbers based on Interim Financial Report Q1 2021
* DSV Air Freight volumes are still impacted by discontinued Panalpina activities
GIL Relative Size to Agility Total Group

                                           11
GIL’s Relative Size to the Agility Group
Average 6 years (2015-2020) in KWD MM

  GIL
  Non-GIL

            1,449                 470      132      97      66
                                                     20      10
                                             34            (15%)
                                                   (20%)
                                           (26%)
                                   260
                                  (55%)
            1,081
            (75%)

                                                     78      56
                                             98            (85%)
                                                   (80%)
                                           (74%)
                                   209
                                  (45%)
             368
            (25%)

             Rev                  NR      EBITDA   EBIT     NI

                                                                   12
GIL’s Relative Size to the Agility Group
          Profit and Loss Impact- KWD Mn

                                         +43
                                        (+3%)
                                                                                                   Highlights
                                                          1,621
                     1,578        101             58
                                                                   GIL         Revenues
                                                                   Non-GIL         GIL contributed ~ 70-75% of Agility’s total revenues.
   Revenues

                     1,115                                1,216
                     (71%)                                (75%)                    The majority (~75%) of GIL revenues are Freight
                                                                                    Forwarding related Revenues, which makes net
                                                                                    revenues a better metric to assess the impact post
                      463                                  405
                                                                                    closing
                     (29%)                                (25%)
                                                                                   Non GIL revenue post closing is estimated to be KD
                     2019A        GIL           Non-GIL   2020A                     400-450mln
                                                                               Net Revenues
                                         -38
                                        (-7%)                                      GIL contributed 51-57% of Agility’s total net
Net Revenues

                    532
                                 11                                                 revenues.
                                                  49        494
                                                                                   GIL Weight has increase in 2020 due to COVID
                    272                                             GIL
                   (51%)                                    283                     Impact
                                                           (57%)    Non-GIL
                                                                                   It is expected that post closing NR margin will
                                                                                    improve from ~30% to more than 50%
                    260
                   (49%)                                    212
                                                           (43%)

                   2019A         GIL            Non-GIL    2020A
                                                                                                                                            13
GIL’s Relative Size to the Agility Group
        Profit and Loss Impact- KWD Mn

                                    -41                                                                 Highlights
                                  (-32%)
               127
                22
                             5
                                                                     GIL          COVID impacted the non-GIL segment
              (18%)                           46                     Non-GIL       disproportionately, while the impact on GIL was
                                                        85                         favourable
  EBIT

                                                         27
                                                       (32%)                      Furthermore, GIL took significant cost measure at the
               104                                                                 beginning of COVID which helped GIL to outperform.
              (82%)
                                                         58                        However, GIL had to take a one-off restructuring cost of
                                                       (68%)                       ~KD 13mln
                                                                                  Non-GIL performance includes a KD 28mln one off
              2019A         GIL            Non-GIL     2020A
                                                                                   impact of Amghara land
                                                                                  These factors have lead to the increase in the weight of
                                    -45                                            GIL relative contribution to the overall group’s
                                  (-52%)                                           performance and contributed in 2020, 32% and 29% to
                 87
Net Income

                 10          2                                                     EBIT and NP of the group respectively compared to
                                                               GIL
               (12%)                                                               18% and 12% in 2019.
                                                               Non-GIL
                                             47
                                                                                  It is expected that the non-GIL segment profitability will
                                                       42                          recover post COVID.
                 77                                    12
               (88%)                                 (29%)

                                                       29
                                                     (71%)

               2019A        GIL            Non-GIL   2020A

                                                                                                                                                14
GIL’s Relative Size to the Agility Group
                              Balance Sheet Impact* - KWD Mn
                                                                                                                                                                          Highlights
        Total Assets & Liabilities

                                                                 2,272                                 2,272
                                                                                                        415                    GIL
                                                                 807                                   (38%)                                        GIL represents 36% and 38% of the total assets and total
                                                                (36%)                                                          Non-GIL Segment
                                                                                                        666
                                                                                                                               Equity
                                                                                                                                                     liabilities respectively in 2020.
                                                                                                       (62%)
                                                                                                                                                    Net carrying value of GIL is ~KD 390mln as of end of 2020
                                                                1,465                                                                               Non-GIL segment had the lion’s share of the capex
                                                                (64%)                                  1,191
                                                                                                      (100%)                                         /Investments spent over the last 5 years
                                                                                                                                                    Non-GIL Net Debt to EBITDA stood at 3.3x in 2020 (2019:
                                                             2020 Assets                      2020 Liabilities & Equity                              1.4x) due to COVID impact on EBITDA as well as the
                                                                                                                                                     increase in Capex funding
                                                             Non-GIL will be left with 19.3MM
                                                                                                                                                    Capex was mainly spent on Reem Mall, Ships in Tristar,
                                                             highly liquid (1) DSV shares which
                                                             could more than repay the group
                                                                                                                                                     Investments in Hyliion and other.
Net Debt to EBTIDA

                                                             debt if required                           1.61
                                                                                                                               GIL
                                                                                                                                                    Going forward, it is expected that the level of capex in non-
                                                                                                                               Non-GIL Segment       GIL segment will be lower compared to the last 5 year avg.
                                                                 0.90                                   3.33                                         as some projects will be delivered.

                                                                 1.40

                                                                 0.86
                                                                                                        1.67

                                                                2019A                                  2020A

                                                                                                                                                                                                                             15
                                     Notes:
                                     1. DSV has $50.5 Bn of Market Capitalization and a L1M average volume traded of 0.43 MM as of 07-May-21                                       * All are adjusted for Operating Leases
Post Closing Agility’s Profile

                                           Post Closing Profile

              Strategic, Controlled       Strategic, non-controlled        Future Investments
                   Businesses                    businesses                Agility will have a Strong
            Pre-COVD EBIT of ~KD 104mln   Estimated Value of KD 1.5bln   balance sheet with the ability
                    ($345mln)                (~$5bln), 753 fils/share               to invest

                ALP                           DSV                          Organic investments
                Tristar                       NREC                         Acquisitions
                NAS                           GWC                          ESG Sector related
                UPAC ex RM                    RM                           Other
                GCS                           Tech

                                                                                                          16
Post Closing Agility’s Profile – Financial Snapshot
Well positioned for further growth

                Strategic, Controlled Entities                                                   Strategic, Non-Controlled Entities
                           Absolute Value in KWD Mn                    CAGR (%)                                                                       Total Value

                                                            2020     2016- 2016-                                                                        M KWD
                        2016     2017     2018     2019
                                                              *       19    20
                                                                                         Total Quoted Securities*                                                      1,453

 Revenue                307       346      398      463      405    14.8% 7.2%
                                                                                         Total Unquoted Securities                                                      154
 Net Revenue            184       218      234      260      212    12.2% 3.6%
 EBIT                    65       82       98       104       58    16.9% -2.9%          TOTAL                                                                         1,607
                                                                                         Debt **                                                                        167
 EBIT Margin            21%      24%      25%      22%      14%
                                                                                         NET VALUE                                                                     1,441
 EBIT Margin
                         7%       7%       8%       8%       5%
 inc. GIL
                                                                                         Agility # of Shares Outstanding                                  1,913,539,451
 Net Debt **                                                  86
                                                                                         Value per Share (KWD)                                                         0.753

* 2020 Revenue was impacted by the Covid-19 pandemic and 2020 EBIT included a one-
  time expense of KWD 28 M associated with the loss of Amghara Land.                     * Quoted Securities are valued as 18 May 2021 and include DSV, GWC, NREC, Hyliion,
                                                                                            Tortoise II, and Queen’s Gambit shares.
** To calculate net debt of controlled entities total Net Debt in 2020 of KWD 253 M is
    adjusted for funds used to fund RM, NREC shares acquisition, and other investments   ** Figure includes funds used to fund RM, NREC stake, some Tech investments
                                                                                         .
Note: These figures are based on unaudited estimates and are subject to change upon
  finalizing the closing process
.
                                                                                                                                                                               17
Shareholders’ Value Creation

                               18
Company’s Mission 1997

                              Chairman’s Message “Annual Report 1997”

               “Of particular importance is                 “The Public Warehousing
                  the realization that our                Company (Agility) intends to
                 company’s future growth                  become a leading facilitator
                prospects will be limited if              of commerce and commerce-
                we continue to restrict our               related logistics through the
                      activities to the                   development of high quality
                management of low value-                     and innovative services
                     added real estate                     which create value for our
                        properties”                           esteemed customers”

       “Privatization earmarked a period of change, development and redirection
                        in the face of new opportunities and risk”

                                                                                          19
Value Creation Since Privatization – 1997 to May 2021
(KD Mn)
                               IRR for 24 years is ~ 28% (~62x of pre-privatization value)

                                                  +2,628
                                                (+6,098%)                            Summary income statement
                                                                            2,671
                                                                                                                                                           CAGR    Growth
                                                                                                                         1997**            2019   2020     1997-    1997-
                                                                2,086                                                                                       2019    2019
                                                                                     Revenue                                8.4          1578.6   1620.7   26.9%    188X
                                                                                     EBIT                                   4.6           125.3    85.5    16.2%    27.2X
              43                        542                                          Net income                             5.2           89.3     47.5    13.8%    17.2X
      Mcap Pre- *                   Cash Div                 Value Growth   May-21
     Privitization

 *an estimate of price before privatization                                            2019 is a better comparison as 2020 has the COVID impact
 ** estimates of recurring earning power pre-privatization

                                                                                                                                                                            20
The company has a strong track record of value creation
     2011-May 2021 (KD Mn)
                         Value Creation & Aspirations (KD Mn)
        Created KD 2 Bln in value for our shareholders with 25% IRR since 2011
              Value Growth -1,741 KD Mln (88%)
              Dividends1- KD 240 Mln (12%)

                                                                                                                       758
                                                                                                                      +55%     2,369

                                                                                                                       758
                                                                                                      234
                                                                                                      19%
                                                                                            179              -72 8
                                                                                           +17%       213       -63
             +1,982                                                                  335              22       -4%
                                                                                    +45%        160
             (512%)                                                                        19
                                                          137             204       318
                                                  254    +18%            +35%
                                                                   38                17
                                                 +48%        96
                                                        42        -272        170
                                   176                                   35
                                                 225
                                  +46%                            -234
                                                 30
                         387          147                         -27%
                                 30

                         387

                   Dec 11 MCap     2012          2013    2014     2015    2016      2017    2018      2019    2020    May-21   Total

                                                                                                                                       21
1   Dividends Declared
Key Takeaways
    Agility will be a better and stronger company

                      Strategic Value                                                                                         Economic Value

    Stronger Logistics               Future Cooperation                                                     Highly Profitable               Unlock Shareholders
                                                                         Financial Flexibility
         Platform                         with DSV                                                          Non-GIL Business                       Value
    DSV is one of the best         Agility and DSV will explore       The deal creates the              The remaining business          GIL was valued at a
     global operators                further areas of cooperation        resources and flexibility to       generates the majority of        premium
    Agility will be the 2nd         with other related Agility          explore new opportunities          Agility’s earnings power        Estimated Return to
                                     businesses- Agility Logistics       for next phase of                 Solid, stable and high-          Shareholders Through
     largest shareholder             Parks, Shipa companies,             company’s growth                   margin                           Dividends and Share
    Agility will have a board       and technology ventures                                                                                 Buybacks of c. $150-250
     seat                                                                                                  Resilient & diversified
                                                                                                                                             MM Per Year for 8.0% Stake
                                                                                                            across geographies,
                                                                                                            services

                                                                                                                                                                    22
Q1 Financial Highlights

                          23
Group Summary Financial Performance
KD Mn
                  Revenue                       Net Revenue

                   +28.6%                          +5.1%

                             485.5                             133.9
                                       127.4

         377.6

                                      Margin                   Margin
                                      33.7%                    27.6%

        Q1 2020             Q1 2021   Q1 2020                 Q1 2021

                   EBIT                          Net Profit
                   +31.2%                         +28.7%

                             26.9                              12.6

          20.5                          9.8

                             Margin
                             5.5%      Margin                  Margin
        Margin
                                       2.6%                    2.6%
        5.4%

        Q1 2020             Q1 2021   Q1 2020                 Q1 2021   24
Group Financial Performance
KD Mn

                         Revenue contribution by Business Group                                            Net Revenue contribution by Business Group

                Y/Y
                                  39.6%              0.3%                28.6%                            Y/Y
               Growth                                                                                                   16.2%          -7.0%             5.1%
                                                                                                         Growth
 GIL
 Infra
                                                                         485.5                                                                          133.9
                                                       0.3                                               127.4                           -4.3
                                                                                          GIL                            10.8
                                  107.6
               377.6                                                                      Infra

                                                                                                          66.5                                           77.2
                                                                         379.3                           (52%)                                          (58%)
               271.6                                                     (78%)
               (72%)

                                                                                                          60.9                                           56.7
               106.0                                                     106.3                           (48%)                                          (42%)
               (28%)                                                     (22%)
               2020                GIL                Infra              2021                           Q1 2020          GIL            Infra           Q1 2021

            GIL revenue and net revenue increase was driven by strong results in Air Freight and
             Contract Logistics

            Infra structure revenue came inline with last year numbers, with some infra entities not
             recovered completely from COVID-19

                                                                                                                                                            25
Group Financial Performance
KD Mn
                       EBITDA contribution by Business Group                                                        EBIT contribution by Business Group

              Y/Y                                                                                           Y/Y
                             139.7%          -29.1%          19.2%             40.3%                                    936.1%      -44.2%         31.2%   71.7%
             Growth                                                                                        Growth
GIL
Infra
                                                                               54.7                                                                          35.2
                                               -8.1            46.4
                              15.6                                                                                                    -8.4
              39.0                                                             26.8                                      14.8                      26.9      16.4
                                                                              (49%)                                                                         (46%)
               11.2                                            26.8                                        20.5
              (29%)                                           (58%)                                         1.6                                    16.4
                                                                                                           (8%)                                   (61%)

               27.8                                                            27.9                         19.0                                             18.8
              (71%)                                            19.7           (51%)                        (92%)                                            (54%)
                                                                                                                                                   10.6
                                                              (42%)                                                                               (39%)

            Q1 2020            GIL           Non-GIL         Q1 2021         Q1 2021                      Q1 2020        GIL        Non-GIL      Q1 2021   Q1 2021
                                                                             Adjusted                                                                      Adjusted

           GIL revenue growth with a range of cost reduction measures resulted in EBITDA growth
           Within infra, EBITDA and EBIT performance came inline with last year’s performance, despite
            some entities still being impacted by the COVID pandemic
           EBITDA and EBIT adjusted for non-operating performance

                                                                                                                                                            26
Balance Sheet
KD Mn

                                                                             Assets            Equity & Liabilities
    Balance sheet                 Q1 2021   Q1 2020    Variance    %

    Current assets                  708.1     695.9      12.3     1.8%
                                                                                                        24.6%
                                                                               30.3%               Current Liabilities
    Non-Current assets            1,632.7    1,545.1     87.7     5.7%     Current Assets

    Total assets                  2,340.9    2,240.9    100.0     4.5%
    Current liabilities             576.2     491.9      84.3     17.1%
                                                                                                        23.9%
    Non-current liabilities         559.5     582.0     -22.6     -3.9%                           Non-Current Liabilities

    Total liabilities             1,135.6    1,073.9     61.7     5.7%

    Shareholders’ equity          1,154.7    1,113.4     41.3     3.7%
                                                                               69.7%
                                                                          Non-Current Assets

                                                                                                        51.5%
Highlights
                                                                                                     Total Equity

Net Debt1                          209.3     165.8

Net Debt1 / EBITDA2                 1.4X      1.4X
                                                                              2,341                   2,341
1   Excluding Lease liabilities
2   Pre IFRS16 and annualized
                                                                                                                            27
Statement of Cash Flows
KD Mn

    Cash Flow Statement                 Q1 2021   Q1 2020   Variance     %                                  Capex Allocation
    Cash from Operating activities
    before changes in working capital    54.9      41.7       13.1     31.5%
                                                                                75      100            94         118         141         46     573
    Changes in working capital           -8.6      -10.0      1.5      -14.7%
                                                                                8.4%
                                                                                                                             11.9%        8.6%
                                                                                        20.5%
                                                                                                                 14.0%                           15.7%   ALP
    Other Items                          -6.0      -5.3                                               27.8%
                                                              -0.7     14.2%
                                                                                                                                         29.6%
    Net Cash flow from operating                                                                                 21.7%
                                         40.3      26.4       13.9     52.5%                                                 30.0%
    activities                                                                          17.9%                                                    29.1%   Tristar
                                                                                58.5%
    Capex + Investments                  45.5      27.7       17.8     64.3%            5.7%          25.5%
                                                                                                                                          8.9%
                                                                                                                 14.2%
                                                                                                                              7.8%
    Net Cash flow from investing                                                                                                                 10.9%   GIL
    activities                           -48.8     -27.6     -21.2     76.6%

                                                                                                      16.6%
    Free Cash Flow                       -8.5      -1.2       -7.3     591.2%
                                                                                12.7%   55.8%                                            53.0%
                                                                                                                 50.1%       50.4%
                                                                                                                                                 44.2%   Other
                                                                                                      30.1%
    Highlights                                                                  20.4%

    Conversion ratio (OCF/EBITDA2)      86.7%     67.8%
                                                                                2016    2017         2018        2019        2020      Q1 2021   Total
    CAPEX as % of Revenue                9.4%      7.3%

                                                                                                                                                               28
2   EBITDA and OCF as reported                                                          1   Others include Reem mall and corporate investment
Business Segments

                    29
GIL Financial Performance Q1 2021
KD Mn

                      Revenue                                Net Revenue

                         +39.6%                                +16.2%

                                   379.3                                    77.2
                                             66.5
             271.6

                                              Margin                        Margin
                                              20.4%                         24.5%

            Q1 2020               Q1 2021   Q1 2020                        Q1 2021

                      EBITDA                                     EBIT
                        +139.7%
                                                              +936.6%
                                   26.8
                                                                            16.4

                                   Margin
                                   7.05%
             11.2                                                           Margin
                                                    Margin                  21.2%
                                                    2.4%
             Margin
             4.1%
                                              1.6

            Q1 2020               Q1 2021   Q1 2020                        Q1 2021
                                                                                     30
GIL Product Performance
KD Mn

              Product Net Revenue Contribution                                  Regional Net Revenue Contribution
               % & (absolute)                                                   % & (absolute)
                                                                                                                    AME
                                                                       AF
                                                                                                                    EUR
                                                                       OF
                                                                                                           15%
                                                                                                                    ASP
                                                   26%                 CL                                 (11.7)
                                                                                                                    MEA
                                                  (20.3)               PL                        7.8%
                                 44.5%                                                 16%
                  21%                                                  Others                                       Growth
                                                                                      (10.9)
                 (14.1)                                                Growth                              27%
                                                                                                          (21.0)
                                                   21%                                           16.6%
                  20%                             (16.4)                               27%
                                 21.3%
                 (13.5)                                                               (18.0)

                                15.6%                                                                      33%
                  29%                              28%                                                    (25.8)
                                                                                       31%       26.3%
                 (19.0)                           (22.0)
                                                                                      (20.4)

                   9%                              7%
                  (6.1)         -11.7%
                                                  (5.4)
                                                                                       26%                 24%
                  21%                              17%                                            9.0%    (18.7)
                                -4.5%%                                                (17.2)
                 (13.8)                           (13.2)

                Q1 2020                          Q1 2021                             Q1 2020             Q1 2021

               Net Revenue and Volumes Q1 2021
          Product                NR Growth             Volume Growth

        Air Freight                      44.5%               14.8%

        Ocean Freight                    21.3%                0.7%
                                                                                                                             31
Infrastructure Group Financial Performance
KD Mn
                          +0.3
                        (+0.3%)
                                                                         Revenue QTD
              106.0                   106.3
  Revenue

                                                                                -10.2%

                                                                                              -0.3%

            Q1 2020                 Q1 2021

                        -8.4                   -0.2
                      (-44%)                  (-1%)                          -38.7%
             19.0                                           18.8

                                                                                      -7.0%
                                   10.6
 EBIT

                                                                                                      8.3%

            Q1 2020               Q1 2021             Q1 2021 adjusted
                                                                                                             32
Sustainability

                 33
The three pillars of our approach to greener supply chains
Ecovadis rated Agility in the top 4% of logistics industry companies for environmental sustainability

        ADDRESSING SUPPLY CHAIN                          ADDRESSING DIRECT
                                                                                                     INVESTING IN INNOVATION
              EMISSIONS                                     EMISSIONS

Tracking emissions for   600,000 customer     90% of country operations report electricity   $18 million invested in green supply
shipments                                     and fuel usage                                 chain tech over 3 years through corporate
                                                                                             ventures team

Supply Chain Optimization                     ISO 14001 certifications in sites covering     Industry engagement
using network rationalization, air freight
densification, and other techniques lead to   50% of all headcount                           Clean Cargo Working Group (CCWG), Sustainable
                                                                                             Air Freight Alliance (SAFA), the World Economic
considerable cost and emissions savings                                                      Forum’s Getting to Zero Coalition, and more

                                                                                                                                    *
                                                                                                                                               34
                                                                                                                                    2018
Community partnerships for impact at scale
We have invested in 1,700+ community partnerships in 80+ countries, reaching more than 1.6 million people in need since 2006

    Ghana                                              Malaysia                                               India

         Vocational training program                                                                          Supported 1,000 students with school
                                                     UNHCR community center for 12,000 refugees
            graduates 325 youth                                                                                     refurbishment projects

   Kuwait                                                Brazil                                           Bangladesh

   Mentored 1,700+ high school students in               Set up a computer lab for 600 students
                                                                                                              Tutored 2,200 students at two schools
          business fundamentals                       through the ‘Google for Education’ initiative

                                                                                                                                                      35
Q&A Session

              36
You can also read