Half Year Results FY16 - City Chic Collective
←
→
Page content transcription
If your browser does not render page correctly, please read the page content below
H a l f Ye a r R e s u l t s F Y 1 6

                                       0
IMPORTANT NOTICE AND DISCLAIMER

This presentation has been prepared by Specialty Fashion Group Limited (the “Company”). It contains general background information about the
Company’s activities current as at the date of the presentation. It is information given in summary form and does not purport to be complete. The
distribution of this presentation in jurisdictions outside Australia may be restricted by law and you should observe any such restrictions.

The Company has prepared this presentation based on information available to it, including information derived from publicly available sources that
have not been independently verified. No representation or warranty, express or implied, is made as to the fairness, accuracy, completeness,
correctness or reliability of the information, opinions and conclusions expressed.

Any statements or assumptions in this presentation as to future matters may prove to be incorrect and differences may be material. This presentation
should not be relied upon as a recommendation or forecast by the Company. To the maximum extent permitted by law, none of the Company, its
directors, employees or agents, nor any other person accepts any liability, including, without limitation, any liability arising from fault or negligence on
the part of any of them or any other person, for any loss arising from the use of this presentation or its contents or otherwise arising in connection
with it.

S P E C I A L T Y       F A S H I O N       G R O U P
                                                                                                                                                        1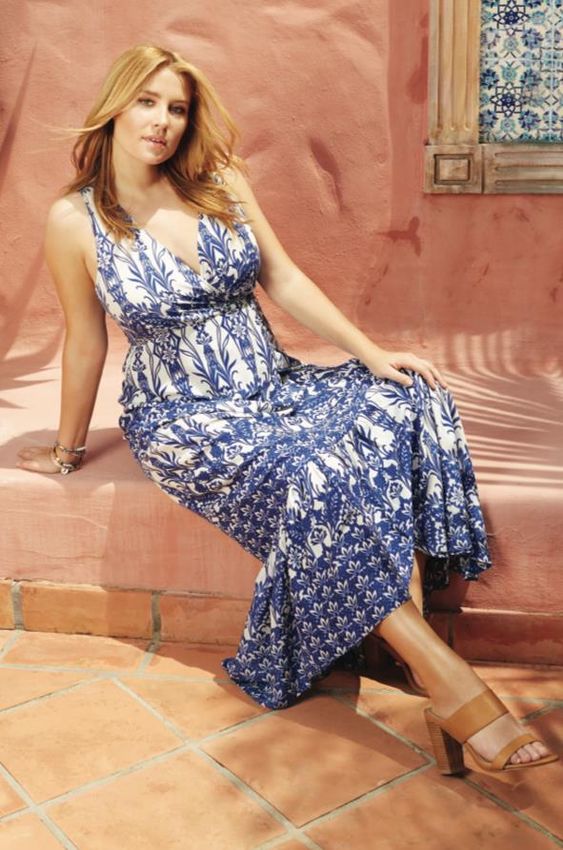
1   Business
             Overview

         2   Key Growth
             Priorities

AGENDA
         3   Financial
             Analysis

         4   Outlook

         5   Appendices

                          2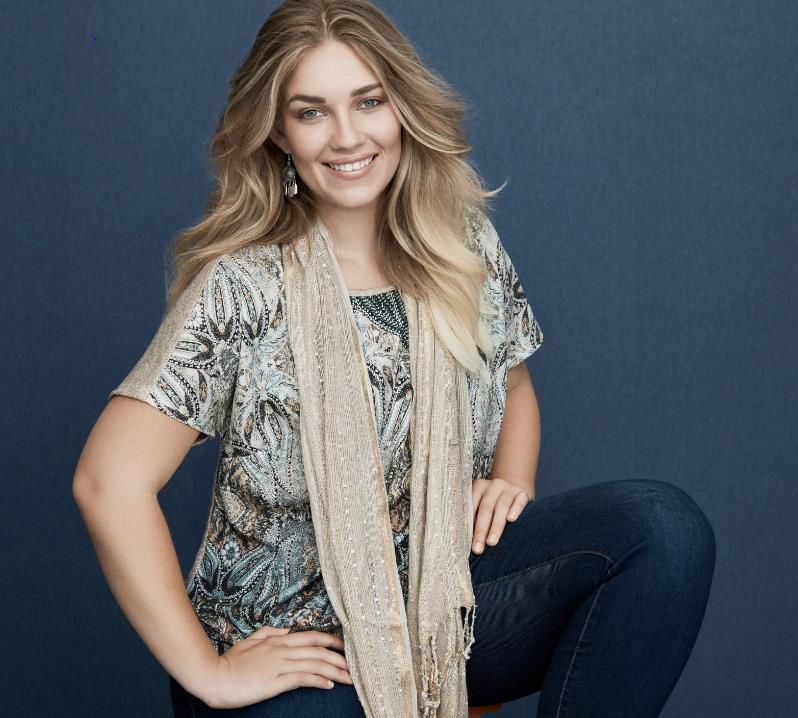
1
BUSINESS OVERVIEW

                    3
BUSINESS OVERVIEW | HIGHLIGHTS
                                                                        •   Solid performance across key metrics:
                                            Income statement
                                       H1FY16       H1FY15      FY15                 • Fourth consecutive reporting period of
                                                                                       Comparable Stores Growth (“CSG”) Sales of
 Revenue (A$m)                          434.3        413.0     791.5                   more than 5%. Actual CSG Sales 5.7%.
 Revenue growth                          5.2%        27.4%     15.5%
                                                                                     • Achieved revenue growth of 5.2% despite
 Gross profit (A$m)                     248.4        248.5     463.6
                                                                                       reduction in average number of stores for the
 Gross margin %                         57.2%        60.2%     58.6%                   period from 1,100 for H1FY15 to 1,088 H1FY16.
 Underlying EBITDA (A$m)                 27.0         22.6      20.3
                                                                                     • Gross margin lower predominantly due to
 Underlying EBITDA margin %              6.2%         5.5%      2.6%                   strengthening USD on cost of purchases, offset
 NPAT (A$m)                               8.8          5.9      (4.5)
                                                                                       against gains on negotiated product pricing and
                                                                                       duty.
 NPAT margin %                           2.0%         1.4%     (0.6%)
 Basic EPS (cents/share)                  4.6          3.0      (2.3)                • The Group’s costs of doing business (“CODB”), as
                                                                                       a percentage of sales has improved and is lower
 Costs of Doing Business                                                               than PCP at 51.3% for the half.
 CODB                                   222.9        225.9     443.3
                                                                                     • NPAT has increased by 49.2%.
 CODB %                                 51.3%        54.7%     56.0%
                                                                                     • EPS has increased by 53.3%.

                                                                                     • Underlying EBITDA has increased by 19.5%.

                                                                        •   Rivers’ transformation on-track with underlying EBITDA losses
                                                                            for H1FY16 being half of PCP.

                                                                        •   City Chic delivers significant growth internationally.

                                                                        •   Online sales up 58.9% to $39.1m.

S P E C I A L T Y      F A S H I O N    G R O U P                                                                                    4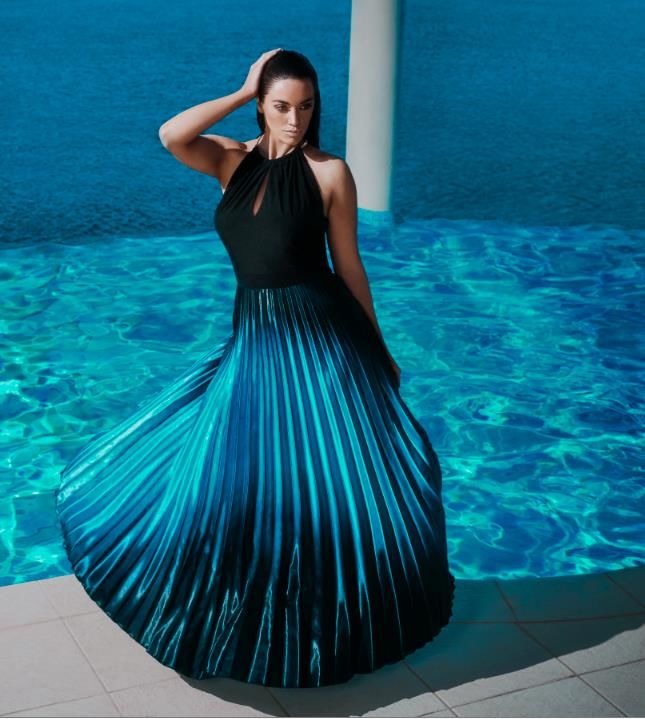
BUSINESS OVERVIEW | HIGHLIGHTS

                                                                              •   Reduced inventory relates predominantly to the successful
                                   Balance sheet and Cashflow items, Other        clearance of Rivers’ inventories inherited on acquisition.
                                                 information
                                        Dec 15        Jun 15         Dec 14
                                                                              •   CAPEX lower than prior year primarily due to the timing and
                                                                                  availability of store refurbishments and new store roll-outs.
 Inventory (A$m)                          84.6          89.1           88.7
                                                                              •   Foreign Currency: Fully covered at US$0.78 until 30 June
 PP&E (A$m)                               74.5          79.3           83.1
                                                                                  2016 with additional cover at US$0.71 until 31 December
                                                                                  2016.
 Net cash / (debt) (A$m)                   1.4          (27.8)          5.0
                                                                              •   Net movement in working capital compared to H1FY15
 Net working capital (A$m)                14.7           (3.8)         15.4       reflects the impact of reduced levels of inventories,
 Net assets (A$m)                         74.4          65.5           79.3       increased trade and other payables, and increased levels of
                                                                                  receivables for the half year.
                                                                              •   The $1.0m decrease in net working capital to PCP reflects
 Capital expenditures, net (A$m)           7.4          12.6           10.6       lower levels of trade and other payables at the end of the
 Net operating cash flow (A$m)            36.8          10.0           30.4       half. Extended trading terms have been renegotiated with
                                                                                  direct suppliers where ongoing repeat orders have been
 Free cash flow (A$m)                     29.4            7.2          19.9
                                                                                  established.

                                                                              •   Leadership management team enhanced with the newly
 # of stores at period end               1,089         1,105         1,086        created role of Group General Manager – Brands.
                                                                                  Tony Brown, a senior retail executive with significant
                                                                                  experience in high volume fashion in the UK, has been
                                                                                  appointed to this role.

                                                                              •   Michael Hardwick and Anne McDonald appointed interim co
                                                                                  chair.

S P E C I A L T Y       F A S H I O N    G R O U P                                                                                         5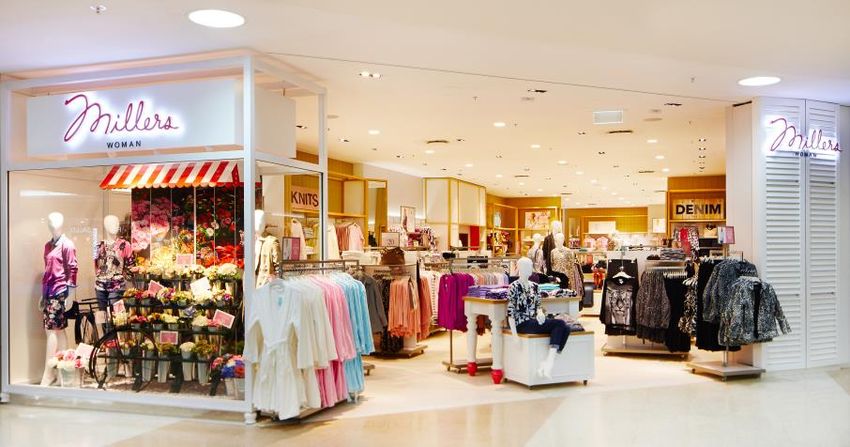
BUSINESS OVERVIEW | OMNI-CHANNEL STRATEGY
•       We have been successful in our Omni-channel strategy utilising our extensive customer data base in
        providing our customers with a seamless shopping experience in both our stores and online. Click and
        collect is well entrenched in our brands and has been embraced by our team members and customers.
•       We have opened 17 new stores and closed 14 loss making stores, resulting in a total of 1,089 stores at the
        end of December 2015. The Group plans to open 7 new stores and refurbish a further 27 existing stores
        during the second half of FY2016.
•       We achieved 58.9% growth in online sales to $39.1m for the half (PCP $24.6m), which represents 9.0% of
        total revenues.
•       The strong growth in our membership database and our insights driven digital strategy has contributed to
        this favourable result.
•       Our dedicated in-house customer insights team and CRM platform continues to drive positive results:
         •      Total customer membership database has over 8.0 million members.
         •      Email customer membership has grown by 27% to 4.8 million, representing 60% of our total
                membership base that can be communicated directly via email.

                                                                                  Online sales
                                                                Brands              growth
                                                                                H1FY16 vs H1FY15
                                                                Millers              110%
                                                                Katies                32%
                                                                Crossroads            42%
                                                                Autograph             33%
                                                                City Chic             70%
                                                                Rivers                55%
                                                                Group                 59%

    S P E C I A L T Y    F A S H I O N       G R O U P
                                                                                                                     6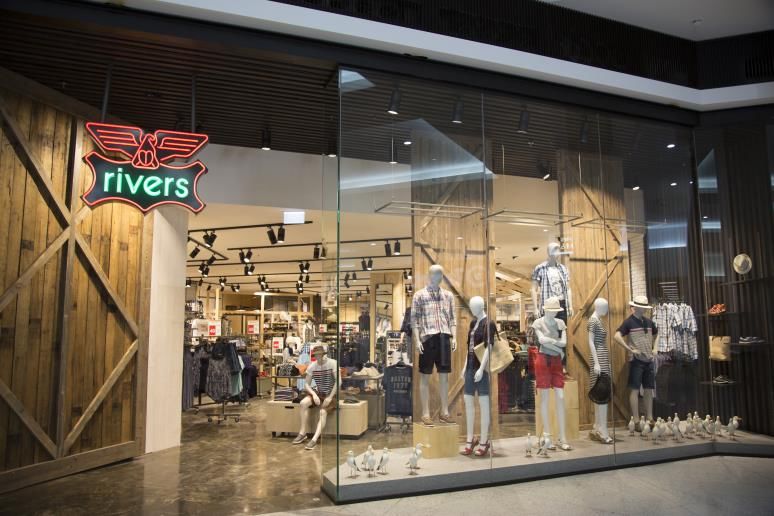
BUSINESS OVERVIEW | KEY BRANDS AND OPERATIONS
                         Millers                 Katies                 Autograph              Crossroads                City Chic                 Rivers

                        PHOTO                   PHOTO                    PHOTO                   PHOTO                   PHOTO                   PHOTO

                   Comfortable, stylish,                            Modern attainable         Fast, affordable      Bold, sexy and glam       Quality & comfort
                                           Value based fashion
Target Market        versatile outfit                              fashion for plus-size    fashion in sizes 8 to      fashion for the      clothing and footwear
                                           for the ageless and
                     building for the                              women in sizes 14 to      22, for the fashion-    younger plus-size      for mature Australian
                                            feminine woman.
                     mature woman.                                          26.              conscious woman.              woman.            males and females.
Indicative Price
                         $10-$60                $20-$120                 $15-$100                $15-$100                $50-$250                $15-$120
     Point

   Product                                                                                                                                        Adult
                                                                     Female Apparel
   Range                                                                                                                                    Apparel & Footwear

  # of Stores              355                     149                      141                     182                     109                     153

                    C3.0m Registered        c1.7m Registered          c830k Registered       c1.6m Registered                                c1.7m Registered
   Loyalty                                                                                                           c550k Registered
                        members.                members.                  members.               members.                                        members.
  Program                                                                                                               members.
                   Marketing highlight –   Marketing highlight –    Marketing highlight –   Marketing highlight –                           Marketing highlight –
  Marketing                                                                                                         Marketing highlight –
                    launch of “Seeing       launch of summer        Vivien's Brand model     launch of summer                                   segmented
  Highlight                                                                                                           Macy’s launch.
                           Me”.                 catalogue.         search – 4,000 entries        catalogue.                                  catalogues offers.

                         3%
                                                   6%                             14%              5%                             23%            5%
H1FY16 Net
Sales: Online
as % of Total

  S P E C I A L T Y       F A S H I O N      G R O U P                                                                                                      7
2
KEY GROWTH PRIORITIES
GARY PERLSTEIN
CEO

                        8
KEY GROWTH PRIORITIES

  •      The Group continues to deliver on its key growth priorities,
         which have delivered a solid result in ever changing
         trading conditions.

  •      Our ongoing opportunity is to accelerate our growth
         strategy as we navigate and reposition the business to
         trade in a Global Omni-channel environment.

  •      Our key growth priorities are:

          •      Rejuvenation of existing brands across the Group;

          •      Transformation of Rivers into the new age of
                 Omni-channel retailing; and

          •      Expansion into new markets beyond Australia for
                 City Chic.

S P E C I A L T Y    F A S H I O N        G R O U P
                                                                        9
KEY GROWTH PRIORITIES | BRAND REJUVENATION
Millers Case Study
• The Brand has in-depth knowledge and understanding of its
loyal customer base.
• The portfolio of newly refurbished stores are trading above the
average performance of the brand overall.
• Significant uplift in online sales on PCP (110%).
• Five existing sites rebranded into the new Millers design
concept during the half, with a further eight additional sites
planned in the second half of FY2016.
• Successful launch of the Millers “Seeing Me” project, the
brand’s long-term commitment to celebrate the mature woman,
receiving significant customer engagement.
(http://seeingmeproject.com/)
• In society, culture, fashion and advertising the mature
woman is under-represented, some might say invisible,
and we’d like to change this.
• Our mission is to encourage the world to see women
the way we do.
• The seeingmeproject.com is an evolving, living hub,
where our participants will find films and inspirational
interviews with like minded women, being informed with
up to the minute research conducted by the Group’s ’
in-house research team into hot topics for women aged
40+.
S P E C I A L T Y F A S H I O N G R O U P
10KEY GROWTH PRIORITIES | RIVERS’ TRANSFORMATION
Rivers’ Transformation
• Inventory inherited on acquisition has been cleared.
• Strong customer response to new ranges.
• Material progress reducing Rivers’ CODB.
• Substantial progress growing customer membership database by
120% to 1.7m.
• 55% uplift in online sales with a strong trend of repeat purchases
by registered rewards customers continues.
• Final phase of integration of Rivers’ supply chain into the Group
with planned closure of Rivers’ Ballarat warehouse in February
2016.
• Rivers is expected to start trading profitably during FY2017.
S P E C I A L T Y F A S H I O N G R O U P
11KEY GROWTH PRIORITIES | CITY CHIC INTERNATIONAL EXPANSION
City Chic International Expansion
• Execution of a wholesale distribution agreement into 90 Macy’s
stores.
• Successful product trials in Evans, part of The Arcadia Group in the
UK.
• Subsequent orders have been received from this UK retailer.
• Three new licensed stores opened in Dubai during the period, under
a licensing arrangement for the UAE region.
• Nordstrom – significant uplift in sales both through wholesale and
online, exceeding expectations.
UK
USA
UAE
RSA Australia & NZ
City Chic International Representation
S P E C I A L T Y F A S H I O N G R O U P
12CORPORATE SOCIAL RESPONSIBILITY
Ethical Trade Occupational Health & Safety (OH&S)
• The Group strives to source product in a responsible manner • The Group is committed through its OH&S Strategy to
by operating a transparent supply chain while delivering ensure that SFG is a safe and healthy environment for both
quality, on time product and a vendor base aligned to support customers and team members alike.
our product procurement.
Key Focus For FY2016 – OneEightyProject
Key Milestones
• SFG’s new Health & Wellbeing initiative the
• We have established a Social Audit program for all our offshore OneEightyProject launched on 1 July 2015.
factories.
• Innovative biometric assessments were used to form the
• We conduct Social Audits on our Vendors - Focus on Wash basis of our project including several video training
houses / Laundries. sessions written by a physiotherapist in order to address
our biggest risk of sprain injuries/ manual handling.
• We have testing programs for dangerous or banned chemicals
in the manufacturing of product. • 250k warm ups and 478 health assessments completed to
date, while receiving over 224 pieces of positive
• SFG has been a member of the Bangladesh accord since feedback.
2013:
• FY2015 focus - remediation of factory fire and building • OneEightyProject Results:
safety conditions.
• Following 6 months of the OneEightyProject SFG
• FY2016 focus - educating the factory workers on their
has achieved an average injury reduction of 31%
rights.
(against 2 year average); including an amazing
• Our ongoing focus - communicate, train and help the
77% injury reduction for Katies.
workers develop safety committees in line with
international labour standards. • Results continued into January with SFG achieving
• We have fully integrated Rivers into the SFG vendor base its lowest number of Lost Time Injuries and
(apparel), production and QC process. following significant decreases in injuries Workers
Compensation claims are also at an all-time low.
S P E C I A L T Y F A S H I O N G R O U P
133
F I N A N C I A L A N A LY S I S
GARY SPRECKLEY
CFO
14GROUP TRADING | HALF YEAR ENDED 31 DECEMBER 2015
H1FY16 H1FY15 Change
$'000 $'000 %
Revenue 434,303 413,020 5.2%
Gross Profit 248,399 248,513 (0.0%)
57.2% 60.2%
Underlying EBITDA 26,955 22,617 19.2%
EBIT 15,162 11,274 34.5%
Profit before tax 13,580 9,185 47.8%
Net profit after tax 8,818 5,855 50.6%
Basic earnings per share (cents) 4.6 3.0 53.3%
• Revenue growth driven by positive 5.7% CSG Sales supported by strong
online sales growth both locally and internationally.
• Ongoing benefits continue to be derived from continued shift to directly
sourced product.
• Gross margin decline mainly due to impact of strengthening USD on cost of
product, offset by gains on negotiated product pricing and duty.
• The Group’s costs of doing business, as a percentage of sales lower than PCP
at 51.3% for the half.
S P E C I A L T Y F A S H I O N G R O U P
15GROUP CASHFLOW | HALF YEAR ENDED 31 DECEMBER 2015
WORKING CAPITAL
• Net movement in working capital reflects the impact of reduced levels of
inventories, increased trade and other payables, and increased levels of
receivables for the half year.
• The $1.0m decrease to PCP reflects lower levels of trade and other
payables at the end of the half.
• While the continued shift in direct supplier mix with shorter payment terms
has impacted ongoing working capital funding requirements, management
has been proactive in negotiating extended trading terms with direct
suppliers where ongoing repeat orders have been established.
H1FY16 H1FY15 CAPEX
$'000 $'000
• Total net capex spend of $7.4m (PCP $10.6m) primarily for stores offset
Underlying EBITDA 26,955 22,617 by proceeds on disposals.
Restructuring costs (1,527) -
NET CASH/DEBT
Net working capital 14,419 15,414
Net interest (1,582) (2,034) • Net cash position of $1.4m, comprising cash of $13.3m less borrowings of
$11.9m. (Net cash position PCP $5.0m).
Net taxes (1,458) (5,551)
Operating cash flow 36,807 30,446 • $73.7m bank loan facilities with $44.5m unused at 31 December 2015.
Net capex (7,430) (10,555) • Bank loan facilities in compliance with bank covenants.
Free cash flow 29,377 19,891 DIVIDENDS
Borrowings (23,216) (17,454)
• Board has determined not to declare an interim dividend.
Dividends - (3,845)
Net cash flow 6,161 (1,408)
S P E C I A L T Y F A S H I O N G R O U P
164
OUTLOOK
GARY PERLSTEIN
CEO
17OUTLOOK | GROWTH IN THE FUTURE
• The Group has continued to record positive CSG Sales since the start
of the second half of FY2016 to date, and the focus for the remainder of
the year is to continue:
• Our brand rejuvenation program;
• Rivers’ transformation into a profitable and growing brand for
the Group; and
• The focused expansion of City Chic, both in Australia and
abroad.
• Our ongoing opportunity is to accelerate momentum across our
business as we navigate and reposition the business to trade in a
Global Omni-channel environment.
• We strongly believe the key to success will be to compete for increased
sales through product differentiation and customer engagement of our
brands rather than competing on price.
• The Group will continue to focus on potential growth opportunities for all
of our brands through measured entry into certain retail markets beyond
Australia.
• Rivers is expected to start trading profitably during FY2017.
S P E C I A L T Y F A S H I O N G R O U P
185
APPENDICES
19EBITDA | RECONCILIATION
H1FY16 H1FY15
$'000 $'000
Profit before tax 13,580 9,185
Interest expense 1,627 2,089
Interest revenue (45) (55)
EBIT 15,162 11,219
Restructuring costs 1,527 -
Depreciation and impairment 10,271 11,304
Revaluation of options (5) 94
Underlying EBITDA 26,955 22,617
S P E C I A L T Y F A S H I O N G R O U P
20STORE MOVEMENTS | HALF YEAR ENDED 31 DECEMBER 2015
Store movements Store Location
Stores Stores Stores Stores Stores Stores
1 Jul 15 New Closed 31 Dec 15 AU NZ USA RSA
Millers 355 2 (2) 355 327 28 - -
Katies 150 1 (2) 149 149 - - -
Crossroads 180 3 (1) 182 173 9 - -
Autograph 142 1 (2) 141 133 8 - -
City Chic 108 3 (2) 109 88 12 7 2
Rivers 151 7 (5) 153 153 - - -
Total 1,086 17 (14) 1,089 1,023 57 7 2
S P E C I A L T Y F A S H I O N G R O U P
21STORE & OTHER CAPEX | HALF YEAR ENDED 31 DECEMBER 2015
H1FY16 H1FY15
$'000 $'000
New stores 1,732 8,674
Refurbishments & relocations 3,199 426
IT capex 1,791 904
Head office capex 437 378
Other capex 271 173
Total net capex 7,430 10,555
Refurbs &
New stores relocations Total H1FY16
$'000 $'000 $'000
Millers 62 1,890 1,952
Katies 154 187 341
Crossroads 221 322 543
Autograph - 558 558
City Chic 286 32 318
Rivers 887 209 1,096
Other 122 - 122
1,732 3,199 4,930
S P E C I A L T Y F A S H I O N G R O U P
2223
You can also read