"Subscribe" to Angel Broking
←
→
Page content transcription
If your browser does not render page correctly, please read the page content below

“Subscribe” to
             Angel Broking
Leveraging digital platforms to enhance clients base
21th Sep. 2020

Salient features of the IPO:
                                                                             Recommendation                         Subscribe
•   Angel Broking Limited (ABL) is one of the largest retail broking
                                                                             Price Band                       Rs305 -306 per share
    houses in India in terms of active clients. Key business segments
    include broking & advisory services, margin funding, loan against        Face Value                          Rs 10 per share
    shares and financial product distributions.
•   ABL entered into the broking industry over 22 years ago and has over     Fresh Issue Size                      Rs3,000 mn
    the years built an online and digital broking and financial services     Share for Fresh Issue
    platform with a pan India presence.                                                                           9.8 mn shares
                                                                             (Higher Price Band)
Key competitive strengths:                                                   OFS Issue Size                        Rs3,000 mn
• One of the largest broking houses with strong brand equity
• Client acquisition through diversified digital platform                    Total Issue Size                      Rs6,000 mn
• Integrated, end to end, and advances digital experience ensuring
                                                                             Bidding Date                  Sep 22' 2020 - Sep 24' 2020
   client satisfaction
• Diversified product offering across segments at competitive price          MCAP at Higher Price
                                                                                                                 Rs25,030.5 mn
• Robust business metrics building operating leverage                        Band
• Experiences management team with proven executive capabilities
                                                                                                         ICICI Securities Ltd., Edelweiss
                                                                             Book Running Lead
Valuation: At the CMP of Rs306, demanding valuation at Rs25,030 mn is                                      Financial Services Ltd., SBI
valued at P/E of 28.9x (post issue adjusted FY20 EPS of Rs10.6) and P/BV     Manager
                                                                                                             Capital Market Limited
of 2.7x (post issue adjusted BVPS of Rs115).
                                                                                                             Link Intime India Private
Below are few key observations of the issue: (continued in next page)        Registrar
                                                                                                                      Limited

•   ABL is the fourth largest brokerage house in India in terms of active    Industry                           Financial Services
    clients. ABL has over 9 lakh NSE active clients as of Aug 31’ 2020
    which places it fourth behind only to Zerodha, ICICI Securities and
    RKSV Securities. The company generates major business (around 70%         Retail application money at higher cut-off price per lot
    of total revenue) from brokerage segment (as retail brokerages           Number of shares per lot                    49
    income). Brokerage services to retail clients primarily compromises
    trading in equities, equity derivatives, commodities and currency        Application Money                   Rs14,994 per lot
    derivatives.

•   As per the mgmt, ABL is well placed to capitalized on the expected       Allocation Detail
    growth in the broking sector in India with increasing participation of
    retail clients in the equity market. Even in the economic lockdown       Qualified Institutional
                                                                                                                       50%
    phase, brokerages companies in the country have witnessed a              Buyers (QIB)
    substantial growth in opening of trading & demat a/c. Since April,
    more than 5 million new demat accounts have been opened with             Non-Institutional
    depository firms CDSL and NSDL.                                                                                    15%
                                                                             Investors (NII)

•   ABL strategized to focus more on leveraging digital platforms to Retail Individual Investors
    strengthen leadership position to become the largest retail broking (RIIs)                                         35%
    firm in India, both by broking revenue and active clients. ABL
    witnessed an increase of 18.7% from 1.8 million clients in FY20 to Shareholding Pattern
    2.15 million clients as of Q1FY21.
                                                                                                               Pre-Issue        Post Issue
•   Being one of early mover in the brokerage industry and over two          Promoter & promoter
                                                                                                                 55.2%              44.8%
    decades of experience, ABL assessed the technological development        group
    trend in the earlier stage and hence made advanced progress in           Public                             43.8%            56.2%
    digital platforms. With app like Angel Broking Mobile Aap, Angel BEE     Total                              100.0%           100.0%
    Aap, SpeedPro and NXT, the company has planned to leverage the
    growth opportunity in India’s under penetrated brokerage industry.                                  Source: Choice Broking Research, RHP
    In Q1FY21, 85% of ABL’s total clients have been acquired digitally of
    which 53% are acquired through performance marketing, 21%
    through referrals and 11.2% through digital referral associates (DRA).   Analyst
                                                                             Satish Kumar
•   The company in RHP has outlined its primary strategy is to profitably
    grow retail broking, margin funding and distribution businesses                                          (022-67079999; Ext:913,
    through online and digital platforms.                                 Deskphone
                                                                                                                Mob:9167120440
                                                                             Email                        satish.kumar@choiceindia.com

                                                                                                                                1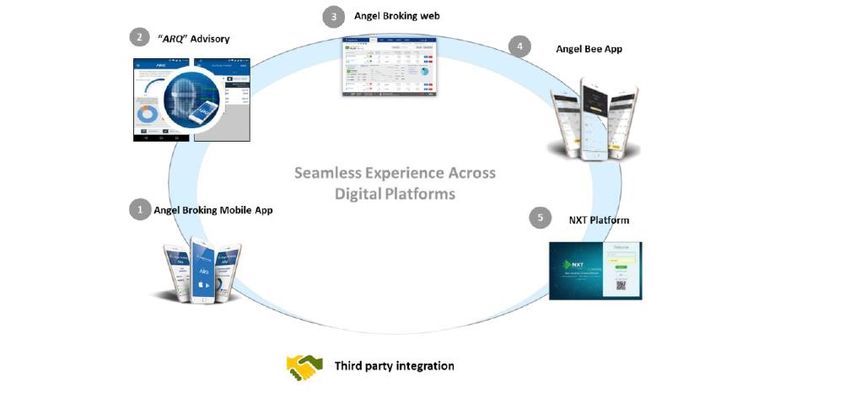
•     While, the company posted significant progress in client acquisition from 1.06 mn in FY18 to 2.15 mn by Q1FY21, operating
      revenue contracted by a CAGR of -2.6% during FY18-FY20. The mgmt attributed this to decline in brokerage rate.

•     ABL has introduced competitive pricing plan in 2019 namely Angel itrade which compromises plan of Rs0 for equity
      delivery and Rs20 for all other segments. We think the move was being taken to tackle the competitions imposed by
      discount brokers. Now mgmt planned to grow revenue only be adding new customers, while brokerage prices to keep low
      to remain competitive amidst increasing competition in the industry.

•     ABL is planned to raise of Rs3,000 mn as fresh issue to meet working capital management (Rs2,300 mn) and general
      corporate purposes. However, balance sheet shows strong cash position of the company, creating some uncertainty for
      equity dilution through fresh issue. ABL’s cash and bank balance as of Jun 30’ 2020 stood at Rs19,611 mn and has the
      negative net debt position.

•     After adjusting net worth with fresh proceed of Rs3,000 mn, RoE reduced to single digit of 9.2% from 14.7% (calculated on
      FY20 PAT). While BVPS increased to Rs114.8.

•     ABL has augment its digital base to record strong customers acquisition in under penetrated broking industry which is
      witnessing substantial growth in retail client segments. Average daily turnover in Indian equity market increased to
      Rs14,350 bn in FY20 from Rs7,045 bn in FY18 driven by equity derivative segment (97% of ADTO). While, ABL’s net client
      addition run rate was 113,191 in Q1FY21 compared to 43,582 in FY20.

•     We believe ABL to keep posting strong customers acquisition numbers going forward, however its strategy to keep
      brokerage low to compete with discount brokerages could keep profitability under pressure. At the CMP of Rs306,
      demanded valuation at Rs25,030 mn is valued at P/E of 28.9x (post issue adjusted FY20 EPS of Rs10.6). Other brokerage
      companies’ valuation include ICICI Sec (P/E: 28.3x) and Aditiya Birla Money P/E: 22.4x). ABL’s strategy to focus on
      leveraging digital platforms for client acquisition has started yielding benefits. Alternatively, the company is also
      competing with discount brokers through reducing brokerage charges and additionally providing other value-added
      services like research advisory. 5paisa Capital, a discount broker launched by IIFL in 2015, is trading at valuation of P/BV
      of 6.7x as compared to ABL’s P/BV of 2.7x.

•     Thus, considering all parameters, we assign ‘Subscribe’ rating to the issue.

                                                                                       P/E              P/BV      PAT Revenue                 Net
                Companies                   M. Cap          CMP           EPS                  BVPS                           RoE (%) RoA(%)
                                                                                       (x)               (x)     (TTM)  TTM                  worth
                    Rs mn
    Angel Broking                          25,030.5          306         10.6          28.9    114.8    2.7      867.9    7,246.2     9.2%   4.0%    9,390.8
    Geojit Financial Services              9,770.3            41         2.8           13.3    21.2     1.8      677.4    3,208.1    13.4%   11.6%   5,040.8
    5Paisa Capital Ltd.                    9,682.4           380         -1.8         -204.0   54.3     6.7      -45.7    1,277.1    -3.3%   -3.2%   1,382.4
    Aditya Birla Money                     2,364.6            42         1.9           22.4     5.6     14.2     120.0     852.1     38.4%    2.2%    312.7
    ICICI Securities                      1,54,305.1         479         19.3          28.3    32.5     14.6    6,213.1   18,645.1   51.4%   21.1%   12,095.4
    IIFL Securities                        12,576.3           39         4.7            8.3    25.5     1.5     1,501.0   6,894.8    17.1%   1.6%    8,797.9

                                * Angel broking PAT and revenue were taken for FY20               Source: Choice Broking Research, RHP

                                                                                                                          © CHOICE INSTITUTIONAL RESEARCH
About the issue:
• Angel Broking is coming with initial public offer (IPO) of Rs6,000 mn. The issue compromises Rs3,000 mn as fresh issue
and Rs3,000 mn as offer for sale (OFS).
• Price band for the issue is Rs305-Rs306 per share
• The issue will open on Sep 22’ 2020 and closes on Sep 24’ 2020
• At the higher price band, number of fresh issue shares is 9.8 mn. Post issue, total number of share increased to 81.8 mn
which translate to a market cap of Rs25,030.5 at the higher price band.
• Promoters namely Ashok D Thakkar is selling 3.2 mn shares (Rs183.35 mn) and Sunita A Magnani is selling 0.75 mn
shares (Rs45 mn). Post issue, promoter stake will reduce to 43.8% from 55.2% in pre issue.
• International Finance Corporation (IFC) an institutional investor, is selling equity shares worth of Rs1,200 mn
• Objective of the issue is 1) to meet working capital requirements and 2) general corporate purpose.
• Not more than 50% of the net offer shall be available for allocation on a proportional basis to a qualified institutional
investors (QIIs). Further not less than 15% shall be available for allocation on a proportional to non-institutional investors
(NIIs) and not less than 35% of net offer shall be available for allocation to Retail Institutional Investors (RIIs).
• The offer is being made through book building process.
• With 9.8 mn shares as fresh issue, equity will dilute ~14%.
• Average cost of acquisition by selling promoters is Rs0.99, Rs6.48.
Indicative IPO process time line:
Unblocking of
Offer Closes on
ASBA Account
24-Sep-2020
30-Sep-2020
Offer Opens on Finalization of Commencement
22-Sep-2020 Basis of Credit to Demat of Trading
Allotment Accounts 05-Oct-2020
29-Sep-2020 01-Oct-2020Company introduction:
Angel Broking Limited (ABL) is one of the largest retail broking houses in India in terms of active clients. Key business
segments include broking & advisory services, margin funding, loan against shares and financial product distributions.
Broking and allied services are offered through online and digital platform and has a network of over 11,000 authorized
persons as of Jun 30’ 2020. ABL has a well diversified network in the country as customer outreach spans across
approximately 96.9% or 18,649 pin codes in the country. As per RHP, the company primary focus is to profitability grow
retail broking, margin funding and distribution businesses through online and digital platforms. The company has launched
various apps like Angel Broking Mobile App, trade.angelbroking.com, Angel Speed Pro, Angel BEE which are powered by
‘ARQ’ a rule based investment engine. Broking services is provided through various web, digital, and .exe platform, which are
integrated with each other enabling clients to have seamless trading and investment experience, positioning to benefit from
the development of the Indian financial markets, increased emphasis on digitalization and growth in returns from such
financial investments.
Business Performance
ABL reported sales of Rs7,246.2 mn in FY20 and around 70% of the business came as brokerages income. However, over
FY18-FY20, sales contracted by a CAGR of -2.6% despite the significant clients addition. Mgmt attributed this decline to the
reduction in brokerages charges for the clients. EBIDTA and NPM stood at 21.9% and 12.0% in FY20 as compared to 25% and
11% in FY19. Return of Equity (RoE) stood at 14.7% in FY20. In Q1FY21, the company reported sales of Rs2,384 mn and PAT
at Rs482.6 crore with strong improvement in efficiency at EBIDTA margin of 29.2% and NPM of 20.2%.
Source: Choice Broking Research, RHPBusiness Overview:
The company provides broking services across equity, commodity and currency segments along with debt products. ABL also
facilitates opening of demat accounts as a part of broking and advisory services. ABL is a member of BSE, NSE, MSEI, MCX
and NCDEX. To complement broking & advisory services, ABL provides the additional services like 1) research services 2)
investment advisory and 3) investment education. In addition to broking & advisory services, the company also provides
other services like marginal trading facility, distribution and loans against shares.
Marginal trading facility: ABL provides marginal trading facility to clients for leveraging their eligible collateral by funding
their requirements on cash delivery segments of equities. Such funding is subject to exposure against margins that are
mandated by stock exchanges.
Distribution: ABL also distributes third party financial products such as mutual funds and health & life insurance products
through offline channels and digital platforms such as ‘Angel Broking’ and ‘Angel BEF’.
Loan against shares: The company also provides loans against shares to retail clients through subsidiary Angel Fincap Private
Limited.
Source: Choice Broking Research, RHPCompetitive strengths:
• One of the largest broking houses with strong brand equity
• Client acquisition through diversified digital platform
• Integrated, end to end, and advances digital experience ensuring client
satisfaction
• Diversified product offering across segments at competitive price
• Robust business metrics building operating leverage
• Experiences management team with proven executive capabilities
Business strategy:
• Strengthen leadership position to become largest retail broking business
in India
• Augment investment in mobile platform, artificial intelligence, machine
learning capabilities and newer technologies
• Establish a leadership position in investment advisory space to support
business
• Capitalization of the growing investable wealth in India
Risk and concerns:
• Increasing competition in the industry
• Challenges from discount brokers business model
• Changing norms by SEBI
• Volatility in equity markets
© CHOICE INSTITUTIONAL RESEARCHFinancial statements:
Consolidated (Rs mn)
Profit & Loss A/c Cash Flow Statement
Particulars FY18 FY19 FY20 Q1FY21 Particulars FY18 FY19 FY20 Q1FY21
Cash Flow from Operating
Operating Revenue (OR) 7,642.8 7,579.8 7,246.2 2,384.2 (2,970.0) 7,087.6 6,433.0 (2,900.2)
Activities
Fee and commission expense (2,464.0) (2,419.6) (2,304.4) (764.9) Cash Flow from Investing
#REF! (1,219.7) (1,591.7) (1,598.0) (373.1) 414.3 (193.6) (281.3) 277.1
Activities
Impairment of financial Purchase of fixed assets and
(97.1) (151.5) (377.1) (189.8) (66.3) (116.4) (126.2) (55.8)
instruments properties
Employee Benefit Expenses (190.5) (189.1) (209.2) (49.7) Cash Flow from Financing
2,324.7 (3,654.7) (4,488.9) 1,647.1
Activities
Other Expenses (1,282.5) (1,522.9) (1,382.2) (360.4)
Net Cash Flow (231.0) 3,239.3 1,662.8 (976.1)
EBITDA 2,579.4 1,894.1 1,584.5 696.0 Opening Balance of Cash and
1,461.3 1,230.3 4,469.6 6,132.4
Depreciation and Amortization Bank Balances
(190.5) (189.1) (209.2) (49.7)
Expenses Closing Balance of Cash and
1,230.3 4,469.6 6,132.4 5,156.3
EBIT 2,388.9 1,705.0 1,375.4 646.4 Bank Balances
Finance Costs (945.7) (684.5) (488.6) (81.8)
Financial Ratios
Other Income 157.1 261.4 300.9 81.7 Particulars FY18 FY19 FY20 Q1FY21
Exceptional Items 0.0 0.0 0.0 0.0 Revenue Growth Rate (%) -0.8% -4.4%
PBT 1,600.3 1,281.9 1,187.7 646.3 EBITDA Growth Rate (%) -26.6% -16.3%
Tax Expenses (502.5) (447.9) (319.8) (163.7) EBITDA Margin (%) 33.7% 25.0% 21.9% 29.2%
PAT 1,097.9 834.0 867.9 482.6 EBIT Growth Rate (%) -28.6% -19.3%
EBIT Margin (%) 31.3% 22.5% 19.0% 27.1%
Balance Sheet Adjusted PAT Growth Rate (%) -24.0% 4.1%
Reported PAT Margin (%) 14.4% 11.0% 12.0% 20.2%
Particulars FY18 FY19 FY20 Q1FY21
Fixed Asset Turnover Ratio (x) 6.6 6.7 6.5 2.2
Share Capital 720.0 720.0 720.0 720.0 Total Asset Turnover Ratio (x) 0.3 0.3 0.3 0.1
Reserves and Surplus 4,015.8 4,594.4 5,194.2 5,670.9 Working Capital Turnover Ratio
1.4 1.3 1.1
Long Term Provisions 44.0 52.3 67.1 79.3 (x)
Trades Payables 6,146.6 6,377.6 9,394.9 15,036.8 Current Ratio (x) 1.3 1.4 1.4 1.3
Debt to Equity (x) 1.3 1.2 1.6 2.4
Short Term Borrowings 11,374.3 8,718.2 4,908.8 6,580.1
Total Debt (Rs.) 11,374.3 8,718.2 4,908.8 6,580.1
Tax liabilities (Net) 2.1 2.7 0.5 58.9 Net Debt (Rs.) 1,927.2 -1,141.5 -9,226.8 -13,030.9
Other short term liabilities 1,242.4 1,358.2 1,304.7 1,341.5 Net Debt to EBITDA (x) 0.7 -0.6 -5.8 -18.7
Other long term liabilities 241.5 261.9 311.7 469.4 Net Debt to Equity (x) 0.4 -0.2 -1.6 -2.0
Total Liabilities 23,786.7 22,085.3 21,901.7 29,956.8
Property, plant and equipment 1,065.1 1,062.9 1,038.8 1,024.5 RoE (%) 23.2% 15.7% 14.7% 7.6%
RoA (%) 4.6% 3.8% 4.0% 1.6%
Intangible Assets 91.6 72.8 68.3 66.9 RoCE (%) 50.0% 31.8% 23.0% 10.0%
Tax assets (net) 76.4 127.4 98.1 61.8 RoIC (%) 27% 17% 14% 6%
Short term investments 65.0 149.1 352.7 23.6 EV 26,957.7 23,888.9 15,803.7 11,999.6
Inventories 0.6 0.5 0.5 0.0 EV/Sales (x) 3.5 3.2 2.2 5.0
Trade Receivables 1,568.2 2,146.4 390.3 562.8 EV/EBIDTA (x) 10.5 12.6 10.0 17.2
EV/EBIT (x) 11.3 14.0 11.5 18.6
Cash and Bank Balances 9,447.1 9,859.7 14,135.6 19,610.9
Valuation ratios
Short Term Loans and Advances 10,924.4 7,616.9 2,805.8 8,144.1 Restated Adjusted EPS (Rs.) 13.4 10.2 10.6 7.9
Other Assets 548.4 1,049.6 3,011.9 462.1 Restated BVPS (Rs.) 57.9 65.0 72.3 114.8
Total Assets 23,786.7 22,085.3 21,901.7 29,956.8 P/E (x) 22.8 30.0 28.8 38.9
P/BVPS (x) 5.3 4.7 4.2 2.7
EV/EBITDA (x) 10.5 12.6 10.0 17.2
Source: Choice Broking Research, RHP
© CHOICE INSTITUTIONAL RESEARCHEquity Research Team
Name Designation Email id
Sundar Sanmukhanis Head of Research - Fundamental sanmukhanis@choiceindia.com
Satish Kumar Research Analyst satish.kumar@choiceindia.com
Rajnath Yadav Research Analyst rajnath.yadav@choiceindia.com
Ankit Pareek Research Associate ankit.pareek@choiceindia.com
Sunandh Subramaniam Sr. Research Associate sunand.subramaniam@choiceindia.com
Sachin Gupta Research Associate sachin.gupta@choiceindia.com
Diksha Mhatre Research Advisor diksha.mhatre@choiceindia.com
Disclaimer
es
This is solely for information of clients of Choice Broking and does not construe to be an investment advice. It is also not intended as an offer or solicitation
for the purchase and sale of any financial instruments. Any action taken by you on the basis of the information contained herein is your responsibility alone
and Choice Broking its subsidiaries or its employees or associates will not be liable in any manner for the consequences of such action taken by you. We have
exercised due diligence in checking the correctness and authenticity of the information contained in this recommendation, but Choice Broking or any of its
subsidiaries or associates or employees shall not be in any way responsible for any loss or damage that may arise to any person from any inadvertent error in
the information contained in this recommendation or any action taken on basis of this information. This report is based on the fundamental analysis with a
view to forecast future price. The Research analysts for this report certifies that all of the views expressed in this report accurately reflect his or her personal
views about the subject company or companies and its or their securities, and no part of his or her compensation was, is or will be, directly or indirectly
related to specific recommendations or views expressed in this report. Choice Broking has based this document on information obtained from sources it
believes to be reliable but which it has not independently verified; Choice Broking makes no guarantee, representation or warranty and accepts no
responsibility or liability as to its accuracy or completeness. The opinions contained within the report are based upon publicly available information at the
time of publication and are subject to change without notice. The information and any disclosures provided herein are in summary form and have been
prepared for informational purposes. The recommendations and suggested price levels are intended purely for stock market investment purposes. The
recommendations are valid for the day of the report and will remain valid till the target period. The information and any disclosures provided herein may be
considered confidential. Any use, distribution, modification, copying, forwarding or disclosure by any person is strictly prohibited. The information and any
disclosures provided herein do not constitute a solicitation or offer to purchase or sell any security or other financial product or instrument. The current
performance may be unaudited. Past performance does not guarantee future returns. There can be no assurance that investments will achieve any targeted
rates of return, and there is no guarantee against the loss of your entire investment.
POTENTIAL CONFLICT OF INTEREST DISCLOSURE (as on date of report) Disclosure of interest statement – • Analyst interest of the stock /Instrument(s): - No. •
Firm interest of the stock / Instrument (s): - No.
CONNECT US Choice Equity Broking Pvt. Ltd.
Choice House, Shree Shakambhari Corporate Park, Plt No: -156-158,
Any kind of queries on RESEARCH, J.B. Nagar, Andheri (East), Mumbai - 400 099.
You can contact us on: 022 - 6707 9999 +91-022-6707 9999
+91-022-6707 9959
www.choiceindia.com
© CHOICE INSTITUTIONAL RESEARCH
9You can also read