Investor Presentation Full Year & Fourth Quarter 2016 - Yellow ...

Page created by Danny Grant
 
CONTINUE READING
Investor Presentation Full Year & Fourth Quarter 2016 - Yellow ...
Investor Presentation
Full Year & Fourth Quarter 2016
Investor Presentation Full Year & Fourth Quarter 2016 - Yellow ...
Disclaimer

  This presentation contains forward-looking statements about the objectives,
  strategies, financial condition, results of operations and businesses of
  Yellow Pages Limited. These statements are considered “forward-looking” because
  they are based on current expectations about our business and the markets we
  operate in, and on various estimates and assumptions. Our actual results could be
  materially different from our expectations if known or unknown risks affect our
  business, or if our estimates or assumptions turn out to be inaccurate.
  As a result, we cannot guarantee that any forward-looking statements will materialize.
  Forward-looking statements do not take into account the effect that transactions or
  non-recurring items announced or occurring after the statements are made may have
  on our business.
  We disclaim any intention or obligation to update any forward-looking statements,
  except as required by law, even if new information becomes available through future
  events or for any other reason.
  Risks that could cause our actual results to differ materially from our current
  expectations are discussed in section 6 of our February 14th, 2017
  Management's Discussion and Analysis.

                                                                                           2
Investor Presentation Full Year & Fourth Quarter 2016 - Yellow ...
Our Mission

  We aim to champion the digital economy by offering consumers and merchants
        media and marketing solutions that help them interact and transact
                                                                               3
Investor Presentation Full Year & Fourth Quarter 2016 - Yellow ...
Acting as the Chief Marketing Officer for SMEs

                            Establishing Your Presence

                                    Owned & Operated                           Content Syndication
                                   Placement Advertising                     Across the Most Popular
                                                                               Search Sites & Apps

                            Boosting Your Sales & Extending Your Reach

                                         Visibility                Performance              Engagement

                              Website     Digital     SEO         SEM     Facebook       Facebook Reputation
                                          Display                            Ad            Page   Management

                            Managing Your Business

                               Online          Bookings &      Scheduling & Customer
                              Ordering         Reservations   Relationship Management

                                   Current Offering                Near Future                             4
Investor Presentation Full Year & Fourth Quarter 2016 - Yellow ...
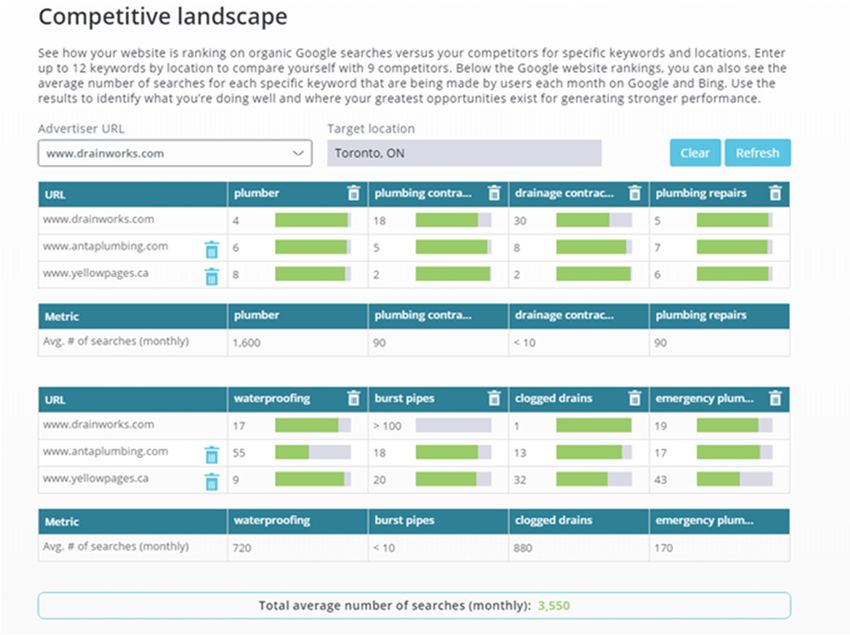
Uniquely Positioned to Capture Growth in the
Canadian Digital Marketing Landscape

                    * Size of bubble denotes approximate
                    advertising revenue in Canada

                                                                                                                                             Serving over 20% of
                                                                                                                                             the Canadian SME
                                                                                                                                             market
                                                                                                                   1

                                                                                                           Search Engine People
                                                                                                                                  Local Digital
Product Offerings

                                                                                                                                   Marketing
                                                                                                                                   Boutiques
   Breadth of

                     Self-Serve
                      Website                                                                          Local
                     Platforms                                                                       Newspapers

                                             Self-Serve                                                                             Full Serve
                                                                                        Service Level

1 ReachLocal was acquired by Gannett Co. in June 2016 and now operates as a fully-owned subsidiary                                                                 5
Investor Presentation Full Year & Fourth Quarter 2016 - Yellow ...
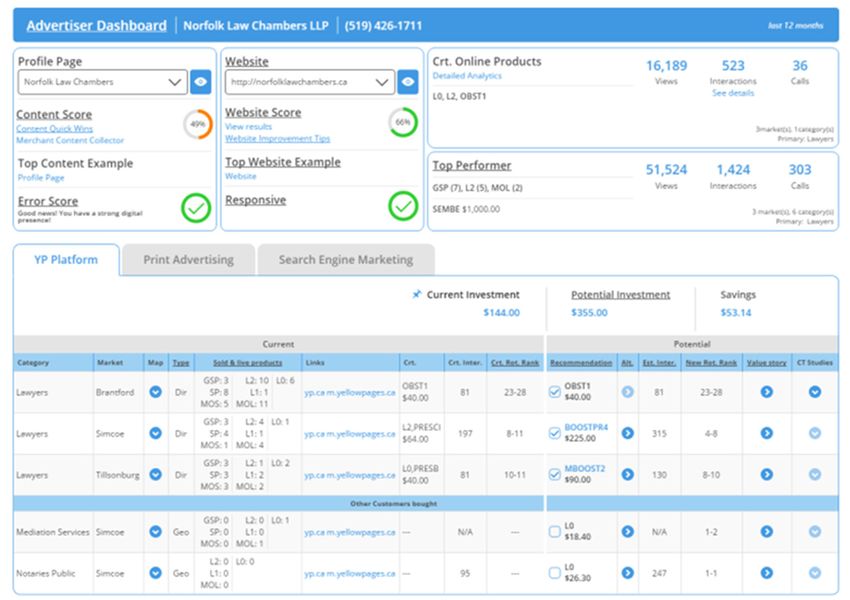
Significant Progress Made in the Digital Transformation Since 2014

                                                              • Drove mid to high single-digit annual digital revenue growth
                                                              • Generating $556M in annual digital revenues, now representing 70% of the
   Established Credible
                                                                business
     Digital Offering                                         • One of Canada’s leading digital property networks amassing 465M annual
                                                                visits1

                                                              • Accelerating growth in in annual new customer acquisition
              Improved
                                                              • Improvements in the stabilization of the customer base at 241,500 clients 2
             Operational
                                                                     • Annual net customer count decline of ~3,500 versus ~30,000, which was
             Capabilities                                              the case before the launch of the Return to Growth plan

          Investments in                                      • Acquired ComFree / DuProprio, gaining immediate scale in the real estate
                                                                vertical and complimenting our command of the home services vertical
             Growth                                           • Acquired JUICE and repositioned Mediative, expanding our digital marketing
           Opportunities                                        portfolio and reach to global brands

                                                              • $490M repaid in debt since the issuance of the Senior Notes in 2012
       Deleveraged Our
                                                              • Ability to generate free cash flow providing financial flexibility to invest in our
        Balance Sheet                                           business operations, technologies, and product offering

1 Visits made across the YP, YP Shopwise, YP Dine, RedFlagDeals, Canada411, Bookenda, dine.TO properties, as well as visits made across the YP's syndication partners
2 Excludes the contribution of Mediative, JUICE, 411, Yellow Pages Homes Limited, the ComFree / DuProprio and Totem                                                     6
Investor Presentation Full Year & Fourth Quarter 2016 - Yellow ...
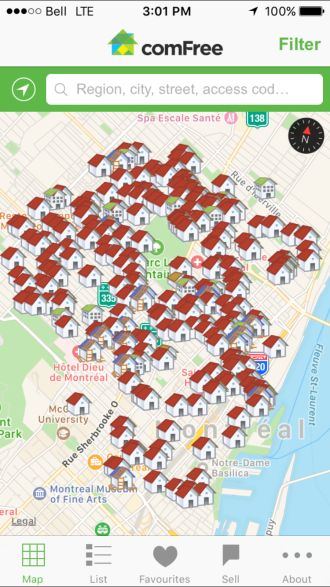
Profitability Profile of the Yellow Pages’ Business Segments
                                Relative Size of Gross Margins of Our Local Digital Solutions

                                                                                 Print                                          Cost structure is
 High                                                                                                                          principally variable,
                                                                                                                                with profitability
Margin                                                                                                                             tracked on a
                                              Online & Mobile Priority Placement                                               book-by-book basis

                                            Websites
 Mid-
Margin
                       Search Engine Optimization

                     NetSync – Content Syndication

 Low                      Resale                                       Leveraging YP traffic to deliver high-margin
Margin                   SEM & FB                                         performance-based leads solutions

                                 Placement solutions on Yellow Pages Owned & Operated properties,
                                     hold the highest profitability among our digital product suite

 1 Excludes the contribution of Mediative, JUICE, 411, Yellow Pages Homes Limited, the ComFree / DuProprio Network and Totem                           7
Investor Presentation Full Year & Fourth Quarter 2016 - Yellow ...
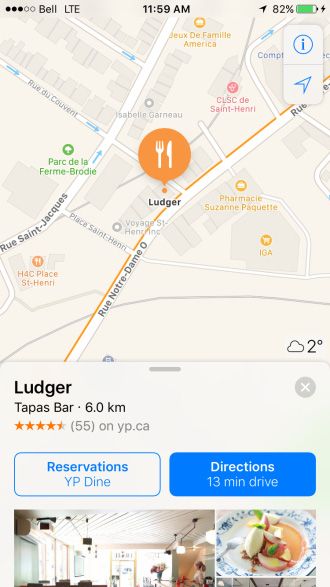
Changes in Yellow Pages’ Consolidated Revenue Mix

                                                    Adj. EBITDA Margins            Adj. EBITDA Margins
     Relative Size of Revenue of Our Businesses

                                                    Between 28% to 30%         Between 22% to 24% in 2017
                                                                                                                                     Revenue trajectory is in line
                                                                                                                                 with the RTG plan, supported by a
                                                  Digital Services,                                                              diversification of our digital business
                                                                               Digital Services,
                                                  Resale & Subs1
                                                                               Resale & Subs1

                                                                                                                              Customers are increasingly attracted to the
                                                                                                                              resale solutions, which happen to be lower
                                                     Owned &                                                                                margin products
                                                                                     Owned &
                                                     Operated                        Operated

                                                                                                                                Initiatives have been implemented to
                                                                                                                                revert trend and stabilize profitability
                                                         Print                            Print

                                                     RTG Plan                    Current View

                                                  Consolidated revenue is on track, however levels of long-term profitability
                                                             have shifted due to changes in digital product mix

1 Includes the contribution of Mediative, JUICE, 411, Yellow Pages Homes Limited, the ComFree / DuProprio Network and Totem                                                 8
Investor Presentation Full Year & Fourth Quarter 2016 - Yellow ...
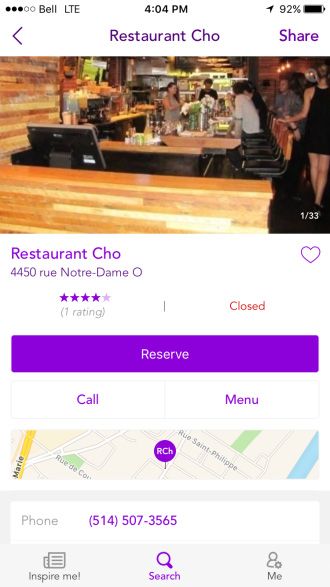
The Owned & Operated Digital Experience for Consumers
  Business & People Search                                                                                        Retail

                     YP                                                                                                             YP Shopwise
                     Discover everything your local                                                                                 Everyday shopping app to help Canadians save
                     neighbourhood has to offer                                                                                     time and money

                     Canada411 & 411.ca                                                                                             RedFlagDeals & RFD Forums
                     Network of Canada’s most frequented and trusted                                                                Canada’s leading provider of online and mobile
                     online and mobile destinations for personal and                                                                promotions, deals, coupons and shopping tools
                     local business information

                                                                                                                                    YP Grocery
                                                                                                                                    Combs flyers and coupons to get Canadians the
                                                                                                                                    most savings on their grocery list

  Real Estate                                                                                                     Dining
                     ComFree / DuProprio Network                                                                                    YP Dine
                     C2C marketplace offering homeowners a                                                                          Discover, search for and book local restaurants
                     professional and cost effective service to market                                                              based on time of day, mood and expert
                     and sell their properties                                                                                      suggestions

                     YP NextHome
                                                                                                                                    Bookenda
                     Provides Canadians with valuable real estate
                                                                                                                                    Leading online transaction platform for users and
                     information to help them make the right buying,
                                                                                                                                    merchants to easily interact and manage bookings
                     selling, and/or renting decision

                        Attracting over 465 million1 visits to our network of digital properties annually

1 Excludes the contribution of the ComFree / DuProprio Network, which attracted 16.3 million visits during the fourth quarter of 2016                                                   9
Investor Presentation Full Year & Fourth Quarter 2016 - Yellow ...
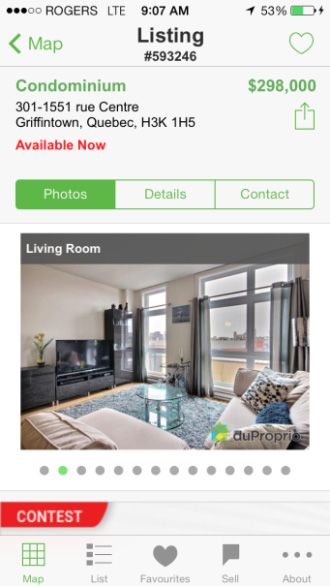
Attracting Millions of Canadians to Our Media Properties
                                                                                                              Local Partner of Choice with Global Players
One of Canada's Most Frequented Properties                                                                    Driven by YP’s Data on Canada’s Marketplace

                                               Total Unique Visitors               Reach                                      Apple                                              Google

1.          Google                                        29 M                       94%

3.          Facebook                                      25 M                       82%

5.          eBay                                          21 M                       70%

17.         Yellow Pages                                  12 M                       40%

25.         Trip Advisor                                  10 M                       33%

56.         Yelp                                          5M                         18%

With Significant TDVs Across the Network
(in millions)

                     Yellow Pages Group 2            ComFree/DuProprio

                                                                                    16.3

        16.5
                           25.2               23.8               19.8

                                                                                                                   Instant Reservations
                                                                                   148.9                      Bookings  and reservations through integration with
       118.2                                                                                                  Through Integration with
                          100.2              106.2               109.4
                                                                                                                      Apple
                                                                                                                    Apple MapsMaps & the Google Network

      Q4 2015           Q1 2016            Q2 2016            Q3 2016            Q4 2016

1 As per comScore Media Metrix, December 2016
2 Visits made across the YP, YP Shopwise, YP Dine, RedFlagDeals, Canada411, Bookenda, dine.TO, ComFree and DuProprio properties, as well as visits made across the YP's syndication partners   10
Sophisticated Digital Marketing Tools to Extend SME’s Reach

   Mobile & Desktop Placement                Content Syndication Across                    Professional Website
  Advertising Across YP Network                 25+ Search Partners                     Fulfillment & Management

 Search Engine Optimization          Digital Display                                            Facebook Campaign
                                                              Search Engine Marketing
     Presence on SERPs            Advertising Solutions                                            Management

                                                                                                                    11
Transaction Oriented Approach to Create New Opportunities

YP Dine                                                   ComFree / DuProprio

          Providing YP Dine Customers with                 Access to a Proven    Connecting Buyers to
   Solutions to Interact & Transact with Customers          C2C Marketplace     Our Advertisers Directly

 On Demand Ordering           Integrated Booking Engine

            Growth of our customer base and through a transaction oriented approach in
                               current and new customer segments

                                                                                                           12
One of the Leading Digital Advertising Agencies for Global Brands

                                                                            JUICE Awards

       One of Canada’s leading national digital advertising agencies, leveraging
      proprietary programmatic technologies and an extensive publisher network
                    to connect Canadians with the brands they love

Network of Brand Relationships                Extensive Publisher Network

                                                                                           13
Significant Deceleration in Net Customer Count Decline

Annual Customer Acquisition1                                                                                Net Customer Count Decline1,2
(in thousands)                                                                                              (in thousands)

                                                                               40.2 41.1
                                                                        38.6                                   30
                                                               34.6
                                                                                                                       26
                                                       30.8
                                                                                                                                23
                                                27.2
                                        24.8                                                                                          20
                                23.7                                                                                                            19
                         22.1                                                                                                                        17
                  20.2
         18.4                                                                                                                                              14
  16.5
                                                                                                                                                                  11

                                                                                                                                                                       7
                                                                                                                                                                              4         3.5
                                                                                                                                                                                  3

              3                                                                                                             3
   Q1     Q2      Q3      Q4     Q1      Q2      Q3     Q4      Q1      Q2      Q3     Q4                      Q1      Q2       Q3    Q4    Q1       Q2    Q3     Q4   Q1    Q2   Q3    Q4
         2014 TTM                       2015 TTM                        2016 TTM                                     2014 TTM                        2015 TTM                2016 TTM

                                                        2014 TTM                                        2015 TTM                                      2016 TTM

                                           Q1          Q23         Q3          Q4          Q1         Q2          Q3            Q4         Q1        Q2         Q3     Q4

                         Customer
                          Renewal
                                          85%          85%        85%          84%        85%         85%         85%           85%    84%           83%        83%    82%

                         Renewers
                         Upselling
                                          26%          26%        27%          31%        35%         40%         44%           44%    42%           43%        44%    47%

1 YP Core only, excludes the contribution of Mediative, JUICE, 411, Yellow Pages Homes Limited and the ComFree / DuProprio Network
2 Represents the year-over-year change in customer count experienced during the period
3 The Return to Growth Plan was announced on May 8th, 2014                                                                                                                                    14
Empowering the YP Salesforce With Best-in-Class Tools

 Compass, our in-house sales platform, used throughout the sales cycle to streamline the customer
             journey, from: Account Preparation to Sales Call to Post Sales & Support

                                                                                                    15
The Compass Ecosystem: Business Review

                                                           3

   “Business Review” provides data on advertising performance and ties spend to traction, reach
         and ROI. Communicating performance is instrumental in building trust with SMEs

                                                                                                  16
The Compass Ecosystem: Search Landscape

  “Search Landscape” provides SMEs a lay-of-the-SERP-land. The tool provides key data, such as
 organic rankings and keyword volumes, which help evaluate the effects of additional investments

                                                                                                   17
The Compass Ecosystem: Recommendation Engine

 “Recommendation Engine” is the sales dashboard providing the most relevant KPIs and analyses.
   Such as benchmarking to peers, content score, analytics across the YP Network and product
                      recommendations tailored to SME being serviced

                                                                                                 18
Stabilization in Customers Driven by Growth in Digital Customers

Customer Count                                                               Digital Only Customers
(in thousands)                                                               (in thousands)

 270
                                                                                                                                                             76.8
        265                                                                                                                                           72.2
                                                                                                                                               67.2
                 260
                                                                                                                                        60.5
                       256                                                                                                       54.5
                                                                                                                          49.1
                             251
                                                                                                                   44.4
                                   248                                                                      40.8
                                         246                                                         37.0
                                               245
                                                     244 244                                  32.7
                                                               243
                                                                     241.5            29.4
                                                                               26.1

  Q1    Q2       Q3    Q4    Q1    Q2    Q3    Q4    Q1   Q2   Q3     Q4       Q1     Q2      Q3     Q4     Q1     Q2     Q3     Q4     Q1     Q2     Q3     Q4
       2014 TTM                    2015 TTM               2016 TTM                    2014 TTM                     2015 TTM                    2016 TTM

       Significant progress made in becoming one of Canada’s leading digital marketing companies

                                                                                                                                                                    19
Print and Digital Revenue Performance

Print Revenue Performance                                                                                       Digital Revenue Performance
(in millions, unless otherwise noted)                                                                           (in millions, unless otherwise noted)
 YoY Change                                                                                                      YoY Change
    (19%)                (23%)               (23%)              (24%)              (25%)                            +11%                  +17%               +22%                +8%                   +11%

        79                                                                                                                                                    142                                      143
                                                                                                                                                                                  139
                                                                                                                                           132
                            72                                                                                          129
                                               68

                                                                  63
                                                                                     60

                                                                                                                                      Pro forma1
                                                                                                                                         +8%                  +6%                +3%                   +3%

    Q4 2015            Q1 2016            Q2 2016             Q3 2016            Q4 2016                            Q4 2015             Q1 2016            Q2 2016            Q3 2016            Q4 2016

1 Pro forma digital revenue growth adjusts digital revenues for the full inclusion of the ComFree / DuProprio Network and JUICE as though they were fully owned in the current and prior year period          20
Revenue and Adjusted EBITDA Performance

Consolidated Revenue Performance                                                                              Adjusted EBITDA Performance
(in millions, unless otherwise noted)                                                                         (in millions, unless otherwise noted)

 YoY Change
    (3%)                  (1%)               +3%                (4%)               (3%)                        YoY Change
                                                                                                                   (1%)                 (13%)              (4%)               (11%)                 (11%)

       209                                   210
                          204                                   201                203

                                                                                                                       64
                                                                                                                                         62
                                                                                                                                                            59
                                                                                                                                                                                57                   57

                     Pro forma1
                        (5%)                (5%)               (7%)                (7%)
                                                                                                                   Adjusted
                                                                                                                   EBITDA
    % Digital                                                                                                       Margin
      62%                 65%                68%                69%                71%                               31%                 30%                28%                28%                  28%

    Q4 2015            Q1 2016            Q2 2016            Q3 2016            Q4 2016                           Q4 2015             Q1 2016           Q2 2016            Q3 2016            Q4 2016

1 Pro forma consolidated revenue growth adjusts revenues for the full inclusion of the ComFree / DuProprio Network and JUICE as though they were fully owned in the current and prior year period           21
Strong Free Cash Flow to Deleverage the Balance Sheet

Free Cash Flow Relative to Debt Repayment                                                                   Overview of Debt Instruments
(in thousands, unless otherwise noted)
                                                                                                            Senior Secured Notes
        Total Debt                                                                                                                   $309.7M Outstanding
        Repayment:                                                                                          Description              9.25% per annum, payable quarterly
          $140M                            $100M                          $97M                                                       Senior to all other obligations of the Issuer

                                                                                                            Issue/
                                                                                                                                     Dec. 20, 2012 / Nov. 30, 2018
                                                                                                            Maturity Date

                                                                                                                                     S&P: BB-
                                                                                                            Credit Rating
                                                                                                                                     DBRS: BB (low)

                                                                                                                                     75% of the Excess Free Cash Flow1 for the preceding
                                                                                                            Cash Sweep
                      65                                                                                                             six-months ended March 31 and Sept. 30,
                                                                                                            Feature
                                                                                                                                     subject to a minimum cash balance of $75M

                                                                                                            Prepayment               105% of the principal prior to May 31, 2017
                                                                                                            Option                   100% of the principal after May 31, 2017

                                                     50
                                                                                                            Exchangeable Debentures
                                     122
                                                                                                                                     $107.1M Outstanding
                                                                    95              97                      Description              8.0% per annum, payable semi-annually1
                      75                                                                                                             Subordinated unsecured obligations
       73
                                                                                                            Issue/
                                                     50                                                                              Dec. 20, 2012 / Nov. 30, 2022
                                                                                                            Maturity Date

                                                                                                                                     S&P: CCC+
                                                                                                            Credit Rating
                                                                                                                                     DBRS: B (low)

             2014                           2015                          2016                              Conversion               Exchangeable into common shares at any time at an
                                                                                                            Feature                  exchange price equal to $19.042
        Free Cash Flow             Min. Repayment               Excess Repayment                            Prepayment               110% of the principal prior to May 31, 2021
                                                                Through Cash Sweep                          Option                   100% of the principal after May 31, 2021

1 Or 12% per annum if the payment is made in kind
2 Representing an exchange ratio of approximately 52.5210 common shares for each $1,000 principal amount of debentures
Note: The Company has in place a $50 million Asset-Based Loan expiring in August 2018, which may be used for general corporate purposes                                                    22
Overview of Capital Structure and Net Debt

        (in millions, unless otherwise noted)                                   Dec. 31, 2012                             Dec. 31, 2015   Dec. 31, 2016

        Senior Secured Notes1                                                           800                                        407        310

        Exchangeable Debentures2                                                         87                                         90         92

        Obligations Under Finance Leases                                                  2                                           1        0

        Total Debt                                                                      888                                        498        402

        Cash and Cash Equivalents                                                       107                                         67         17

        Total Net Debt                                                                  782                                        431        385

        Total Equity                                                                    286                                        760        369

        Net Debt / Adjusted EBITDA                                                      1.4x                                       1.7x       1.6x

        Trailing 12 Months Free Cash Flow                                               198                                         122        95

                                        $490 million in Senior Notes has been repaid since issuance

1 9.25% Senior Secured Notes due November 30, 2018
2 8.0% (or 12.0% paid in kind) Subordinated Unsecured Exchangeable Debentures due November 30, 2022
Note: The Company has in place a $50 million Asset-Based Loan expiring in August 2018, which may be used for general corporate purposes                   23
Full Year 2017 Operational & Financial Guidance

                                                          Stabilization of the Customer Base Via 45,000 New Acquisition Target

                                                                        Year-over-year Total Digital Revenue Growth Between 4% to 7%

                                                                                    Adjusted EBITDA Margin of 22% to 24%1

                                                          Stabilization of Adjusted EBITDA in the Short to Mid-term, Post-2017

1 Includes non-recurring investments related to addressing the product mix effect                                                      24
APPENDIX
Overview of ComFree and DuProprio (“CF / DP”)
• Online C2C marketplace to help Canadians sell their homes
• Offers fee-based à la carte solutions and expertise, which eliminates agents to save money
• One of Canada’s most trafficked real-estate properties (Ranked Top 4 in Canada1)
• Provided an entry point to transaction-based offering

 Changing of the Guard in Canadian Real Estate                       À la Carte Services & Solutions

                                  Traditional        ComFree
                                  Brokerage          DuProprio                      • In-home introductory appointment & consulting
                                                                       Getting      • Custom high-quality photos
                                                                       Started      • Pricing assistance and market data driven by internal
  Control of
                                     Realtor        Home Owner                        database of listings and historic transactions
 Sales Process

   Real Estate
                                   Generalist      Team of Experts                  • Listing, presence and preferred placement on the
    Expertise                                                         Marketing       ComFree / DuProprio digital network and apps
                                                                        Your
                                                                      Property      • Custom lawn and directional signs and printable
   Customer                       Ad-hoc &          Consistent &                      feature sheets and custom booklets
   Experience                    highly varied     owner-centric

                               ~5% of property                                      • Customer support available 7 days a week
        Fee                                        $300 to $2,500                   • Sales and marketing coaching from seasoned real
                                   value                             Selling With
                                                                       Support        estate professionals and notaries
                                                                                    • Detailed guides and access to all the legal
    Principal                                                                         documents required to finalize the transaction
                                     Realtor       Home Owner
   Benefactor

 1 – As per comScore Media Metrix, February 2017                                                                                              26
Overview of JUICE
• Pioneer in mobile programmatic (direct & RTB) advertising
• Ad-tech company driving innovation in mobile targeting, placement, and creative
• Expands YP’s customer base to serve national brands and provides data on habits of brands
  and consumers

 JUICE’s Proprietary Mobile Ad Platforms                              JUICE’s Publisher Network

    Swarm is a mobile first demand-side real-time bidding
     platform. It enables advertising to purchase unique
    behavioral audience segments with fine-grain location
                      targeting at scale

   Nectar is the only Programmatic Direct-platform built for
 mobile. It plugs directly into a publisher’s ad server for a first
             look at premium inventory availability.
 It introduces the efficiency of automation to the process of
  booking guaranteed inventory with premium publishers, at
                     scale, in one platform.

                                                                                                  27
Overview of Mediative
• Offshoot of Yellow Pages formed in 2011 as full-service marketing agency
• Acts as the exclusive manager to several mainstream publisher ad networks, including
  Walmart Canada and the Yellow Pages Network
• Expands YP’s customer base to serve national brands and provides data on habits of brands
  and consumers

Digital Marketing Solutions & Services                                                                    Mediative’s Publisher Ad Network

     Display Network &                        Advertise across Mediative’s                                          Reaching Over 16.8 Million Consumers a Month
 A
        Digital Media                            extensive ad network

                                        Target the exact type of consumers
      Location-based
 B                                       through hyper-local advertising,
        Marketing                                search and social

                                           Make sense of your analytics to
           Search &
C                                        invigorate your brand online using
         Performance                           tools like SEM and SEO

                                             Leverage Mediative’s premier
D    Creative Services                      creative to deliver user-centric                                                     The Yellow Pages Network1
                                            designs and engaging content

1 The Yellow Pages Network consists of YP, YP Shopwise, RedFlagDeals, YP Grocery, YP Dine, Bookenda, dine.TO, Canada411, 411.ca, YP NextHome, ComFree / DuProprio and Totem   28
You can also read