"Avoid" to Craftsman Automation - 'High debt level; poor return ratios'
←
→
Page content transcription
If your browser does not render page correctly, please read the page content below

“Avoid” to
Craftsman Automation
‘High debt level; poor return ratios’
12th Mar. 2021

Salient features of the IPO:                                                    Recommendation                             Avoid

•   Craftsman Automation Limited (CAL) is a diversified engineering Price Band                                Rs1,488 - Rs1,490 per share
    company engaged in three business segments include Automotive- Face Value                                         Rs5 per share
    powertrain & other products, Automotive-aluminium products and
                                                                    Fresh Issue Size                                   Rs1,500 mn
    industrial & engineering products segment.
                                                                                Share for Fresh Issue                1.01mn shares
•   The company own and operates 12 strategically                    located
    manufacturing facilities across seven cities of India.                      OFS Issue Size                         Rs6,737 mn
                                                                                Total Issue Size                       Rs8,237 mn
Valuation: At higher price band of Rs1,490, the issue is valued at P/E of
46.6x (on FY21 post issue annualized EPS).                                Bidding Date                        Mar 15' 2021 - Mar 17' 2021
                                                                                MCAP at Higher Price
Below are few key observations of the issue: (continued in next page)                                                Rs31,481.2 mn
                                                                                Band

•   CAL, established in 1986 in Chennai, is a diversified auto ancillary & Book Running Lead                       Axis Capital Limited
    engineering company deals in three key segments include Manager                                              IIFL Securities Limited
    automotive-powertrain & other products, automotive-aluminium
    products and industrial & engineering products.                        Registrar                       Link Intime India Private Limited

•   The company manufactures automotive & industrial products from its Industry                                      Auto ancillary
    12 strategically located manufacturing facilities across seven cities of
    India.
•   Business is diversified across end-user industries as CAL caters to the   Retail application money at higher cut-off price per lot
    needs of heavy commercial vehicles to two wheelers. The company
    manufactures cylinders blocks, cylinders heads and transmission parts Number of shares per lot                   10
    which are required for tractors and trucks as well as crank cases
    which are required for two wheelers.                                    Application Money                 Rs14,900 per lot
•   Automotive-powertrain & other products is the major business
    segment accounted for 51.2% of CAL’s business as of 9MFY21. The             Allocation Detail
    segment includes highly engineered products such as cylinder block
    and cylinder head, camshafts, transmission parts and bearing caps           Qualified Institutional
                                                                                                                           50%
    among others. End users of these products are OEMs producing                Buyers (QIB)
    commercial vehicles, special utility vehicle, tractors and off-highway
    vehicles. Commercial vehicles, SUVs accounts for 30% and 42% of the         Non-Institutional
                                                                                                                           15%
    segment’s business, while tractors & construction equipment                 Investors (NII)
    comprises 21% & 7%. End user customers list also include some
    marquee OEMs such as Daimler India, Tata Motors, M&M, Escorts,              Retail Individual
                                                                                                                           35%
    Ashok Leyland among others.                                                 Investors (RIIs)

•   The company is present across the entire value chain in the
                                                                                Shareholding Pattern
    automotive aluminium product segment which accounted for 21.1%
    of CAL’s revenue as of 9MFY21. Key products under this segment                                               Pre-Issue         Post Issue
    include crank cases & cylinder blocks for two wheelers, engine &            Promoter & promoter
                                                                                                                  63.4%             59.8%
    structural parts for passenger vehicles and gear box housing for heavy      group
    commercial vehicles. As the company has an entire range of                  Public                            36.6%             40.2%
    aluminium casting and product capabilities, increased usages of non-        Total                             100.0%            100.0%
    ferrous metal like aluminium to reduce the weight of vehicles under
    BS VI norms has become key growth driver for this segment. Key                                        Source: Choice Broking Research, RHP
    customers of company under this segment are Royal Enfield, M&M,
    TVS Motors and Daimler India.                                               Analyst
•   Industrial & engineering segment accounted for 27.7% of revenue             Satish Kumar
    during 9MFY21. In this segment, company manufactures high end
                                                                                                                (022-67079999; Ext:913,
    precision products include aluminium products for power                     Deskphone
                                                                                                                   Mob:9167120440
    transmission and storage solutions business products such as pallets,
    racking, shelving among others.                                             Email                        satish.kumar@choiceindia.com

                                                                                                                                     1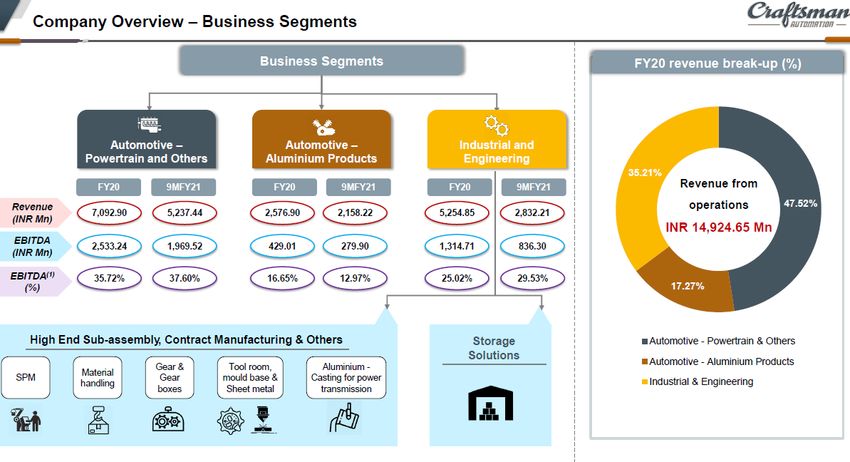
Continued……

•   CAL diversified business across segments as share of automotive - powertrain & other products reduced to 47.5%
    in FY20 from 58% in FY18. Top 10 customers accounted for 53.4% of total revenue in FY20 and 59% in 9MFY21.
•   CAL operated at 70% capacity utilisation (CU) level in FY20 for powertrain & aluminium segments while CU stood
    at 40% for industrial & engineering segment.
•   CAL incurred significant capex particularly in FY19 to enhance the installed capacity. Though FY20 remained
    challenging due to auto industry slowdown amid events like transition to BS VI norms which impacted business
    adversely. Higher capex in FY19 leading to rise in debt level while slowdown in FY20 weighed on business with
    increase in interest cost impacting PAT margin. D/E raised to 1.44x in FY20. Profit margin impacted as interest
    cost remained high at a rate of ~15% during FY18-FY20 due to lower long term debt rating at BBB+ stable.
•   Company will utilize Rs1,200 mn from fresh proceed for the repayment of debt which will modestly help to
    improve profit margin (reported debt at Rs8,901 mn and D/E at 1.15x in 9MFY21). Post issue, D/E will reduce to
    0.85x which still looks at higher level.
•   CAL managed to keep EBIDTA level above 25% in FY20 and 9MFY21, significantly higher than peers. Though,
    despite high EBIDTA margin, profitability of the business remained under pressure due to lower profit margin
    (NPM) impacting by higher interest cost. Considering the BBB+ rating for long term debt, interest cost is likely
    to remain high until the company gets any rating upgrade which is not likely any time soon. We also see
    modest positive impact to the tune of Rs120 mn from repayment of debt from fresh issue. Moreover, RoE
    remained low at 7.3% (post issue, annualized) and further improvement largely depend upon strong business
    growth and NPM movement.
•   If we annualize 9MFY21 performance, EPS derives at Rs32. At the higher price of Rs1,490, the issue is valued at
    P/E of 46.6x. Peers valuation include Endurance Technologies at P/E of 45x, Mahindra CIE at P/E of 63.4x and
    Sundram Fasteners at P/E of 55.8x.
•   While CAL maintains strong operating efficiency and has also operating leverage advantage, we are concerned
    over high debt level and poor RoE, the improvement on both fronts requires strong business growth and
    favourable movement on NPM front. Further, the IPO issue consists a higher amount of OFS of Rs6,737 mn
    which also disappoints as contrary to this or higher fresh issue size can be utilized by firm to reduce debt level
    significantly.
Considering all these parameters, we assign ‘Avoid’ rating to issue

Peer comparison
                                         CMP          6M        12M         M Cap    EBIDTA Mar.          NPM           RoE          RoA
Companies
                                        (Rs/s)       (R%)       (R%)       (Rs mn)        (%)               (%)          (%)          (%)
Craftsman Automation                    1,490          -          -        31,481.2     28.1%             5.0%         7.3%         2.8%
Bharat Forge                             613        33.0%      48.0%      2,85,045.0     9.3%             -6.8%        -7.8%       -33.7%
Endurance Technologies                  1,400       29.6%      44.0%      1,97,400.0    15.7%              7.3%        14.4%         7.9%
Jamna Auto Industries                     70        50.0%     130.0%       28,000.0     10.6%              4.3%         7.6%         4.6%
Mahindra CIE                             179        43.9%      46.0%       67,841.0      8.3%              1.8%         2.4%        11.2%
Minda Industries                         547        61.9%      63.0%      1,47,690.0    10.6%              1.6%         4.0%         1.6%
Sundram Fasteners                        726        72.0%      89.0%      1,52,460.0    17.1%              8.5%        13.3%         7.6%
Ramkrishna Forgings                      544       144.0%     108.0%        1,740.8     15.1%             -2.1%        -2.6%        -0.9%

                                         P/E        P/BV        P/S      EV/EBIDTA        D/E                          Net
Companies (Rs mn)                                                                                           EV                      BVPS
                                          (x)        (x)         (x)           (x)         (x)                        Worth
Craftsman Automation                    46.6         3.4         2.3          13.3         0.9           40,071.8    9,216.1        436.2
Bharat Forge                            -70.0        5.5         4.8          59.4         0.9          3,30,740.0   51,960.0       111.7
Endurance Technologies                   45.0        6.5         3.3          20.8         0.2          1,96,490.0    30,540        216.6
Jamna Auto Industries                    77.8        5.9         3.4          32.0         0.1           28,190.0     4,720          11.8
Mahindra CIE                             63.4        1.5         1.1          16.4         0.4           81,941.0     45,290        119.5
Minda Industries                        189.3        7.5         2.9          29.3         0.5          1,55,470.0    19,710         73.0
Sundram Fasteners                        55.8        7.4         4.8          29.0         0.3          1,58,710.0    20,560         97.9
Ramkrishna Forgings                     -82.9        2.2         1.7          18.2         1.3           27,698.0     8,030         250.9
*- Craftsman Automation – FY21 annualized EPS : Return ratio annualized basis, margin 9MFY21, Post issue net worth
                                                                                                        Source: Choice Broking Research, RHP
                                                                                                          © CHOICE INSTITUTIONAL RESEARCH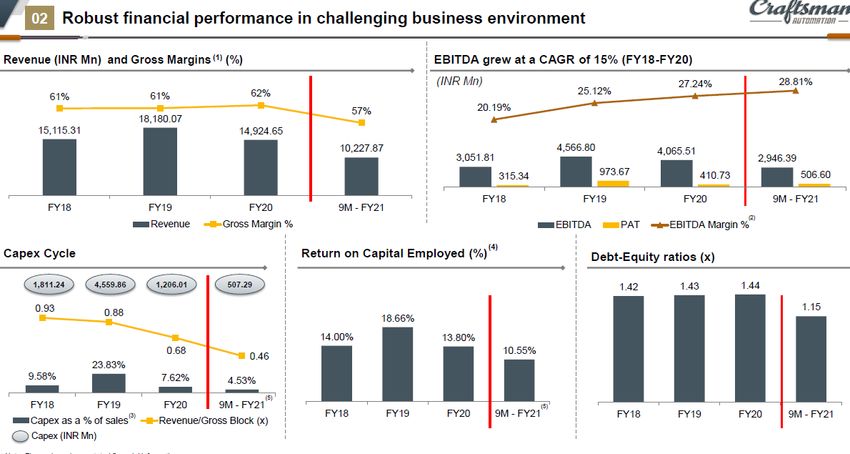
About the issue:
 •    Craftsman Automation Limited (CAL) is coming with initial public offering of Rs8,237 mn.
 •    The issue comprises fresh issue of Rs1,500 mn and offer for sale (OFS) of 4.521 mn shares.
 •    At the higher price band of Rs1,490, fresh number of shares are stood at 1.007 mn. While OFS size comes at Rs6,737
      mn at the higher price band.
 •    Promoter namely Srinivasan Ravi is selling 0.13 mn shares. Post issue, promoters’ stake will reduce to 59.8% from
      63.4% pre issue.
 •    Other selling shareholders include 1.6 mn shares from Marina III, 1.4 mn shares by IFC and 1.4 mn shares by individual
      investor K Gomatheswaran.
 •    Post issue Marina III stake will reduce to 7.38% from 15.5% and IFC to 6.7% from pre issue stake of 14.1%. While,
      individual investors K Gomatheswaran will sell all his stake in the company.
 •    Issue will open for subscription on Mar 15’ 2021 and close on Mar 17’ 2021
 •    Not more than 50% of the net offer shall be available for allocation on a proportional basis to a qualified institutional
      investors (QIIs).
 •    Further not less than 15% shall be available for allocation on a proportional to non-institutional investors (NIIs) and
      not less than 35% of net offer shall be available for allocation to Retail Institutional Investors (RIIs).
 •    Average cost of acquisition for selling shareholders is Rs470 for Marina, Rs208 for IFC and Rs1.27 for K.
      Gomatheswaran. Average cost of acquisition for selling promoter S. Ravi is Rs1.06.

                            Objective of Offer
                            Fresh Issue                                                  Rs1,500 mn
                            Repayment/ pre-payment, in full or part, of certain borrowings
                                                                                           Rs1,200 mn
                            availed by company
                            General corporate purposes                                   Rs300 mn

Indicative IPO process time line:

                                                                    Unblocking of
                           Offer Closes on
                                                                    ASBA Account
                            17-Mar-2021
                                                                    23-Mar-2021

     Offer Opens on                              Finalization of                                                Commencement
      15-Mar-2021                                Basis of                               Credit to Demat         of Trading
                                                 Allotment                              Accounts                25-Mar-2021
                                                 22-Mar-2021                            24-Mar-2021
Company introduction:
Craftsman Automation Limited (CAL) is a diversified engineering company with vertically integrated manufacturing
capabilities, engaged in three business segments namely powertrain and other products for automotive segment,
automotive aluminium products and industrial & engineering products segment. The company own and operates 12
strategically located manufacturing facilities across seven cities of India.
CAL is the largest player involved in machining of cylinders blocks and cylinders heads in the intermediate, medium and
heavy commercial vehicles segment as well as in the construction equipment industry in India. CAL is among the top three-
four component players with respect to machining of cylinder block for tractor segment in India. The company is present
across the entire value chain in the automotive aluminium product segment providing diverse products and solutions.
CAL is a significant player in the automotive-powertrain segment with highly engineered products which include engine
parts such as cylinder blocks, cylinder heads, camshafts, transmission parts, gear box housing, turbo chargers, bearing caps
and machining services. End users of these products include OEMs producing commercial vehicles, special utility vehicle,
tractors and off-highway vehicles. Key products under automotive- aluminium product segment include crank case and
cylinder blocks for two wheelers, engine and structural parts for passenger vehicles and gear box housing for heavy
commercial vehicles. Within industrial and engineering segment, CAL developed a diverse product portfolio across two
segments namely 1) storage solution for conventional/automated storage and 2) high end precision products such as
aluminium products for power transmission, material handling equipment such as hoists, crane kits among others.
Source: Choice Broking Research, RHPBusiness Overview:
As per RHP, CAL is considered as a strategic and preferred suppliers by OEM customers and also the single source suppliers
in certain product categories for some key customers. Large portion of the business comprises direct supply to OEM
customers under long term agreements which renewed time to time. Revenue mix include automotive – powertrain &
others accounted for 51.2%, automotive- aluminium products at 21.1% and industrial & engineering segment at 27.7% of
total revenue by 9MFY21. Exports from powertrain segment accounted for 1.6% and exports from industrial & engineering
segment accounted for 9.98% of revenue in 9MFY21. CAL business was impacted in FY20 due to auto industry slowdown
with sales declined to Rs14,924.7 mn in FY20 from Rs18,180 mn in FY19. In 9MFY21, the company posted sales of Rs10,228
mn while EBIDTA margin stood at 28.1% and PAT margin at 5.0%.
Source: Choice Broking Research, RHPCompetitive strengths:
• Diversified business with a focus on providing comprehensive solutions and
manufacturing high quality, intricate and critical products, components and
parts
• Strong in-house process and product design capabilities with ability to
interchange capacity and product mix
• Long term and well-established relationships with marquee domestic and
global OEMs.
• Extensive manufacturing footprint with strategically located manufacturing
facility
• Experienced management team supported by motivated and skilled work
force
Business strategy:
• Leverage vertically integrated manufacturing and engineering capabilities
to tap growing opportunities
• Increase wallet share and acquire new business by leveraging existing
OEM relationship and adding new customers
• Growing opportunities in storage solutions
• Continue to reduce operating costs and improve operational efficiencies
Risk and concerns:
• Risk to business growth if auto industry demand revival slows
• Prevailing economic slowdown
• High commodity prices can impact margin
• High interest cost impacting NPM
© CHOICE INSTITUTIONAL RESEARCHFinancial statements:
Rs mn
Profit & Loss A/c Cash Flow Statement
Particulars FY18 FY19 FY20 9MFY21 Particulars FY18 FY19 FY20 9MFY21
Operating Revenue (OR) 15,115.3 18,180.1 14,924.7 10,227.9
Cash Flow from Operating
Cost of Material Consumed (5,916.9) (7,104.9) (5,717.0) (4,387.3) 2,827.0 3,600.0 3,053.7 2,420.6
Activities
Changes in Inventories of
Cash Flow from Investing
(2,107.4) (3,584.1) (1,370.7) (454.7)
Finished Goods, Work-in- 159.2 70.2 (150.7) 48.1 Activities
Progress
Purchase of fixed assets
(2,038.6) (3,558.1) (1,386.9) (495.0)
Employee Benefit Expenses (1,986.3) (2,168.3) (1,709.9) (1,105.9) and properties
Other Expenses (4,110.8) (4,550.6) (3,367.3) (1,908.4)
Cash Flow from Financing
EBITDA 3,260.5 4,426.4 3,979.8 2,874.4 (603.1) (182.3) (1,279.3) (2,254.0)
Activities
Depreciation and
(1,491.5) (1,761.5) (1,949.9) (1,414.7) Net Cash Flow 116.5 (166.4) 403.7 (288.1)
Amortization Expenses
EBIT 1,768.9 2,664.9 2,029.9 1,459.6 Opening Balance of Cash
244.0 359.4 193.9 598.6
Finance Costs (1,449.3) (1,405.5) (1,484.0) (772.4) and Bank Balances
Other Income 113.3 136.4 85.9 71.2
Closing Balance of Cash
Share of profit from JV 2.5 4.0 (0.2) 0.8 360.4 193.1 597.6 310.5
and Bank Balances
Exceptional Items 0.0 0.0 (57.7) 0.0 Financial Ratios
PBT 435.4 1,399.8 573.9 759.3 Particulars FY18 FY19 FY20 9MFY21
Growth & Margin rations
Tax Expenses (120.1) (426.2) (163.2) (252.7)
Revenue Growth Rate (%) 20.3% -17.9%
PAT 315.3 973.7 410.7 506.6 EBITDA Growth Rate (%) 35.8% -10.1%
EBITDA Margin (%) 21.6% 24.3% 26.7% 28.1%
EBIT Growth Rate (%) 50.7% -23.8%
Balance Sheet EBIT Margin (%) 11.7% 14.7% 13.6% 14.3%
Particulars FY18 FY19 FY20 9MFY21 Adjusted PAT Growth Rate (%) 208.8% -57.8%
Reported PAT Margin (%) 2.1% 5.4% 2.8% 5.0%
Share Capital 100.6 100.6 100.6 100.6 Turnover ratios
Reserves and Surplus 5,866.0 6,732.0 7,088.4 7,615.5 Inventories Turnover Ratio (x) 5.0 5.6 4.6 3.0
Trade Receivable Turnover
Net Worth 5,966.6 6,832.6 7,189.0 7,716.1 7.5 8.7 7.7 4.8
Ratio (x)
Long Term Borrowings 5,746.0 8,502.5 7,963.8 7,334.2 Accounts Payable Turnover
4.2 5.5 5.3 3.4
Ratio (x)
Long Term Provisions 6.8 2.1 Fixed Asset Turnover Ratio (x) 1.2 1.2 1.0 0.7
Short Term Borrowings 2,720.9 1,350.1 2,442.7 1,566.9 Total Asset Turnover Ratio (x) 0.8 0.8 0.6 0.5
Working Capital Turnover
Trades Payables 3,627.3 3,312.1 2,817.8 3,016.2 Ratio (x)
-8.8 -13.7 -22.4
Other Liabilities 1,573.0 2,799.8 2,222.1 2,264.4 Operational ratios
Current Ratio (x) 0.8 0.8 0.8 1.0
Short Term Provisions 40.9 51.5 18.3 28.7
Debt to Equity (x) 1.4 1.4 1.4 1.2
Deferred tax liabilities (Net) 319.7 405.4 370.9 534.3 Total Debt (Rs.) 8,466.8 9,852.6 10,406.5 1,148.25
Net Debt (Rs.) 7,980.1 9,586.8 9,690.1 8,379.4
Other liabilities 0.0 0.0 0.0 0.0
Net Debt to EBITDA (x) 2.4 2.2 2.4 2.9
Total Liabilities 19,994.3 23,254.0 23,031.4 22,462.9 Net Debt to Equity (x) 1.3 1.4 1.3 1.1
Return ratios
RoE (%) 5.3% 14.3% 5.7% 7.3%
Tangible Assets 12,447.4 14,764.5 14,267.0 14,130.7 RoA (%) 1.6% 4.2% 1.8% 2.8%
Intangible Assets 149.6 143.4 106.3 78.7 RoCE (%) 15.1% 17.4% 13.4% 9.7%
RoIC (%) 11.8% 12.9% 10.4% 6.8%
Capital Work In Progress 243.1 906.1 888.2 274.3 EV 39,580.8 41,138.8 41,290.1 40,071.8
Non-current tax assets (net) 44.4 0.0 11.0 0.0 EV/Sales (x) 2.6 2.3 2.8 3.9
EV/EBIDTA (x) 12.1 9.3 10.4 13.9
Other Non Current Assets 1,113.3 1,329.1 1,479.3 1,198.2 Per share ratios
Inventories 3,004.6 3,233.1 3,256.2 3,399.2 EPS 14.9 46.1 19.4 24.0
BVPS 282.4 323.4 340.3 365.2
Trade Receivables 2,016.9 2,100.3 1,943.2 2,142.0 OCF/sh 133.8 170.4 144.5 114.6
Cash and Bank Balances 367.2 195.0 597.6 310.5 FCF/sh 0.0 312.8 217.6 82.7
Valuation ratios
Other bank balances 119.6 70.8 118.8 211.2 P/E (x) 99.8 32.3 76.6 46.6
Other Current Assets 463.4 488.0 349.9 715.1 P/BVPS (x) 5.3 4.6 4.4 3.4
P/S (x) 2.1 1.7 2.1 2.3
Total Assets 19,994.3 23,254.0 23,031.4 22,462.9
EV/EBITDA (x) 12.1 9.3 10.4 13.3
Source: Choice Broking Research, RHP
© CHOICE INSTITUTIONAL RESEARCHEquity Research Team
Name Designation Email id
Sundar Sanmukhanis Head of Research - Fundamental sanmukhanis@choiceindia.com
Satish Kumar Research Analyst satish.kumar@choiceindia.com
Rajnath Yadav Research Analyst rajnath.yadav@choiceindia.com
Ankit Pareek Research Associate ankit.pareek@choiceindia.com
Yug Tibrewal Research Intern yug.tibrewal@choiceindia.com
Disclaimer
es
This is solely for information of clients of Choice Broking and does not construe to be an investment advice. It is also not intended as an offer or solicitation
for the purchase and sale of any financial instruments. Any action taken by you on the basis of the information contained herein is your responsibility alone
and Choice Broking its subsidiaries or its employees or associates will not be liable in any manner for the consequences of such action taken by you. We have
exercised due diligence in checking the correctness and authenticity of the information contained in this recommendation, but Choice Broking or any of its
subsidiaries or associates or employees shall not be in any way responsible for any loss or damage that may arise to any person from any inadvertent error in
the information contained in this recommendation or any action taken on basis of this information. This report is based on the fundamental analysis with a
view to forecast future price. The Research analysts for this report certifies that all of the views expressed in this report accurately reflect his or her personal
views about the subject company or companies and its or their securities, and no part of his or her compensation was, is or will be, directly or indirectly
related to specific recommendations or views expressed in this report. Choice Broking has based this document on information obtained from sources it
believes to be reliable but which it has not independently verified; Choice Broking makes no guarantee, representation or warranty and accepts no
responsibility or liability as to its accuracy or completeness. The opinions contained within the report are based upon publicly available information at the
time of publication and are subject to change without notice. The information and any disclosures provided herein are in summary form and have been
prepared for informational purposes. The recommendations and suggested price levels are intended purely for stock market investment purposes. The
recommendations are valid for the day of the report and will remain valid till the target period. The information and any disclosures provided herein may be
considered confidential. Any use, distribution, modification, copying, forwarding or disclosure by any person is strictly prohibited. The information and any
disclosures provided herein do not constitute a solicitation or offer to purchase or sell any security or other financial product or instrument. The current
performance may be unaudited. Past performance does not guarantee future returns. There can be no assurance that investments will achieve any targeted
rates of return, and there is no guarantee against the loss of your entire investment.
POTENTIAL CONFLICT OF INTEREST DISCLOSURE (as on date of report) Disclosure of interest statement – • Analyst interest of the stock /Instrument(s): - No. •
Firm interest of the stock / Instrument (s): - No.
CONNECT US Choice Equity Broking Pvt. Ltd.
Choice House, Shree Shakambhari Corporate Park, Plt No: -156-158,
Any kind of queries on RESEARCH, J.B. Nagar, Andheri (East), Mumbai - 400 099.
You can contact us on: 022 - 6707 9999 +91-022-6707 9999
+91-022-6707 9959
www.choiceindia.com
© CHOICE INSTITUTIONAL RESEARCH
9You can also read