TOA PAINT (THAILAND) PUBLIC COMPANY LIMITED - OPPORTUNITY DAY Q3/2017 - Set
←
→
Page content transcription
If your browser does not render page correctly, please read the page content below

TOA PAINT
(THAILAND) PUBLIC
 COMPANY LIMITED
    OPPORTUNITY DAY Q3/2017
                December 12, 2017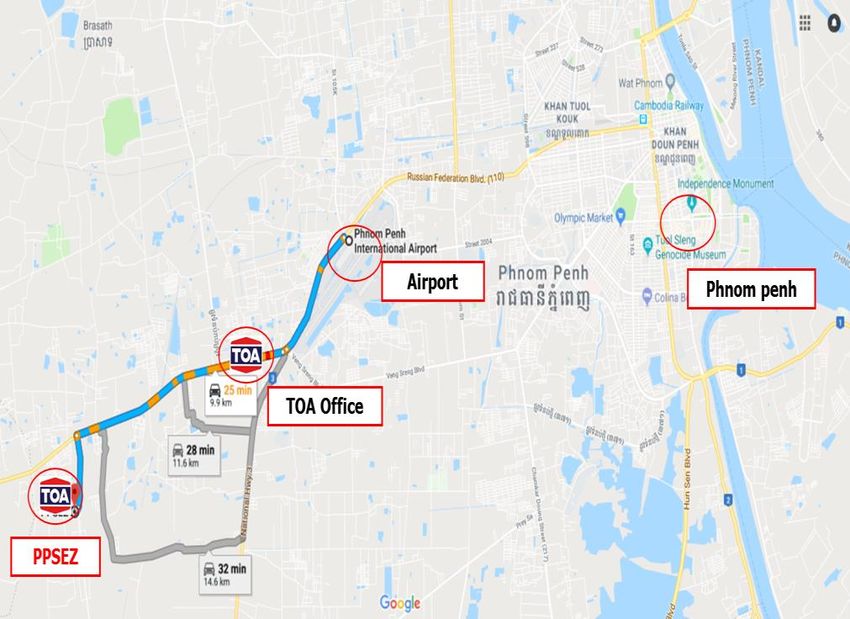
DISCLAIMER
IMPORTANT: You must read the following before continuing. The following applies to this document, the oral presentation of the information in this document by TOA Paint (Thailand) Public Company Limited
(the “Company”) or any person on behalf of the Company, and any question-and-answer session that follows the oral presentation (collectively, the “Information”). In accessing the Information, you agree to
be bound by the following terms and conditions, you represent that you are outside the United States, and if applicable, you consent to delivery of the attached document by electronic transmission.

The information contained in this presentation is intended solely for your reference.

This presentation contains “forward-looking statements”, which are based on current expectations and projections about future events, and include all statements other than statements of historical facts,
including, without limitation, any statements preceded by, followed by or that include the words “targets”, “believes”, “expects”, “aims”, “intends”, “will”, “may”, “anticipates”, “would”, “plans”, “could”,
“should”, “predicts”, “projects”, “estimates”, “foresees”, “seek” or similar expressions or the negative thereof, as well as predictions, projections and forecasts of the economy or economic trends of the
markets and the Company’s industry, which are not necessarily indicative of the future or likely performance of the Company or its industry, and projections and forecasts of their performance, which are not
guaranteed. Such forward-looking statements, as well as those included in any other material discussed at the oral presentation or in this document, concern future circumstances and results and involve
known and unknown risks, uncertainties and other important factors beyond the Company’s control that could cause its actual results, performance or achievements to be materially different from future
results, performance or achievements expressed or implied by such forward-looking statements. Such forward-looking statements are based on numerous assumptions and estimates regarding the
Company’s present and future business strategies and the environment in which it will operate in the future. Forward-looking statements are not guarantees of future performance. These forward-looking
statements speak only as at the date of this document, and the Company does not undertakes any obligation or undertakes to supplement, amend, update or revise any forward-looking statements as a result
of new information or to reflect future events or circumstances, or otherwise.

The Company makes no representation, warranty or prediction that the results anticipated by such forward-looking statements will be achieved, and such forward-looking statements represent, in each case,
only one if many possible scenarios and should not be viewed as the most likely or standard scenario. No assurance given that future events will occur or our assumptions are correct. Actual results may
materially differ from those provided in the forward-looking statements and indications of past performance are not indications of future performance. In no event shall the Company be responsible or liable
for the correctness of any such material or for any damage or lost opportunities resulting from use of this material. The Company makes no representation whatsoever about the opinion or statements of any
analyst or other third party. The Company does not monitor or control the content of third party opinions or statements and does not endorse or accept any responsibility for the content or use of any such
opinion or statement.

The Information contains certain non-GAAP measures, including EBITDA, that are not audited, not included in the Company’s audited financial statements and not presented in accordance with Thai Financial
Reporting Standards. The measures have been used by management as a supplemental measure of the Company’s performance. Although these measures are either contained in or fully reconcilable to line
items on the Company’s audited financial statements and/or based on management accounts, they may not be equivalent to similarly named measures used by other companies, and should not be considered
as a measure comparable to income statement items for the relevant period in the financial statements.

The information set out herein is subject to change without notice, its accuracy is not guaranteed, has not been independently verified and it may not contain all material information concerning the Company.

The Information also contains certain statistical data and analyses (the “Statistical Information”) which have been prepared in reliance upon information furnished by the Company and/or third party sources
for which the Company has either obtained or is in the process of obtaining the necessary consents for use. Numerous assumptions were used in preparing the Statistical Information, which assumptions may
or may not appear herein. As such, no assurance can be given as to the Statistical Information’s accuracy, appropriateness or completeness in any particular context, nor as to whether the Statistical
Information and/or the assumptions upon which they are based reflect present market conditions or future market performance. Moreover, any information from third party sources contained in the
Information may not be used or relied upon by any other party, or for any other purpose, and may not, directly or indirectly, be reproduced, disseminated or quoted without the prior written consent of such
third party. The Information does not purport to be a complete description of the terms of or the risks inherent in any actual or proposed transaction described herein.

The Company’s securities have not been and will not be registered under the U.S. Securities Act of 1933, as amended, or the securities laws of any state of the United States, and may not be offered or sold
within the United States, except pursuant to an exemption from, or in a transaction not subject to, the registration requirements of such act or such laws.

This presentation does not constitute an offer to sell or a solicitation of an offer to buy or sell the Company’s securities in any jurisdiction.

                                                                                                           1
AGENDA OUTLINE
1MARKET OVERVIEW
1FINANCIAL SUMMARY
3 INDUSTRY OUTLOOK
2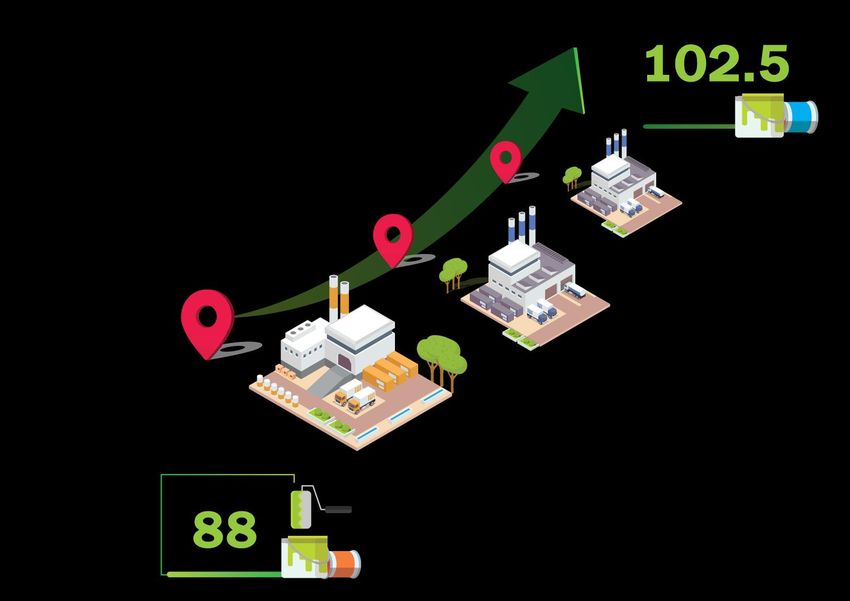
MARKET
OVERVIEW

OUR BUSINESS

  Product segments                               Geographical reach in AEC               Distribution channels
  Breakdown of revenue by product                Breakdown of revenue by geography,      Breakdown of revenue by distribution
  segments, 9M2017                               9M2017                                  channel, 9M2017

                      Others                                       Others                              Others
                     THB0.5bn                                     THB0.6bn                            THB1.4bn
                       3.6%                             Vietnam     5.3%
                                Non-decorative                                                         11.6%
                                                       THB0.8bn
                                  THB3.2bn
                                                         7.0%
                                   28.1%                                                  Modern
                                                                                           trade
                                                                                         THB1.7bn
                                                                                          15.1%

      Decorative
      THB7.8bn                                                                Thailand                                  Retail dealers
       68.3%                                                                 THB10.1bn                                   THB8.4bn
                                                                               87.7%                                       73.3%

                                                 9M2017 revenue: THB11.5bn

Source:   Company information

                                                                     4
UNPARALLELED NATIONWIDE DISTRIBUTION AND RETAIL
DEALER NETWORK…
TOA has a comparative advantage with its extensive distribution coverage coupled with unique Auto
Tinting Machines
Key industry trends and
TOA's response
challenges Maximum product
reach to end users
1 Retail dealer sales is the
dominant distribution
channel, derived mainly from
Bangkok and nearby vicinity 6,367 Strong retail-dealer
Extensive retail dealers1
Unique TOA 4,1911
Auto Tinting resistance to non-
coverage 77 provinces1,2 Machines TOA brands
2 Low population density 790 districts1,2
Comparative
Supply chain and logistic Advantage
3 challenges
SAP Strong brand
Retail dealer preference for
4 Product In-store and ERP and Business awareness and fierce
established brands Technology
consultants modern trade Intelligence customer loyalty
systems
Rise of modern trade
5 distribution Ability to respond to
consumer trends
Sources: Frost & Sullivan, Company information, Department of Provincial Administration, The Ministry of Interior (March 31, 2017)
Notes:
1 As at September 30, 2017 in Thailand
2 Out of 77 provinces and 790 districts in Thailand
5
REINFORCED BY OUR UNIQUE TOA COLOR WORLD SOLUTION
SERVICES

                                                                   Increasing usage of our Auto
                                                                   Tinting Machines by retail dealers and
                                    >10,000                        modern trade distributors…
                                different shade
                                   variations

                                                                        No. of Auto Tinting Machines

                                                     Reduced
     Enhanced                                                                                                    5,966
                                                    inventory
   customisation                                                                            5,693
                                                  carrying costs
                                                                       4,947
                                                                                                                 1,775
                                                                                            1,687
                                                                       1,442

                                Premiumisation                                              4,006                4,191
                                                                       3,505

                                                                       2014                 2016                 9M17
                                                                                 Thailand    Other AEC markets
Source:   Company information

                                                           6
FINANCIAL
SUMMARY
KEY FINANCIAL METRICS
Increasing diversification in all aspects of geography and products
Sales (THBm)                                                                                                                                                                          2014-2016
                                                                                                   2014                            2016                           9M17
                                                                                                                                                                                        CAGR
         1.8%                 (2.7%)                       (6.0%)                                 Others3                          Others3                        Others3               Thailand
                                                                                          Vietnam 4.1%                             4.8%                   Vietnam 5.3%
16,449            16,753                                                                  6.6%
                                                                                                                         Vietnam
                                                                                                                                                          7.0%
                                                                                                                                                                                         (1.7%)
                                  16,297                                                                                 8.2%
                                                           (2.8%)

                                                                                                                                                                                                       Geography
                                                                                                                                                                                         Vietnam
                                                                                                                                                                                          10.8%
                                                  12,189
                                                                    11,458
                                                                                                   Thailand                        Thailand                        Thailand              Others
                                                                                                   89.3%                           87.0%                           87.7%                 7.5%

                                                                                         Other business products4               Other business products4   Other business products4    Decorative
                                                                                         5.0%                          Non-     3.1%                       3.6%                          0.1%
                                                                                                                                                      Non-
                                                                                                                       decorative                     decorative
                                                                                 Non-                                  27.4%                          28.1%
                                                                                 decorative

                                                                                                                                                                                                       Product
                                                                                 26.2%                                                                                                    Non-
                                                                                              -
                                                   3,848            3,740                                                                                                               decorative
                                                                                                                                                                                          1.6%

                                                                                                   Decorative                      Decorative                     Decorative          Other business
  2014   1
                   2015   1
                                   2016   1
                                                 9M2016    2
                                                                    9M2017   2                     68.8%                           69.5%                          68.3%                  products
                                                                                                                                                                                         (21.3%)
                YoY growth (%)          Year       3Q          9M
Source:     Company information
Notes:
1    Carve-out Financial Statements
2    Statutory Financial Statements
3    Other countries mainly comprise sales revenue from customers in Laos, Malaysia, Indonesia, Myanmar and Cambodia
4    Other products sold to the Divested companies and related companies e.g. raw materials

                                                                                                       8
KEY FINANCIAL METRICS
We have shown strong profitable growth over the past few years driven by our strong brand and products. In
9M2017, margins decreased as a result of higher average raw materials prices

Gross profit (THBm) and margin (%)

                                          20.2%              3.7%                          (16.5%)                         (15.4 %)

                     7,000                                                                                                                         110.0%
                                                                        6,203
                                                  5,979                                                                                            100.0%
                     6,000

                                                                                                                                                   90.0%
                                      4,976
                     5,000                                                         4,696
                                                                                                                                                   80.0%
                                                                                                       3,922
                     4,000                                                                                                                         70.0%

                     3,000                                                                                                                         60.0%

                                                                                                                                                   50.0%
                     2,000
                                                                       38.1%                                           1,448
                                                  35.7%                                                                                1,225       40.0%
                                      30.3%
                     1,000                                                         38.5%                              37.6%
                                                                                                      34.2%                                        30.0%
                                                                                                                                      32.7%
                          0                                                                                                                        20.0%
                                             1           1                    1             2                  2               2               2
                                      2014        2015                 2016        9M2016            9M2017           3Q2016          3Q2017

                                                                    Gross profit   Margin            YoY growth (%)
Source:     Company information
Notes:
1    Carve-out Financial Statements
2    Statutory Financial Statements

                                                                                   9
KEY FINANCIAL METRICS
We have shown strong profitable growth over the past few years driven by our strong brand and products. In
9M2017, margins decreased as a result of higher average raw materials prices
EBITDA (THBm) and margin (%)
44.0% 11.6% (33.7%) (35.8%)
4,000 110.0%
3,559
100.0%
3,500
3,190
90.0%
3,000 2,795 80.0%
2,500 70.0%
2,216
60.0%
2,000 1,852
50.0%
1,500 40.0%
30.0%
1,000 21.5% 827
18.7%
13.2% 531 20.0%
500 22.6%
21.1%
16.1% 10.0%
14.1%
0 0.0%
2 2
20141
2015 1
2016 1
9M2016 2
9M2017 2
3Q2016 3Q2017
EBITDA Margin YoY growth (%)
Source: Company information
Notes:
1 Carve-out Financial Statements
2 Statutory Financial Statements
10KEY FINANCIAL METRICS
We have shown strong profitable growth over the past few years driven by our strong brand and products. In
9M2017, margins decreased as a result of higher average raw materials prices
Net profit (THBm) and margin (%)
60.3% 18.4% (37.9%) (41.4%)
3,000
80.0%
2,507
2,500
2,117 60.0%
2,000
1,993
1,500
1,321 40.0%
1,237
1,000
15.2% 585 20.0%
12.4%
7.9% 16.1% 343
500
14.9%
10.7% 9.1%
0
0.0%
1 2 2
2014 1
20151
2016 9M2016 2
9M2017 2
3Q2016 3Q2017
Net profit Margin YoY growth (%)
Source: Company information
Notes:
1 Carve-out Financial Statements
2 Statutory Financial Statements
11KEY FINANCIAL METRICS (CONT'D)
We have demonstrated exceptional return on asset and equity given our strong business fundamentals
Return on equity3 (%) Return on total assets4 (%)
140.0% 25.0%
22.2%
118.7%
120.0%
20.0%
100.0% 93.4% 16.5% 17.1%
15.0%
80.0%
10.5%
60.0%
50.9% 10.0%
40.0% 35.4%
5.0%
20.0%
0.0% 0.0%
1 1 1 1 1
2014 2015 2016 9M2017 2,5
2014 2015 2016
1
9M2017
2,5
Source: Company information
Notes:
1 Carve-out Financial Statements
2 Statutory Financial Statements
3 Return on equity is calculated as net profit divided by average shareholders’ equity. Average shareholders’ equity is calculated by averaging the
opening and closing balance sheet figures
4 Return on total assets is calculated as net profit divided by average total assets. Average total assets is calculated by averaging the opening and
closing balance sheet figures.
5 Ratios are calculated using annualized net profit
12CAPITAL EXPENDITURES
(THBm)
500
450
400
350
300
250
459
435
200
150
245 241
100 214
50
0
2014 2015 2016 9M2016 9M2017
Source: Company information
13FINANCIAL HIGHLIGHTS
1• 9M2017 sales revenue declined 6.0% y-o-y due to a decrease in sales of decorative paint products from
reduced volumes of medium to economy grade products and non-decorative paint and coating products as
a result of the economic slowdown continuing from 2016 and one-off Vietnam VAT registration
requirements during the first quarter of 2017
2• EBITDA margins decreased from 22.6% in 9M2016 to 16.1% in 9M2017 as a result of a decrease in sales
revenue, as well as the increase in raw material costs. We continue to monitor the situation and are
considering passing increased raw materials cost to customers
3• TOA continues to deliver superior ROE and ROA of 118.7% and 17.1% in 9M2017, with robust balance
sheet position
4• Cash & cash equivalent of 1,437.3 MB as at September 30, 2017, compared to 1,713.4 MB at the end of
2016. As at September 30, 2017, total assets has not materially changed
5• Total liabilities of 7,701.4 MB as at September 30, 2017, a decrease of 1,165 MB was mainly attributable to
the decrease in dividend payables, long-term loans from financial institutions, and income tax payables
14INDUSTRY OUTLOOK
OUTLOOK OF THAI ECONOMY AND CONSTRUCTION MARKET
While recent GDP growth has been impacted by domestic and international political uncertainty, a recovery in
the economy and construction market is expected from a number of positives
           Increase in public        Social unrest followed by      Brexit, US withdrawal from Trans-
                                          military intervention    Pacific Partnership and the passing
        spending, household
            consumption and            adversely impacted the       of Thailand's monarch contributed                Greater                   Increased
      investments drove the       inflow of investments, state       to volatility, but was alleviated by            private                   public
                 rise in GDP            spending and tourism          improved economic performance                  consumption               investments

                                                                                                                              Reduced                        Higher
Economy impacted by two                   Political and               Public spending and                                     income taxes                   tourist arrivals
natural disasters – strong                social unrest               tax cuts stimulated
Tohoku earthquake disrupted               dampened                    growth albeit the
the supply chains of Thai-based           public spending             droughts caused by
Japanese manufacturers in                 and household               El-Nino
March and severe flooding in              consumption
second half of the year resulted          growth rates
in over THB400bn losses

                          9.3%

                                                                                                             5.4%                                      5.4%               5.6%
                                                                                                                          5.0%          5.2%
                                            4.5%                                              4.2%
      4.6%                                                                                                               15,597
                                                                           13,537                           14,861                     16,408         17,295            18,265
                                                                                             14,106
                         12,349         12,901           13,132
    11,300                                                                   3.1%
                                                          1.8%

      2011                2012           2013               2014         2015        2016                    2017F        2018F        2019F           2020F             2021F
                                                                    Nominal GDP (THBbn)                     YoY growth

Source:      Frost & Sullivan

                                                                                               16
OVERVIEW OF THAI ECONOMY AND CONSTRUCTION MARKET
Thailand’s economy and construction market is underpinned by strong fundamentals with socio-economic
factors providing tremendous opportunity for growth in the paints and coatings industry
Rising GDP per capita and stable inflation
3.0%
2.2% 2.1% 2.2% 2.5%
3.8% 1.9% 1.6% 1.9%
197 204 237 250 263
167 182 189 225
191 215
(0.9%)
0.3%
2011 2012 2013 2014 2015 2016 2017F 2018F 2019F 2020F 2021F
GDP per capita (THB '000) Inflation
Shrinking household sizes Increasing urbanisation
Distribution of households by size Number of households (m) / % urban households
0.4%
1.9% 1.1% 1.1% 6.6% 29
21.2% 19.1% 17.8%
26.5% 27
41.7%
25
42.5% 41.9%
23 28.6
21 25.2 (21.7%)
66.5% 22.3
19 (21.0%)
34.4% 37.9% 39.4% (20.6%)
17
15
2009 2011 2013 2015 2011 2016 2021F
1–2 persons 3–4 persons 5–7 persons 8 persons or more
Source: Frost & Sullivan
17LARGE POTENTIAL IN INCREASING PAINT CONSUMPTION
Relative to more developed markets, Thailand and other AEC countries have significantly lower per capita
consumption of paints and coatings, demonstrating substantial upside potential
Per capita paints and coatings consumption, litres, 2016
20.0
15.0
AEC
10.5
10.0 APAC developed country average: 9.7
9.0
8.0
6.0
APAC overall average: 4.7
3.0
1.5 1.5
1.0
Norway Singapore Japan USA Malaysia Thailand Indonesia Vietnam Cambodia Laos Myanmar
Source: Frost & Sullivan
18THAI DECORATIVE PAINTS AND COATINGS MARKET
OVERVIEW
Market's promising growth underpinned by favourable socio-economic factors. Competitive landscape
dominated by top player TOA
Retail decorative paints and coatings market size Channels
and forecast TOA's predominant channel in Thailand
(THBbn) Retail
Sale of products through retail dealers nationwide
Main distribution channel of foreign manufacturers
Shorter Increased Occurs through large chain stores such as Homeworks, HomePro and
repainting cycles housing stock Modern
Thai Watsadu
trade
Catalyzes retail consumers' awareness and participation in the
Shift painting process
towards premium decorative Large-scale projects for the government, property developers, and
Projects
paints and coatings real estate companies
&
exports Wholesale export globally
Competitive landscape
Others
10.9%
Nippon
5.2%
Jotun Dominated by TOA1
24.6 8.1%
Most other players inclined
19.2
48.7% towards industrial paints and
13.7 Beger
13.3% coatings manufacturing
Akzo Nobel
2011 2016 2021F 13.8%
Source: Frost & Sullivan
Note:
1 According to Frost & Sullivan by market share for year 2016
19THAI NON-DECORATIVE PAINTS AND COATINGS MARKET
OVERVIEW
Growth in the non-decorative paints and coatings market is expected to accelerate from increased
consumption, industrialisation and tourism
Retail non-decorative paints and coatings market Channels
size and forecast
(THBbn) Retail and
Main distribution channel for TOA's non-decorative products
modern
trade Less prevalent compared to other distribution channels
Increased Increased
Renovation and FDI inflows from Direct sales to Original Equipment Manufacturers ("OEM"), such as
repainting activities industralisation furniture and construction material manufacturers, is the most prevalent
OEM
distribution method2
Increased TOA does not distribute its products through this channel
consumer awareness about
housing structure protection Projects Procured directly from manufacturers by contractors and developers
Competitive landscape1
Wood Waterproofing Protective coating
2.2 Others Beger Jotun
Sika Others
39.0% 32.8% Others 30.0%
42.0% 28.0% 42.0%
1.5 1.4
1.0 1.0
0.8 Parex
5.2 Group
3.9 28.2% 10.0% 20.0%
3.0 28.0%
2011 2016 2021F has a sizeable presence and is trailing the market leaders marginally
Wood Coatings Waterproofing Protective Coating across all non-decorative paints and coatings segments
Source: Company information, Frost & Sullivan
Note:
1 According to Frost & Sullivan for year 2016
2 TOA does not distribute its products through this channel
20OTHER AEC MARKETS OVERVIEW — VIETNAM
Vietnam's fast developing economy is expected to drive its paints and coatings industry, underpinned by
increasing consumer spending, a growing construction sector, furniture export and public spending
Decorative -
Non-decorative
Increased Increased Increased
Retail market size and
construction activity wood furniture manufacturing activity housing constructions and development
Wood Waterproofing Protective coating
forecast1
(THBbn) (THBbn)
15.6 1.9 1.7 0.3
9.7 1.0 1.3 1.2 0.2
6.3 0.8 0.2
2011 2016 2021F 2011 2016 2021F 2011 2016 2021F 2011 2016 2021F
4 Oranges Others Others
Oseven Kova
23.0% 25.0% 5.0%
Competitive landscape2
Others Others 45.0% 49.0%
Hai Jotun
32.2% 22.0%
Phong 50.0%
5.0%
6.0%
Akzo Nobel 8.0%
18.0% Jotun
Jotun Akzo Nobel 10.0% Akzo Nobel
8.0% Nippon 10.0% 40.0%
9.8% Adora Akzo Nobel
9.0%
15.0% 10.0%
Retail sales are approximately 50.0%-60.0% Highest sales of Retail channel Limited presence of retail
Channels
of total decorative paints and coatings sales 15.0%-20.0% through accounts for 10.0%- dealers
the retail channel 20.0% of total
95.0% of sales are project
waterproofing sales
sales through channel partners
Sources: Frost & Sullivan, Bloomberg as at June 26, 2017
Notes: 1. Illustrative figures based on USDVND exchange rate of 1:22,730 and USDTHB exchange rate of 1:33.980 as at June 26, 2017
2. According to Frost & Sullivan for year 2016
21OTHER AEC MARKETS OVERVIEW
The combined retail decorative paint and coating market of TOA's other AEC markets1 is expected to grow by a
5-year CAGR of 7.7%, driven by increasing urbanisation, economic reforms, infrastructure spending and rising
disposable income
Indonesia Myanmar Cambodia Laos Malaysia
Increased Increased Increased Increased Growing
urbanisation political instability rural household construction activity construction sector
income
Retail market size and forecast2
Increased Reduced Increased
disposable income speed in developing
import taxation
commercial property
(THBbn) (THBbn) (THBbn) (THBbn) (THBbn)
41.0 1.6 1.3 15.6
1.2 0.8 1.0 0.6 0.7 12.1
26.7 0.8 0.5 9.5
18.8
2011 2016 2021F 2011 2016 2021F 2011 2016 2021F 2011 2016 2021F 2011 2016 2021F
1 1 1 1 1 1 1
Production
plants
under construction operational under COD in Q3 under operational operational
construction 2017 construction
Competitive
landscape
Sources: Frost & Sullivan, Bloomberg as at June 26, 2017
Notes:
1 Comprising Indonesia, Malaysia, Myanmar, Cambodia and Laos
2 Illustrative figures based on USDTHB exchange rate of 1:33.980 as at June 26, 2017
22FUTURE PROJECTS
Myanmar
To be operated by TOA Coating (Myanmar) Co., Ltd.
Cambodia
Indonesia
To be operated by PT TOA Coating Indonesia
Estimated CAPEX Expected start Estimated
Country Location Ownership Objectives
(THBm) construction completion
Indonesia Kawasan Industri Millenium, Freehold 670.0 Production plant Q2 2017 Q2 2018
Kabupaten Tangerang, Propinsi
Banten
Myanmar Thilawa Special Economic Zone Leasehold right (until Jun 4, 2064 312.0 Production plant Q3 2017 Q3 2018
with option to extend another 25 (Relocate from existing
years) Yangon Plant)
Cambodia Phnom Penh Special Economic Leasehold right (until December 8, 254.11 Production plant Q1 2018 Q4 2018
Zone 2067 with option to extend another
50 years)
Total 1,236.1
Source: Company information
Note:
1 According to the resolution of the Board of Directors’ meeting No.9/2017 held on December 4, 2017
23FUTURE PROJECTS (CONT’D)
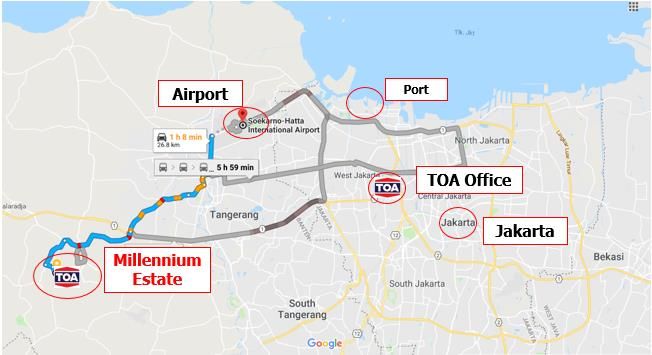
Indonesia
To be operated by PT TOA Coating Indonesia
Capacity Estimated Estimated
7.7 m Capex Completion
Gallons 670.0 THBm Q2 2018
Distance
Est. 50 KMs from TOA Factory (Millennium Estate) to TOA Office (Jakarta)
Travel time around 75 min.
Est. 30 KMs from Millennium Estate to Airport
Travel time around 45 min.
Source: Company information
24FUTURE PROJECTS (CONT’D)
Myanmar
To be operated by TOA Coating (Myanmar) Co., Ltd. Capacity Estimated Estimated
4.0 m Capex Completion
Gallons 312.0 THBm Q3 2018
Distance
Est. 35 KMs from TOA Factory (Thilawa estate) to TOA Office (Yangon)
Travel time around 1 hour
Est. 45 KMs from Thilawa estate to Airport
Travel time around 1.30 hours
Source: Company information
25FUTURE PROJECTS (CONT’D)
Cambodia
Capacity
3.4 m
Gallons
Estimated
Capex
254.1 THBm1
Estimated Distance
Est. 18 KMs from TOA Factory (PPSEZ estate) to Phnom Penh City
Completion
Travel time around 1 hour
Q4 2018 Est. 10 KMs from TOA Factory (PPSEZ estate) to Airport
Travel time around 30 min.
Est. 5 KMs from TOA Factory (PPSEZ estate) to TOA Office (Phnom Penh)
Travel time around 15 min.
Source: Company information
Note:
1 According to the resolution of the Board of Directors’ meeting No.9/2017 held on December 4, 2017
26FUTURE PROJECTS (CONT’D)
3
Million Gallons per year
New production plant
in Cambodia
New production plant
in Myanmar2
New production plant
in Indonesia
Total production capacity1
Million Gallons per year
Source: Company information
Note:
1 Excludes production capacity of TOA Skim Coat (Cambodia) Co., Ltd.
2 Relocate from Yangon to Thilawa Special Economic Zone
3 Total production capacity post taking into account the planned shutdown of existing Yangon Plant
27Q&A
You can also read