FY20 - Earnings Update - a passion for healing - Max Hospital
←
→
Page content transcription
If your browser does not render page correctly, please read the page content below

BLK: Founded in 1959, Collaborated in 2009                   NANAVATI: Founded in 1950, Collaborated in 2014

                                                                                                        a passion for healing…

                                                     FY20 – Earnings Update
                                                                    July 23, 2020

Private &Private & Confidential
          Confidential                                                                                                                1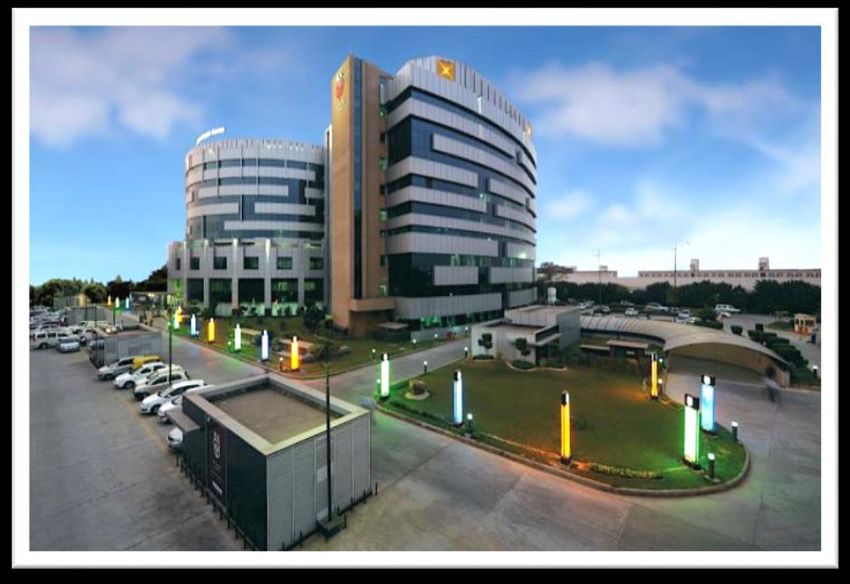
Disclaimer

 The information in this release has been included in good faith and is meant for general purposes only. Such information is based on the management’s perception of
 business, market conditions and overall growth potential by the relevant parties. This information is disseminated generally and not addressed to any person or party or
 for any purpose specific or otherwise. It should not be relied upon for any specific purpose and no representation or warranty is given as regards to its accuracy or
 completeness. No information in this release shall constitute an invitation to invest in any of the entities referenced in this announcement or their affiliates. None of the
 parties referenced in this announcement (including their affiliates) nor their officers, employees or agents shall be liable for any loss, damage or expense arising out of any
 action taken on the basis of this release, including, without limitation, any loss of opportunity, profit, indirect, incidental or consequential loss or any actions undertaken
 based on information provided in this release. Figures presented may have been regrouped where required for ease of comparison

 Certain statements in this release are forward-looking statements, which involve a number of risks, uncertainties, assumptions and other factors that could cause actual
 results to differ materially from those in such forward-looking statements. All statements, other than statements of historical fact are statements that could be deemed
 forward looking statements. The risks and uncertainties relating to these statements include, but are not limited to, risks and uncertainties regarding impact of pending
 regulatory proceedings, non – completion of conditions agreed between parties to the transaction, approval for the merger not being obtained, ability to recognize the
 anticipated benefits of the merger including potential growth and business synergies, fluctuations in earnings, dependency on good monsoons and other climatic
 conditions, fluctuations in foreign currencies ability of each of the relevant parties to manage growth, intense competition in the business any other business and
 corporate actions. There can be no assurance that the forward looking statements made herein will prove to be accurate, and issuance of such forward looking statements
 should not be regarded as a direct or indirect, express or implied, representation or warranty of any nature whatsoever by any of the relevant parties, or any other
 person, that the objective and plans envisaged by the parties hereto will be achieved. All forward looking statements made herein are based on information presently
 available to the management of the relevant entities set out herein and they do not undertake or are in anyway obliged to update any forward-looking statement that
 may be made from time to time by or on behalf of each of the entities or the proposed transaction.

 This presentation should not, nor should anything contained in it, form the basis of, or be relied upon in any connection with any contract or commitment whatsoever.
 This presentation is not intended to be a prospectus (as defined under the Companies Act, 2013, as amended) or an offer document under the Securities and Exchange
 Board of India (Issue of Capital and Disclosure Requirements) Regulations, 2018, as amended.

Private &Private & Confidential
          Confidential                                                                                                                                                             2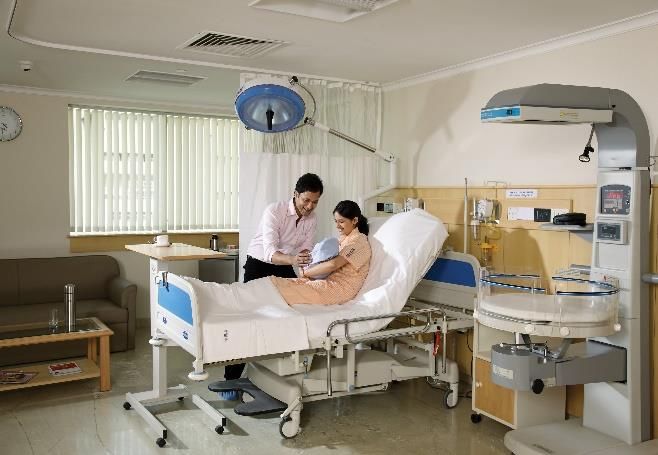
Contents

            About the company                      4

            Financial and Operational Highlights   9

             Covid-19: Response and contribution   17

             Scheme Update                         19

            Appendix

            - Overview of BLK Hospital             23

            - Overview of Nanavati Hospital        30

Private &Private & Confidential
          Confidential                                  3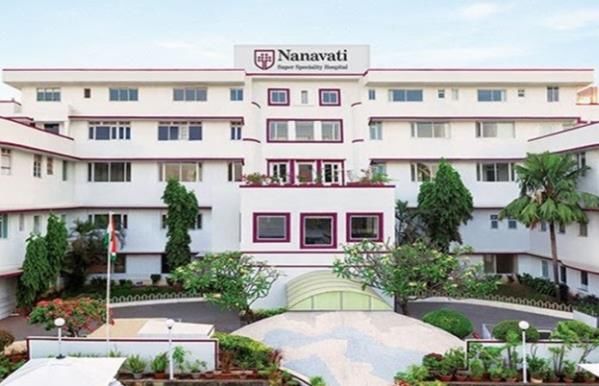
About the Company

Private &Private & Confidential
          Confidential            4
One Of The Fastest Growing Metro Focused Quaternary Care
Service Provider
Promoted by Abhay Soi, having in-depth experience in turning around hospitals
Business of developing & operating high-end quaternary care facilities since 2009
Meaningful presence in Delhi & Mumbai, the most attractive healthcare markets in India
Background Long-term collaboration through Operations & Management arrangements with two iconic
hospitals:
— BLK Hospital, Delhi - 650 beds with ~540 census beds
— Nanavati Hospital, Mumbai - 350 beds with ~328 census beds
Backed by KKR, Private equity fund of global repute
Established clinical programs with 50+ clinical programs under one roof
Largest & fastest growing Bone Marrow Transplant program outside N. America in a single CNBC TV 18 Best Multi-speciality Hospital in
Focus on Clinical facility Metro Award for BLK in 2018
Excellence
Amongst India’s most comprehensive cancer care programs, both at Delhi and Mumbai
Best Multi-speciality Hospital North Award,
Well established program for cardiac care, bone marrow, heart, kidney and liver transplant
2019- 20, by ET Healthworld
JCI, NABH, NABL accreditations
Trusted Hospital (Delhi & NCR) Award at
Independent board of directors India Today Health Summit, 2018 (Readers’
Strong Digest)
Team Experienced management team with deep expertise in healthcare
Leading team of ~1,200 doctors (including visiting consultants) across 2 hospitals AHPI Award for Quality Beyond
Accreditation for three consecutive years -
Track record of value creation 2017, 2018 and 2019
— BLK – Revenue CAGR of 37% from FY10 to FY20 and EBITDA CAGR of 46% from FY13 to AHPI Award for Best Hospital to work for -
Strong Financial FY20 respectively 2016
Performance(1) — Nanavati – Revenue CAGR of 19% from FY15 to FY20; FY20 EBITDA of 6.3% compared to
negative (15%) EBITDA in FY15 prior to assuming operations ICWAI award for excellence in cost
management – 2017
Well capitalized
Large medical tourism business – Treated over 20,000 international patients post FY15
Note: 1. Revenue and Normalized EBITDA from I-GAAP/ IND AS FS | Does not include corporate overheads
Private &Private & Confidential
Confidential 5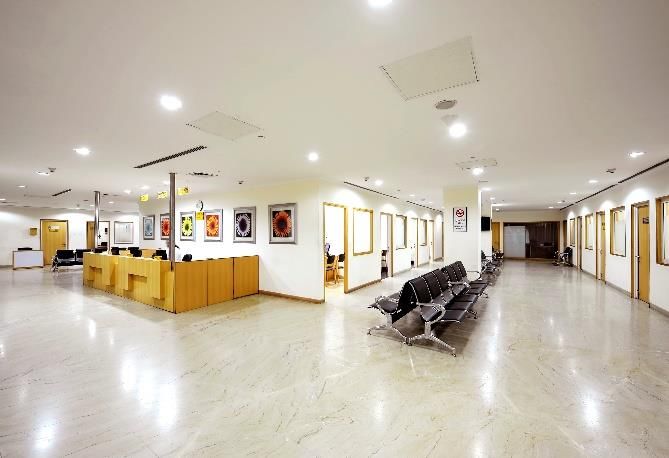
Snapshot

                                                                                                    Capacity
                                  Facilities                               2                         beds
                                                                                                                               ~1,000

                                     # of                                                           ARPOB(1)
                                                                       ~1,200                      (INR/OBD)
                                                                                                                                52k
                                  Physicians

                                                                                                    IPD & day
                                    OPD
                                                                       ~5 lacs                        care                     1 Lac+
                                  Consults                                                         Procedures

                                     IPD                                                            Covid-19
                                                                          70%                        Beds
                                                                                                                                300+
                                  Occupancy

  Note: 1. ARPOB is calculated as Gross Revenue / Total OBD | Abovementioned numbers are for the year ended March 31, 2020 |
Private &Private & Confidential
          Confidential                                                                                                                  6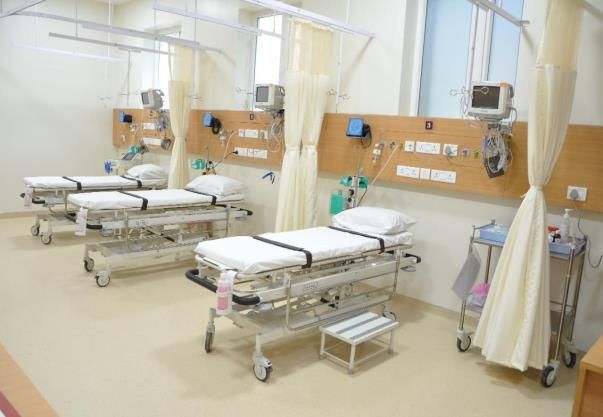
Consistent Growth to leadership…
BLK – Net Revenue (INR Cr.)
701
+37%
604 Revenue grew at a CAGR of ~37% during
502 521 FY10 to FY20 from INR 31 Cr to INR 701 Cr
448
378
283 Leading healthcare provider in Central Delhi
213
125
31
74 Capacity for expansion by 190 beds
FY10 FY11 FY12 FY13 FY14 FY15 FY16 FY17 FY18 FY19 FY20
Nanavati – Net Revenue (INR Cr.)
Revenue grew at a CAGR of 19% from
commencement of O&M arrangement in
357
+19% 327 FY15 to INR ~357 Cr in FY20
298
240 Turnaround of operations from negative
(15%) EBITDA to ~6.3% margin in FY20
185
150
Brownfield capacity for expansion by 550+
beds
FY15 FY16 FY17 FY18 FY19 FY20
Note: Based on I-GAAP Financials/ MIS. Revenue excludes ‘Other operating income’
Private &Private & Confidential
Confidential 7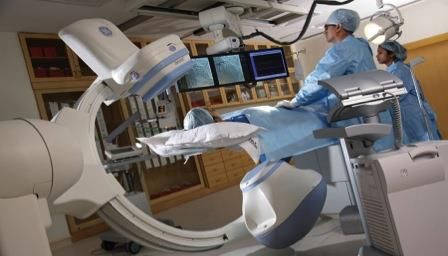
Board of Directors
Founder promoter of Radiant Life Care
Mr. Abhay Soi
Chairman and Managing Co-founded a USD 300 million Special Situations Fund, with investments across sectors
Director Instrumental in setting up financial restructuring business in Andersen and subsequently led the restructuring
services team of E&Y
Successfully turned around BLK and Nanavati and made Radiant among the fastest growing and most efficient
company in the hospital space
BA from St. Stephens, Delhi and MBA from European University, Belgium
Veteran in the field of Corporate Advisory, Corporate Financing and Restructuring space in India.
Mr. Mahendra G Lodha
Director On the boards of several public and private companies including Max Healthcare Institute Limited and Nitrex
Chemicals India Limited.
A qualified Chartered Accountant
CEO and Country Head for Kohlberg Kravis Roberts & Co (KKR) in India.
Mr. Sanjay Nayar
Director On the boards of several portfolio companies of KKR including, Avendus Capital Private Limited, KKR India
Financial Services Limited, KKR India Advisors Private Limited
Prior to KKR, he was the CEO of Citigroup India and South East Asia.
MBA in Finance from the Indian Institute of Management, Ahmedabad and a bachelor in Mechanical Engineering
from Delhi University
Managing Director for Kohlberg Kravis Roberts & Co (KKR) private equity team
Mr. Prashant Kumar
Director Prior to KKR, he was a director and member of the Investment committee at ChrysCapital, and previously with
Warburg Pincus, Karsch Capital Management and Sun Capital
B.Tech. from the Indian Institute of Technology Delhi, post-graduate diploma in management from the Indian
Institute of Management Kolkata, and an M.B.A. from The Wharton School at the University of Pennsylvania
35+ years of experience; Started his business consultancy career with Arthur Anderson
Mr. Narayan K Seshadri
Director Previously worked with KPMG, and is also on the Boards of Magma Fincorp Limited, PI Industries Limited, SBI
Capital Markets Limited and The Clearing Corporation of India Limited
A qualified Chartered Accountant
Private &Private & Confidential
Confidential 8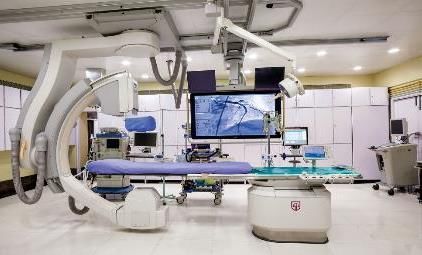
Financial & Operational Highlights

Private &Private & Confidential
          Confidential               9
Radiant Life Care Private Limited
Financial Snapshot
Net Revenue (INR Cr.) EBITDA (INR Cr.)(1)
1,089 154
22
12
15% 17% 31%
928 1,067 21%
118 142
FY19 FY20 FY19 FY20
Actual Revenue Normalization Impact(3) Actual EBITDA Normalization Impact (3)
Gross Revenue
(INR Cr.) FY19 : 999 | FY20 : 1,159 Margin (%)(2) FY19 : 12.7% | FY20 : 13.3% | FY20 (Norm.) : 14.1%
EBITDA per bed (INR lacs) Growth of 15% in FY20 net revenue despite Covid-
19 impact. On a normalized basis, revenue could
25 have been INR 1,089 Cr (17% YoY growth). ARPOB
and occupancy both contributed to growth
2
27% Growth of 21% in FY20 EBITDA. On a normalized
20 18% basis, EBITDA could have been INR 154 Cr (31% YoY
23 growth)
FY20 EBITDA/bed grew from INR 20 lacs to INR 23
lacs. On a normalized basis, EBITDA/bed could have
FY19 FY20 been INR 25 lacs (27% YoY Growth)
Actual EBITDA/Bed Normalization Impact (3)
Note:1. EBITDA based on IND AS financials including IND AS 116 impact. Pre IND AS 116 EBITDA is INR ~135 Cr | 2. EBITDA margin is calculated on Net revenue | 3.
Normalization is based on management estimates
Private &Private & Confidential
Confidential 10Radiant - Improving Operational Metrics (1/2)
ARPOB (INR / OBD) (‘000)(1) Avg. Inpatient Occupancy %
+12.1%
55 +12.5% -8.0%
52 +3.4%
49 71 70
66 68
46
Q4FY19 Q4FY20 FY19 FY20 Q4FY19 Q4FY20 FY19 FY20
ALOS (In days)(2)
ARPOB grew by 12.5% over FY19, while
occupancy grew by 3.4%, primarily driven
-1.0% -1.3% by specialty mix and growth in day care
4.9 4.8 4.8 4.8 procedures
Occupancy dipped in Q4 FY20 due to Covid-
19 impact mainly in the last 2 weeks of
Mar’20
Q4FY19 Q4FY20 FY19 FY20
Note: 1. ARPOB calculated as Gross Revenue / Total OBD
Note 2:. ALOS calculated for discharged IP patients only
Private &Private & Confidential
Confidential 11Radiant - Improving Operational Metrics (2/2)
Inpatient Procedures (‘000) Outpatient Consults (‘000)
+4.8% +17.5%
476
45 47
405
-4.1% -2.1%
11 11 113 111
- - - -
Q4FY19 Q4FY20 FY19 FY20 Q4FY19 Q4FY20 FY19 FY20
Day care Procedures (‘000)
In FY20, IP procedures grew by 4.8% and day care
procedures grew by 17.9% over FY19
+17.9%
56 In FY20, OP consults grew by 17.5% over FY19
48
IP procedures and OP consults dipped in Q4 FY20
+15.5% due to Covid-19 impact in March
13 15
― Over 60% drop in OP consults towards March
end compared to first 2 weeks of the month
Q4FY19 Q4FY20 FY19 FY20
Private &Private & Confidential
Confidential 12Performance Overview (BLK & Nanavati)
Financials (I-GAAP)(1)
Particulars INR Cr.
BLK Hospital(2) Nanavati Hospital
FY19 FY20 FY19 FY20
Net Revenue 604 701 327 357
(-) Direct Costs
Material Costs 158 175 72 71
Clinician Payout 94 101 83 96
Contribution 353 425 172 190
Contribution Margin % 58.4% 60.6% 52.5% 53.1%
(-) Personnel Cost 130 149 103 114
(-) Other Indirect Overheads 113 156 51 54
EBITDA 110 120 18 22
(+) Adjustments for one-time transactions 3 5 - 1
Normalized EBITDA 113 125 18 23
EBITDA Margin % 18.7% 17.8% 5.4% 6.3%
(-) Corporate Overheads 5 7 3 3
EBITDA after Corporate Overheads 108 118 15 20
EBITDA Margin % 17.9% 16.9% 4.6% 5.6%
Note: 1. Based on unaudited I-GAAP financials | 2. BLK also includes performance of Radiation Oncology operated by Radiant
Private &Private & Confidential
Confidential 13Performance Overview Consolidated
(1)
Financials (IND AS)
BLK Hospital(4) Nanavati Hospital Radiant Consolidated(3)
Particulars (INR Cr.)
(2) (2) (2)
FY19 FY20 FY19 FY20 FY19 FY20
Net Revenue (Incl. Other Operating Inc.) 599 709 328 358 928 1,067
(-) Direct Costs
Material Costs 157 174 71 71 228 245
Clinician Payout 125 142 94 105 216 247
Contribution (Excl Non Op Income) 317 394 163 182 484 575
Contribution Margin % 53.0% 55.5% 49.6% 50.8% 52.2% 53.9%
(-) Personnel Cost 103 111 97 104 208 230
(-) Other Indirect Overheads 105 160 66 40 214 246
EBITDA 109 123 -0.3 38 62 99
(+) Adj. for Contingent Consid. (IND AS) 5 6 14 -12 19
Operating EBITDA/ Computed EBITDA 114 129 14 26 81 99
EBITDA Margin % 19.1% 18.1% 4.2% 7.2%
(-) Corporate Overheads 5 7 3 3
(+) Adj. for One time/ Transaction cost 37 43
Adjusted EBITDA 109 122 11 22 118 142
EBITDA Margin % 18.2% 17.2% 3.4% 6.3% 12.7% 13.3%
(+) Non Op Inc. (Incl. Cont consid) (IND AS) 15 41
(-) Finance Cost 49 83
(-) Depreciation 45 46
Profit before tax -17 10
(-) Tax 6 -0.4
Profit after tax -23 10
Note: 1. Financials based on audited IND AS FS and Grouping has been done wherever applicable | 2. FY19 numbers have been reclassified for like to like comparison
with FY20 | 3. Radiant consolidated includes BLK, Nanavati, Radiant Standalone and its subsidiaries | 4. BLK also includes performance of Radiation Oncology operated
by Radiant
Private &Private & Confidential
Confidential 14EBITDA Reconciliation
INR Cr Particular FY19 FY20
Details Amount Details Amount
1 EBIDTA working as per consolidated Ind AS financial statement:
Profit before Tax (PBT) (17) 10
Add: Depreciation 45 46
Add: Finance Cost 49 83
Add: Contingent Consideration 19 (6)
Less: Non operating Income (15) (35)
Computed EBITDA 81 99
2 Other non operating income – Eliminated
Less: EPCG Income recognized in IND AS (4) (4) (9) (9)
3 One time expenses / Non Operating Expense - Added back
Add: Onetime/ Transaction expenses 30 45
Add: GST expenses on Management fees 7 7
Add: One time compensation paid for insourcing of Ophthal. services 2 -
Add: One time additional PF liability pursuant to Supreme Court ruling 2 41 - 52
Total Adjustments ( 2 + 3 ) 37 43
Adjusted IND AS EBITDA 118 142
4 Differences between I-GAAP and IND AS - Impact reversed
Add: Impact of IND AS 116 (7)
Add: Other IND AS Adjustments 5 3
Total Adjustments ( 2 + 3 + 4) 5 4
Derived EBITDA as per I-GAAP 123 138
Private &Private & Confidential
Confidential 15Consolidated Ind AS Financials Position Overview
Particulars (INR Cr) Mar 31, 2018(1&2) Mar 31, 2019(1&2) Mar 31, 2020(1)
Gross Debt (excludes loan to MHIL) 364 276 415(3)
Net Debt (excludes loan to MHIL) 168 (84) 279(3)
Net Worth 337 630 2,627/ 2,500(4)
Capital Employed 524 595 689(5)
Invested Capital 912 1,004 1,090(5&6)
Tangible Fixed Assets (Gross Block Incl. CWIP) 472 618 660
Return on Capital Employed (ROCE) 6.8% 13.0% 15.0%
Return on Invested Capital (ROIC) 4.5% 6.9% 9.2%
Pursuant to Scheme of Amalgamation and Arrangement, Radiant’s healthcare business (BLK & Nanavati) has been
demerged from Radiant and merged with MHIL as on June 01, 2020
Note: 1. Financials based on Ind AS accounting | 2. Figures have been regrouped from audited financials where required | 3. Excludes INR 440 Cr given to Max Healthcare
as shareholder loan, IND AS 116 lease liability of INR 20 Cr and IND AS EIR effect of INR 3 Cr | 4. Net worth is for consolidated business and Radiant’s healthcare business
respectively | 5. Excludes capital infusion for investment of INR 2,136 Cr in Max Healthcare I 5. Excludes INR 440 Cr and downstream investment in Max Healthcare I 6.
Invested Capital Includes accumulated losses of past years
Private &Private & Confidential
Confidential 16Covid-19: Response & Contributions
Private &Private & Confidential
Confidential 17Covid-19: Response & Contributions
Our response: Key Contributions during Covid-19:
Among the first to offer 100+ beds in Mumbai for Covid - Offered more than 300(1) Covid-19 beds
19 care
Served more than ~1,900(1) Covid-19 patients
Set up medical processes in conjunction with government
Tested over 17,000(1) patients
healthcare authorities
— Formulated detailed clinical protocols for clinical First of its kind convalescent plasma therapy trial for
management and infection prevention critically ill patients
— Created isolation areas for segregation
Successfully performed more than 350 Cancer
— Provided intensive training to frontline medical surgeries during Covid-19
personnel
Performed a complicated Liver Transplant surgery
Introduced homecare service for Covid-19 patients with
on a ‘10 month old baby boy
mild symptoms
Successfully managed a ‘13 year old boy who had a
Effectively managed supply chain to prioritize availability
rare disorder linked to Covid-19 complication
of Covid-19 related materials
(multisystem inflammatory abnormal syndrome)
Implemented measures to conserve cash including
Saved life of a ‘74 year old heart patient by
material rate renegotiations and deferment of
performing TAVR amidst challenges of lockdown
discretionary expenses
Initiated multiple Covid-19 related research projects
― Strong balance sheet to support operation
including sero studies, genomic studies and
Strengthened digital platforms to significantly ramp up Favipiravir study
tele/video consultations
Participating in the WHO SOLIDARITY trial in
partnership with ICMR
Note: 1.As on July 15, 2020
Private &Private & Confidential
Confidential 18Scheme Update
Private &Private & Confidential
Confidential 19Scheme Update
National Company Law Tribunal (NCLT) approved the Composite Scheme of Amalgamation and
Arrangement (Scheme) involving the demerger of healthcare business of Radiant Life Care Pvt. Ltd.
(Radiant) into Max Healthcare Institute Ltd. (MHIL) and amalgamation of residual Max India Ltd.
(MIL) with MHIL post demerger of allied health and associated activities into Advaita Allied Health
Services Ltd.:
― Demerger and amalgamation pursuant to Scheme effective June 01, 2020
All MIL shareholders, as on the record date (June 15, 2020), have been allotted shares of MHIL as
per the share exchange ratio set out in the approved Scheme
All Radiant shareholders, as on record date (June 01, 2020), have been allotted shares of MHIL as per
share entitlement ratio set out in the approved Scheme
Listing of MHIL expected by August 2020 subject to receipt of approvals
Private &Private & Confidential
Confidential 20Combined Entity - Structure
Max Public &
KKR Abhay Soi
Promoter Others
47.0% 52.0% 23.3% 12.0% 7.0% 17.7%
KKR to acquire additional 4.99% stake of
Merged Entity from Max Promoters
MHIL
KKR to acquire 4.99% stake of MHIL from Max Promoters
Going forward, Radiant promoter Abhay Soi and KKR to be the promoters of MHIL, while current Max
promoters will be reclassified as shareholders
Note: Shareholding post allotment of shares in accordance with the scheme
Private &Private & Confidential
Confidential 21Appendix
Private &Private & Confidential
Confidential 22Overview of BLK Hospital
Private &Private & Confidential
Confidential 23BLK Super Speciality Hospital, Delhi
Financial Snapshot
Net Revenue (INR Cr.) EBITDA (INR Cr.)(1)
725
721
16 131
9
18% 21% 20%
599 109 12%
709 122
FY19 FY20 FY19 FY20
(3) (3)
Actual Revenue Normalization Impact Actual EBITDA Normalization Impact
International (2)
Revenue (%.) FY19 : 24% | FY20 : 23% Margin (%) FY19 : 18.2% | FY20 : 17.2% | FY20 (Norm.) : 18.0%
EBITDA per bed (INR lacs) Growth of 18% in FY20 net revenue despite Covid-19
impact. On a normalized basis, revenue could have been
33 INR 725 Cr (21% YoY growth)
2
11%
30 Growth of 12% in FY20 EBITDA. On a normalized basis,
3% EBITDA could have been INR 131 Cr (20% YoY growth)
31
FY20 EBITDA/bed grew from INR 30 lacs to INR 31 lacs.
FY19 FY20
On a normalized basis, EBITDA/bed could have been INR
Normalization Impact
(3) 33 lacs (11% YoY Growth)
Actual EBITDA/bed
Note:1. EBITDA Based on IND AS financials including IND AS116 impact. Pre IND AS 116 EBITDA is ~INR 117 Cr . EBITDA is calculated after Corporate Overheads | 2.
EBITDA margin is calculated on Net revenue. | 3. Normalization is based on management estimates
Private &Private & Confidential
Confidential 24BLK - Improving Operational Metrics (1/2)
ARPOB (INR / OBD) (‘000)(1) Avg. Inpatient Occupancy %
+11.6% 56 +10.2%
54 -5.9% +9.0%
72 73
50 49 68 67
Q4FY19 Q4FY20 FY19 FY20
Q4FY19 Q4FY20 FY19 FY20
Gross Revenue
(INR Cr.) FY19 : 647 | FY20 : 773
ALOS (In days)(2) ARPOB grew by 10.2% over FY19 while occupancy
improved by 9% from 67% to 73%. Key drivers
primarily specialty mix and growth in day care
-1.4% +0.0% procedures
4.8 4.7 4.6 4.6 Occupancy was driven mainly due to specialty
growth and channel mix
Occupancy dipped in Q4 FY20 due to Covid-19
impact in the last 2 weeks of Mar’20
Q4FY19 Q4FY20 FY19 FY20
Note: 1. ARPOB calculated as Gross Revenue / Total OBD
Note 2:. ALOS calculated for discharged IP patients only
Private &Private & Confidential
Confidential 25BLK - Improving Operational Metrics (2/2)
Inpatient Procedures (‘000) Outpatient Consults (‘000)
+23.6% 325
+8.0% 263
32
29
-3.3% -0.1%
8 75 75
7
- - - -
Q4FY19 Q4FY20 FY19 FY20 Q4FY19 Q4FY20 FY19 FY20
Day care Procedures (‘000) In FY20, IPD procedures grew by 8% and day care
procedures grew by 16.5% over FY19
+16.5%
40
In FY20, OP Consults grew by 23.6% over FY19
35
IPD procedures and OP consults dipped in Q4 FY20
+7.6% due to Covid-19 impact in March
9 10
― Over 60% drop in OP consults towards March
end compared to first 2 weeks of the month
Q4FY19 Q4FY20 FY19 FY20
Private &Private & Confidential
Confidential 26Centres of Excellence for High End Quaternary Care
FY20
Others Oncology(1) Share of tertiary and quaternary
-5% +2% specialties improved by 445 bps
27% FY19 26%
from 68.6% in FY19 to 73.0% in
24%
32% FY20
Among the focus specialties
oncology (incl BMT) continues to
11% be the fastest growing despite the
Cardiac largest share
9% 7% 10%
Gastro sciences
Enterology 7%
8% Efforts on further driving high end
+2%(2) 11% offerings in the focus specialties
6% 7%
Neuro
Renal(3) 15%
sciences
Orthopedics
+4%
Note: 1. Oncology includes bone marrow transplant (BMT), Chemotherapy and Radiotherapy
Note: 2:.Gastroenterology includes liver transplant
Note: 3. Renal includes kidney transplant
Private &Private & Confidential
Confidential 27BLK Super Speciality Hospital, Delhi
State-of-the-Art Infrastructure
1959
Hospital Facade View Central Reception 17 OTs & 2 Cath Labs
Day care (100 beds) OPD Blocks (70 OPD chambers) ICCU (125 ICU beds)
Private &Private & Confidential
Confidential 28BLK Super Speciality Hospital, Delhi - Covid-19: Significant
initial impact from Covid 19 followed by sharp recovery
Occupancy (%)
Occupancy rate dropped sharply in the end
of March to 30% and continued to remain
subdued during April- May
73 77 75 75 76 76 72 77 72 76
67
56 53 Overall impact of ~ INR 16 Cr on revenues in
30 33 Mar’20 and ~ INR 9 Cr in EBITDA
Mar-20
Apr-19
Oct-19
Apr-20
Jul-19
Aug-19
Jan-20
May-19
Jun-19
Dec-19
May-20
Jun-20
Sep-19
Nov-19
Feb-20
Gradual recovery in occupancy witnessed
across the network since end of May/June
2020
Gross Revenue (INR Cr.)
65 65 62 64 66
61 60 60 62 60
56 54
37
29
24
Apr-19
Aug-19
Oct-19
Mar-20
Apr-20
Jul-19
Jun-19
Dec-19
Jan-20
Jun-20
May-19
May-20
Sep-19
Nov-19
Feb-20
Private &Private & Confidential
Confidential 29Overview of Nanavati Hospital
Private &Private & Confidential
Confidential 30Nanavati Super Speciality Hospital, Mumbai
Financial Snapshot
Net Revenue (INR Cr.) EBITDA (INR Cr.)(1)
721
364
7 30 25
11% 25
9% 3
328 20
358 126%
15 11 99%
22
10
5
FY19 FY20
0
Actual Revenue (Rs. Cr) Normalization Impact(3) FY19 FY20
Actual EBITDA (INR Cr.) Normalization Impact (3)
International
Revenue % FY19 : 2% | FY20 : 4% Margin (%)(2) FY19 : 3.4% | FY20 : 6.3% | FY20 (Norm.) : 7%
EBITDA per bed (INR lacs)
Growth of 9% in FY20 net revenue despite Covid-
12
19 impact. On a normalized basis, revenue could
2 have been around INR 364 Cr (11% YoY growth)
139%
5 111% Growth of 99% in FY20 EBITDA. On a normalized
10 basis, EBITDA could have been INR 25 Cr (126%
YoY growth), given the improvement in ARPOB
and significant savings across cost lines
FY19 FY20
Actual EBITDA/Bed Normalization Impact (3)
FY20 EBITDA/bed grew from INR 5 lacs to INR 10
lacs. On a normalized basis, EBITDA/bed could
Note:1. EBITDA Based on IND AS financials. Pre IND AS 116 EBITDA is ~INR 20 Cr. EBITDA is
calculated after Corporate Overheads | 2. EBITDA margin is calculated on Net revenue | 3. have been INR 12 lacs (139% YoY Growth)
Normalization is based on management estimates
Private &Private & Confidential
Confidential 31Nanavati - Improving Operational Metrics (1/2)
ARPOB (INR / OBD) (‘000)(1) Avg. Inpatient Occupancy %
-11.5% -5.5%
69 69
+12.7% 53 65
62
+15.7% 49
47
43
Q4FY19 Q4FY20 FY19 FY20 Q4FY19 Q4FY20 FY19 FY20
Gross Revenue
(INR Cr.) FY19 : 352 | FY20 : 385
ALOS (In days)(2)
ARPOB grew by 15.7% over FY19 while occupancy
0.1% -3.2% dropped 5.5%. Primarily driven by growth in day
5.1 5.1 5.2 5.0
care procedures and improvement in ALOS
Occupancy dipped in Q4 FY20 due to Covid-19
impact in the last 2 weeks of Mar’20
Q4FY19 Q4FY20 FY19 FY20
Note: 1. ARPOB calculated as Gross Revenue / Total OBD
Note 2:. ALOS calculated for discharged IP patients only
Private &Private & Confidential
Confidential 32Nanavati - Improving Operational Metrics (2/2)
Inpatient Procedures (‘000) Outpatient Consults (‘000)
+6.2%
-1.2% 142 150
16 15
-5.7% -6.2%
4 4 38 36
- - - -
Q4FY19 Q4FY20 FY19 FY20 Q4FY19 Q4FY20 FY19 FY20
Day care Procedures (‘000)
In FY20, day care procedures grew by 21.5% over
FY19
+21.5%
16
In FY20, OP Consults grew by 6.2% over FY19
13
+36.1% IPD procedures and OP consults dipped in Q4 FY20
4 5 due to Covid-19 impact in March
Q4FY19 Q4FY20 FY19 FY20
Private &Private & Confidential
Confidential 33Centres of Excellence for High End Quaternary Care
FY20 Orthopedics
Others 15%
FY19
15% Share of tertiary and quaternary
37% General specialties maintained same at
36% 11% Medicine
11% ~63% in FY20 as compared to
FY19
11%
Focus on further driving high end
11% offerings in the focus specialties
Cardiac
3%
8% sciences
7%
9%
3%
Gastro 8%
enterology(2) 7%
8%
Oncology(1)
Renal(3) Neuro
Sciences
Note: 1. Oncology includes bone marrow transplant (BMT), Chemotherapy and Radiotherapy
Note: 2:. Gastroenterology includes liver transplant
Note: 3. Renal includes kidney transplant
Private &Private & Confidential
Confidential 34Nanavati Super Speciality Hospital, Mumbai
State of the Art Infrastructure
Hospital Facade View 25 Day Care beds 350 beds, including 75 ICU beds
Open-air Terraces
Cath Lab 10 OTs & 3T MRI with HIFU
(for patients and attendants)
Private &Private & Confidential
Confidential 35Nanavati Super Speciality Hospital, Mumbai - Covid-19:
Significant initial impact from Covid 19 followed by sharp recovery
Occupancy rate dropped sharply in end Occupancy (%)
March to ~40% and continued to remain
subdued during April- May
79 74
64 59 62 71 66 65 63 63 67
Overall impact of ~ INR 7 Cr on revenues in 56 56
48
Mar’20 and ~ INR 3 Cr in EBITDA 41
Gradual recovery in occupancy witnessed
Mar-20
Apr-19
Aug-19
Oct-19
Apr-20
Jul-19
Dec-19
Jan-20
May-19
Jun-19
May-20
Jun-20
Sep-19
Nov-19
Feb-20
across the network since end of May/June
2020
Gross Revenue (INR Cr.)
36 36
30 31 30 32 31 30 32 33 32
27
17 20 20
Apr-19
Oct-19
Mar-20
Apr-20
Jul-19
Jun-19
Aug-19
Jan-20
Jun-20
May-19
Dec-19
May-20
Sep-19
Nov-19
Feb-20
Private &Private & Confidential
Confidential 36THANK YOU
Private &Private & Confidential
Confidential 37You can also read