PepsiCo Presentation to Consumer Analyst Group of New York February 18, 2016 Indra Nooyi
←
→
Page content transcription
If your browser does not render page correctly, please read the page content below

PepsiCo

Presentation to Consumer Analyst Group of New York
February 18, 2016

Indra Nooyi
Chairman and Chief Executive Officer
Hugh Johnston
Vice Chairman and Chief Financial Officer

                                                     1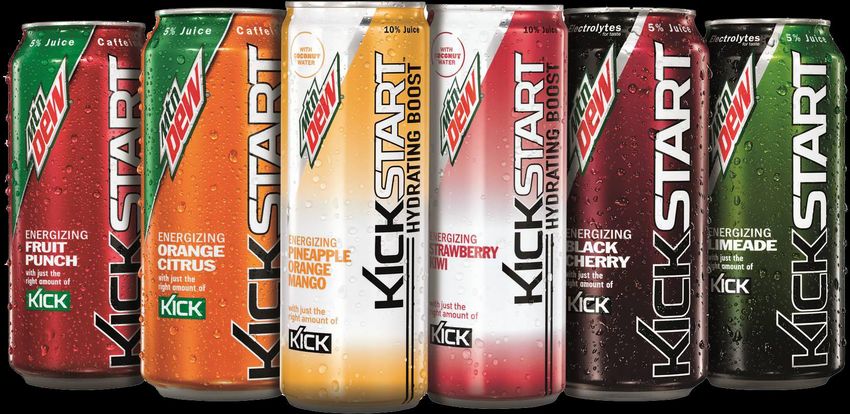
Safe Harbor Statement
& Non-GAAP Information
This presentation should be viewed in conjunction with PepsiCo’s webcast presentation at the Consumer Analyst Group of New York Conference on February 18,
2016 and PepsiCo’s Form 8-K filed with the Securities and Exchange Commission on February 11, 2016.

Safe Harbor Statement
Statements in this communication that are “forward-looking statements”, are based on currently available information, operating plans and projections about future
events and trends. Terminology such as “aim,” “anticipate,” “believe,” “drive,” “estimate,” “expect,” “expressed confidence,” “forecast,” “future,” “goal,” “guidance,”
“intend,” “may,” “objective,” “outlook,” “plan,” “position,” “potential,” “project,” “seek,” “should,” “strategy,” “target,” “will” or similar statements or variations of such
terms are intended to identify forward-looking statements, although not all forward-looking statements contain such terms. Forward-looking statements inherently
involve risks and uncertainties that could cause actual results to differ materially from those predicted in such forward-looking statements. Such risks and
uncertainties include, but are not limited to: changes in demand for PepsiCo’s products, as a result of changes in consumer preferences or otherwise; changes in
the legal and regulatory environment; imposition of new taxes, disagreements with tax authorities or additional tax liabilities; PepsiCo’s ability to compete effectively;
PepsiCo’s ability to grow its business in developing and emerging markets or unstable political conditions, civil unrest or other developments and risks in the
markets where PepsiCo’s products are made, manufactured, distributed or sold; unfavorable economic conditions in the countries in which PepsiCo operates;
increased costs, disruption of supply or shortages of raw materials and other supplies; failure to realize anticipated benefits from PepsiCo’s productivity initiatives or
global operating model; business disruptions; product contamination or tampering or issues or concerns with respect to product quality, safety and integrity; damage
to PepsiCo’s reputation or brand image; failure to successfully complete or integrate acquisitions and joint ventures into PepsiCo’s existing operations or to
complete or manage divestitures or refranchisings; changes in estimates and underlying assumptions regarding future performance that could result in an
impairment charge; PepsiCo’s ability to recruit, hire or retain key employees or a highly skilled and diverse workforce; loss of any key customer or changes to the
retail landscape; any downgrade or potential downgrade of PepsiCo’s credit ratings; the ability to protect information systems against, or effectively respond to, a
cybersecurity incident or other disruption; PepsiCo’s ability to implement shared services or utilize information technology systems and networks effectively;
fluctuations or other changes in exchange rates; climate change or water scarcity, or legal, regulatory or market measures to address climate change or water
scarcity; failure to successfully negotiate collective bargaining agreements, or strikes or work stoppages; infringement of intellectual property rights; potential
liabilities and costs from litigation or legal proceedings; and other factors that may adversely affect the price of PepsiCo’s common stock and financial performance.

For additional information on these and other factors that could cause PepsiCo’s actual results to materially differ from those set forth herein, please see PepsiCo’s
filings with the Securities and Exchange Commission, including its most recent annual report on Form 10-K and subsequent reports on Forms 10-Q and 8-K.
Investors are cautioned not to place undue reliance on any such forward-looking statements, which speak only as of the date they are made. PepsiCo undertakes
no obligation to update any forward-looking statements, whether as a result of new information, future events or otherwise.
Non-GAAP Information
Please refer to the “Investors” section of PepsiCo’s web site at www.pepsico.com under the heading “Events and Presentations” to find disclosure and a
reconciliation of any non-GAAP financial measures contained herein.
Glossary
Please refer to the Glossary and attachments to PepsiCo’s Form 8-K filed with the Securities and Exchange Commission on February 11, 2016 available at
www.pepsico.com for the definitions of non-GAAP financial measures including organic, core, constant currency, and free cash flow excluding certain items.
                                                                                                                                                                                  2
Portrait of a Consistent and Durable CPG Company

 Revenue                                                                                $63B

Free Cash Flow (ex certain items)                                                      $8.1B

Organic Revenue Growth                                                                  5%

Core Operating Margin                                                                   15.8%

Core Net ROIC                                                                           19.6%

3 Yr Core Constant Currency EPS (Avg)                                                    9%

3 Yr Dividends per Share CAGR                                                            9%

3 Yr Cumulative Cash Returns                                                            $24B
Note: All figures are for the year 2015. Certain of the above items represent Non-GAAP financial measures that exclude certain items. Please refer to the “Reconciliation of GAAP and Non-GAAP Information” attachment
posted on February 18, 2016 under the “Investors – Events and Presentations” section on PepsiCo’s website at www.pepsico.com to find disclosure and a reconciliation of the above non-GAAP financial measures.           3
2015: Delivered Our Financial Targets

                                               Target                                                                                     Result

      MSD Organic Revenue Growth                                                                                                            +5%

      Core Operating Margin Improvement                                                                                                +30 bps

      Productivity ~$1 Billion                                                                                                     $1 billion +

      Core Constant Currency EPS Growth +7%,
      raised to +9%                                                                                                                        +10%

      Share Repurchases of $4.5 to $5 Billion,
      Raised to $5 Billion                                                                                                            $5 billion

      Dividends of $4 Billion                                                                                                         $4 billion
Note: Certain of the above items represent Non-GAAP financial measures that exclude certain items. Please refer to the “Reconciliation of GAAP and Non-GAAP Information” attachment posted on February 18, 2016
under the “Investors – Events and Presentations” section on PepsiCo’s website at www.pepsico.com to find disclosure and a reconciliation of the above non-GAAP financial measures.                                4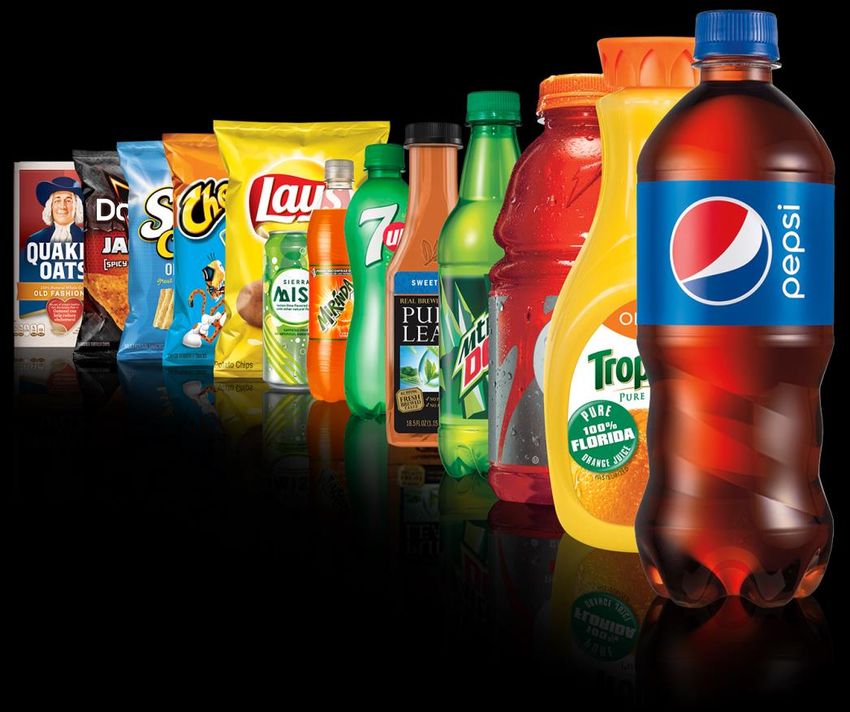
Navigating a Stormy Global Environment

                                         5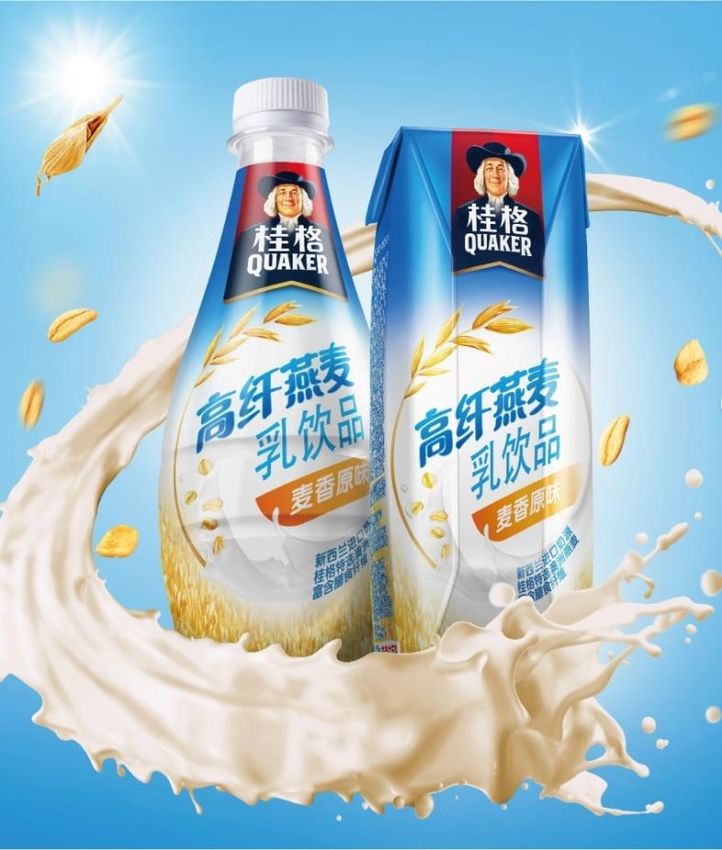
Significant Macro Challenges
        Slowing Growth /                                    Regulatory
                            Geopolitical Instability
           Recession                                         Change

            Shifting             Changing              Growing Environmental
       Consumer Behavior     Retail Environment           Consciousness

               … But Some Pockets of Stability / Recovery
                                                                               6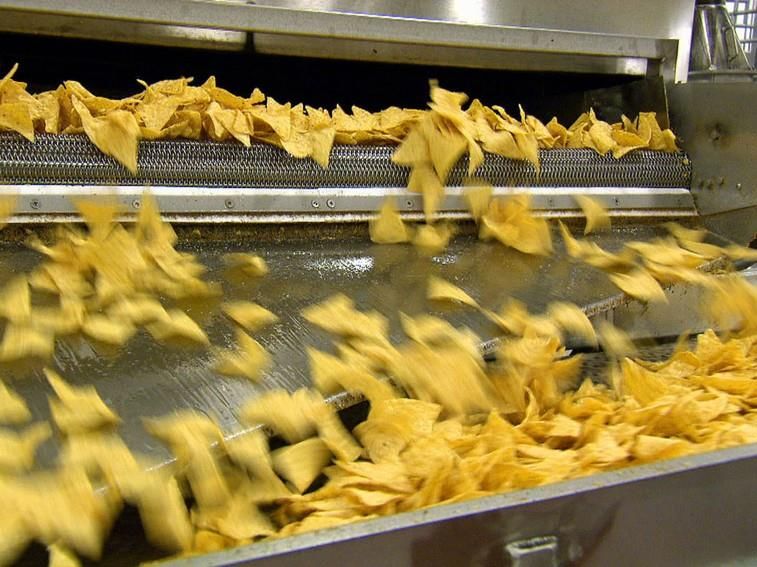
We are Performing as We are Transforming

      Transforming our Product Portfolio

      Balancing our Geographic Footprint
                                                     All While Delivering
                                                          Attractive
      Driving Productivity to Fund Investments        Financial Results

      Building Capabilities and Adapting our
      Business Model

       Reinforcing the Best and Strongest Elements
       of our Culture
                                                                            7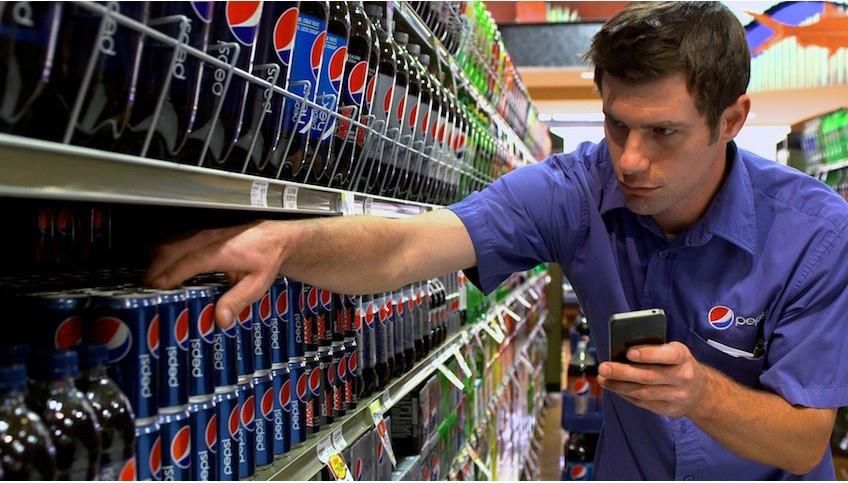
Guided by Performance with Purpose

        Delivering top-tier results in a way that sustains and respects
                     the business, society and the planet

     Human                       Environmental               Talent
     Sustainability              Sustainability              Sustainability

                                                                              8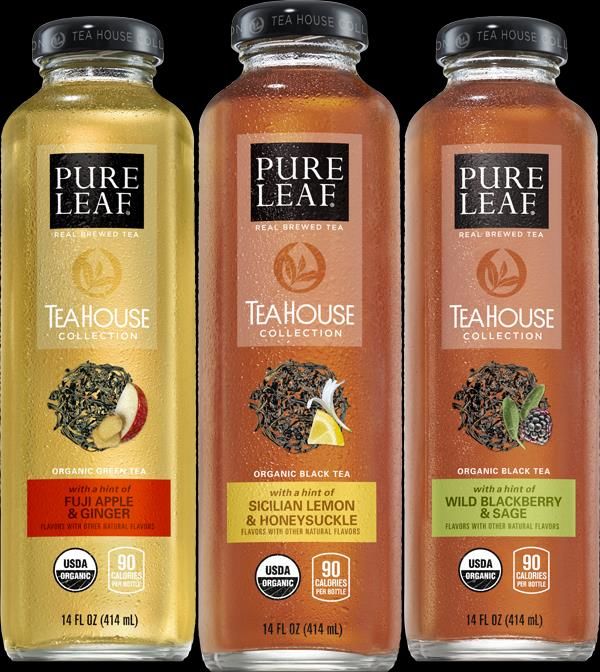
Strong Positions in Growth Categories

                         Balanced Mix in                                                                                        Highly Complementary,
                  Attractive Growth Categories                                                                                   but Diverse Portfolio
 Social Snacks                                                 Social Beverages
 • Projected global                                             • Projected global
   growth +5%                                                        growth +4%
 • Clear #1 position                     • Strong #2
 • Leadership in                        position with
   salty snacks                        leadership   in
   and opportunity                    many   markets
                    Snacks
   to target
                     53%     Beverages • Compete
   other                        47%           broadly
   macrosnack                              in all LRB
   occasions            Everyday          categories
                                            Nutrition

                                 Everyday Nutrition
                      •      Projected global growth +6%
Note: PepsiCo snacks / beverage data based on 2015 net revenue; Category growth rates based on retail sales from Euromonitor All Channel projections from syndicated data
                                                                                                                                                                            9
Balanced Geographic Mix

                                                                                    % of Net
                                                                           Market
                                                                                    Revenue

                                                           Developing      Mexico      6
                                                           & Emerging
                                                                           Russia      4
  Market            % of Net Revenue                         Markets
                                               Developed      31%
  US                               56           Markets                    Total      10
                                                 69%
  Canada                           4

  UK                               3

  Total                            63

                                    Five Countries Comprise ~75% of Total Revenue
Note: Data is based on 2015 data
                                                                                               10
Well Positioned In Top 5 Markets…
United United
Rank Canada Mexico Russia
States Kingdom
Food & Beverage Market
Share #1 #1 #1 #2 #1
Contribution to Retail
Sales Growth (‘10-’14) #1 #1 #1 #2 #1
Source: IRI MULOC (US); Euromonitor Packaged Snacks, Liquid Refreshment Beverages and Nutrition Sales, 2014 (International Markets); branded manufacturers; LRB represents system-wide sales;
Contribution to retail sales growth excludes the impact of M&A
11…Good Mix of High Current Margins / Returns and Potential
for Future Margin / Return Expansion
Emerging Developing Developed
Growth Driver Penetration Frequency Expansion
Role in Portfolio
Revenue Growth
Absolute Margin / ROIC
Margin Improvement
Cash Flow
ROIC Improvement
12Transformation Journey Continues
13Our Priorities: The 5 Cs
14Commercial
• Drive Innovation Using
Demand Space Framework
• Capture Health & Wellness
Growth Potential
• Lift and Adapt to Leverage
Our Global Scale
• Focus on New
Partnerships and
Foodservice Opportunities
15Commercial: Global Operating Model
GLOBAL EFFECTIVENESS
IDEAS
EFFICIENCY GLOBAL LOCAL
EXECUTION EXECUTION RELEVANCE
LOCAL
ACTIVATION AMPLIFICATION
16Commercial: Mtn Dew
17Commercial: Mtn Dew Kickstart
Launched in 2013 Estimated Annual Retail Sales Approaching $400 million Global Expansion
18Commercial: Mtn Dew Kickstart
Mtn Dew
Returned to
the Super
Bowl for the
First Time
Since 2000
19Commercial: Mtn Dew Kickstart
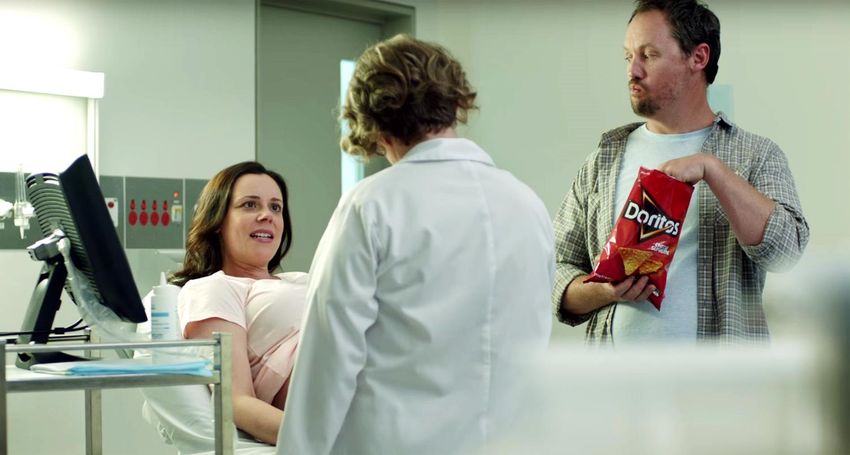
20Commercial: Doritos
21Commercial: PepsiMoji
• More than two billion smartphone • Launched in Russia, Canada and
users globally who send six Thailand in 2015
billion emojis on a daily basis
• Expanding to 100+ markets
22Commercial: MAXX Deep Ridged Chips
• Launched in 2012
• Now in 33 countries with
approximately $250 million
estimated annual retail sales
23Commercial: Walkers Sunbites
• Launched in 2007
• Now available in eight markets with $400 million
of estimated annual retail sales
• Uniquely crunchy wholegrain chips with a
wholesome taste
Crispy Crackers Pitta Bakes Crackers & Dip Crispy Snacks
Note: Estimated annual retail sales includes Sunchips 24Commercial: Quaker High Fiber Oats Drink
25Commercial: Quaker Gluten Free
26Commercial: Lipton Pure Leaf
27Commercial: Partnerships
28Commercial: Foodservice
Live Nation F!ZZ NSPIRE
Stubborn Soda Hello Goodness Kola House
29Cost
• ~$1B Annual Productivity
Savings Targeted
Through 2019
• Leverage Global Functions
and Capabilities
• Exploit Automation and
Technology
• Global Smart Spending
Implementation
30Cost: Addressing $53B of Global Costs
Category % of Cost Our Approach
All Other 8 • Smart Spending
Marketing 6 • Smart Spending
Logistics /
Transportation 11 • Non-Working to Working
• Manufacturing Optimization
• Logistics Integration
Labor 30 • Technology Deployment
• Layers & Spans
• Automation
• Segmentation
• Standards Compliance
Direct
Materials 45
• Procurement Excellence
• Waste Reduction
• Local Sourcing
Note: Estimated based on 2014 data 31Cost: Embedding New Cost Mgmt Behaviors Across PEP
1. Visibility 2. Value 3. Category
Targeting Ownership
1. Provide transparency to ‘who-spends-how-much-on-
what’ through transactional data analysis
4. Smart
2. Conduct benchmarking, value lever analysis and define Spending
expense policies and procurement initiatives to reduce 6. Control & Budget
consumption and price Monitor Closed Loop
3. Create an accountability matrix to ensure dual-ownership Process
of every expense
4. Budget from zero annually to expose and eliminate
unproductive expenses
5. Execute strategic sourcing events to realize price
reductions with suppliers
5. Procurement
6. Monthly review to identify budget variances, owners
responsible, and action plans to resolve them
32Cost: Driving Operations Productivity
33Capital
• Disciplined Capital Allocation
• Drive Individual Business
Country Performance to
Higher EVA
• Leverage Partnerships to
Improve Returns and
Competitive Positions
• Implement Low-Cost
Business Models
34Capital: Capex to Net Revenue
Capex to Net Revenue (%)
3-Year average 70 basis points lower than 2011 percentage
6.0
5.0
5.0
4.3
4.0
3.0
2.0
1.0
2011 2013-2015 (Average)
35Capital: Driving Higher Utilization of Assets
Integrated Logistics Network Boosting Throughput
36Capital: Core Net ROIC Improvement
Core Net ROIC (%)
19.6
17.5
16.4 +210
+110 bps
+110 bps
bps
2013 2014 2015
Note: Core Net ROIC represents a Non-GAAP financial measure that excludes certain items. Please refer to the “Reconciliation of GAAP and Non-GAAP Information” attachment posted on February
18, 2016 under the “Investors – Events and Presentations” section on PepsiCo’s website at www.pepsico.com to find disclosure and a reconciliation of the above non-GAAP financial measures.
37Capability
Advance Our Commercial
Agenda with New Capabilities
• eCommerce
• Design
• Revenue Management
• Front Line Selling Tools
• Data Analytics
38Capability: Design
Brand Identity Brand Experiences
Innovation Customer Partnerships
39Capability: Revenue Management
Lay’s Promotion Strategy Pepsi Mini Cans
40Capability: Front Line Selling Tools
41Culture
• Live Our Values
• Reward Excellence
• Cultivate Efficiency and
Accountability
• Expect Collaboration
42Virtuous, Self-Reinforcing Growth Cycle
• Well Positioned in
Attractive
Categories
• Scale Leverage
• Aggressive
Productivity
• Brand Building Programs
• Innovation
• Go-to-Market
Capability
43Deliver Attractive Returns
Long-Term Goals
Top Tier TSR
• Organic Revenue Growth: +MSD • Core FCF Growth • Complementary Portfolio of Brands
= Net Income Growth in Snacks, Beverages and Nutrition
• Operating Margin Expansion: Categories
+30-50 bps / year • Core Net ROIC: 50+ bps / year
• Globally Balanced Geographic
• Core, Constant Currency EPS: • Strong Returns to Shareholders Footprint
+HSD (dividends and share
repurchases)
• Leading Brand Building, Innovation and Go-to-Market Capabilities
Supporting • Flexible, Low-Cost Supply Chains That Are Environmentally Sustainable
Fundamentals:
• Focus on Productivity
• World-Class Talent Development
Note: Certain of the above items represent Non‐GAAP financial measures that exclude certain items. Please refer to the “Reconciliation of GAAP and Non‐GAAP Information”
attachment posted on February 18, 2016 under the "Investors ‐ Events and Presentations” section on PepsiCo’s website at www.pepsico.com to find disclosure and a reconciliation
of the above non‐GAAP financial measures. 44Consistent, Strong Performance
Organic Revenue Growth (%)
Consistent with long-term target
5
4 4
2013 2014 2015
Note: Organic revenue represents a Non-GAAP financial measure that excludes certain items. Please refer to the “Reconciliation of GAAP and Non-GAAP Information” attachment posted on February 18,
2016 under the “Investors – Events and Presentations” section on PepsiCo’s website at www.pepsico.com to find disclosure and a reconciliation of the above non-GAAP financial measure. 45Delivering Productivity
On Track to Deliver Aggressive, but
Core Operating Profit per Employee ($M)
Realistic Productivity Targets
Rationalized 30+ plants since 2013 +8% since 2011
$5B 37.8
36.7
$3B
34.9
'12-'14 '15-'19 2011 2013 2015
Note: Core operating profit represents a Non-GAAP financial measure that excludes certain items. Please refer to the “Reconciliation of GAAP and Non-GAAP Information” attachment posted on February
18, 2016 under the “Investors – Events and Presentations” section on PepsiCo’s website at www.pepsico.com to find disclosure and a reconciliation of the above non-GAAP financial measure. 46Gross and Operating Margin Expansion
Core Gross Margin (%) Core Operating Margin (%)
(excluding A&M and R&D)
+285 bps expansion since 2012 +195 bps expansion since 2012
55.0 23.2
+80
+140
53.6 bps bps
53.1 22.4
+55 22.1 +35
+90 bps
bps +80 bps
bps
2013 2014 2015 2013 2014 2015
Note: The above items represent Non-GAAP financial measures that exclude certain items. Please refer to the “Reconciliation of GAAP and Non-GAAP Information” attachment posted on February 18,
2016 under the “Investors – Events and Presentations” section on PepsiCo’s website at www.pepsico.com to find disclosure and a reconciliation of the above non-GAAP financial measures. 47Investing in Growth (I)
A&M as a % of Revenue
+~110 bps since 2011
6.3
5.9
5.2
2011 2013 2015
48Investing in Growth (II)
R&D ($mm) Strengths of our Current Global R&D Model
+44% increase since 2011
754
665 Strategic
Global Platforms Scalable
LEADING INNOVATION & PRODUCTIVITY
525
Universal Lift
Connected Proprietary & Adapt
2011 2013 2015
49Resulting in Attractive Core, Constant-Currency EPS Growth…
Core Constant Currency EPS Growth (%)
10
Consistent 9 9
with or above
long-term
target
2013 2014 2015
Note: The above items represent Non-GAAP financial measures that exclude certain items. Please refer to the “Reconciliation of GAAP and Non-GAAP Information” attachment posted on February 18, 2016
50
under the “Investors – Events and Presentations” section on PepsiCo’s website at www.pepsico.com to find disclosure and a reconciliation of the above non-GAAP financial measures.Free Cash Flow Generation…
FCF as % of Core Net Income Cumulative Free Cash Flow
(excluding certain items) ($B, excluding certain items)
Average: 119
120 117 120 24.5
16.4
8.2
2013 2014 2015 2013 2014 2015
Note: The above items represent Non-GAAP financial measures that exclude certain items. Please refer to the “Reconciliation of GAAP and Non-GAAP Information” attachment posted on February 18, 2016
under the “Investors – Events and Presentations” section on PepsiCo’s website at www.pepsico.com to find disclosure and a reconciliation of the above non-GAAP financial measures. 51And Total Shareholder Return
3-Year Cumulative TSR Growth (%)
59.0
55.9
52.6
S&P 500 Consumer Staples PEP
Index
Note: For period ending December 31, 2015 52Conclusion
Well-Positioned, Balanced Portfolio
Performing as we Transform
Clear Priorities
Managing business for level and duration of returns
5354
You can also read