Investor Presentation - Aug. 2016
←
→
Page content transcription
If your browser does not render page correctly, please read the page content below

Investor Presentation – Aug. 2016

Safe Harbor Statement

These slides may contain projections or other forward-looking statements regarding future events, including but not limited to, those regarding our business
outlook for the full year of 2016. These statements involve risks and uncertainties, and actual events or results may differ materially. Among the important factors
that could cause actual results to differ materially from those in the forward-looking statements are our dependence on sales of our capture devices for
substantially all of our revenue and the effect of a fall in sales during the holiday season; the fact that we do not expect to continue to grow in the future at the
same rate as we have in the past, that we may fail to manage our growth, and profitability in recent periods might not be indicative of future performance; any
inability to successfully manage frequent product introductions and transitions or to anticipate consumer preferences and successfully develop desirable
products; the risks associated with our expected entrance into the consumer drone market; the effects of the highly competitive market in which we operate; the
risks related to inventory, purchase commitments and long-lived assets; difficulty in accurately predicting our future customer demand; the importance of
maintaining the value and reputation of our brand; and other factors detailed in the Risk Factors section of our Annual Report on Form 10-K for the year ended
December 31, 2015, which is on file with the Securities and Exchange Commission. These forward-looking statements speak only as of the date hereof or as of
the date otherwise stated herein. GoPro disclaims any obligation to update these forward-looking statements.

We report gross margin, operating expenses, operating income (loss), net income (loss) and diluted net income (loss) per share in accordance with U.S.
generally accepted accounting principles (GAAP) and additionally on a non-GAAP basis. Non-GAAP items exclude, where applicable, the effects of stock-based
compensation, acquisition-related costs, restructuring costs and the tax impact of these items. Additionally, we report non-GAAP adjusted EBITDA. We believe
that non-GAAP information is useful because it can enhance the understanding of our ongoing economic performance. We use non-GAAP reporting internally to
evaluate and manage our operations. We have chosen to provide this information to investors to enable them to perform comparisons of operating results in a
manner similar to how we analyze our own operating results.

A full reconciliation of GAAP to non-GAAP financial data can be found in the appendix to this slide package and in our Q2 2016 earnings press release issued
on July 27, 2016, which should be reviewed in conjunction with this presentation.

Certain data in this presentation was obtained from various external sources, and neither the Company nor its affiliates, advisers or representatives has verified
such data with independent sources. Accordingly, neither the Company nor any of its affiliates, advisers or representatives makes any representations as to the
accuracy or completeness of that data or to update such data after the date of this presentation. Such data involves risks and uncertainties and is subject to
change based on various factors.

The trademarks included herein are the property of the owners thereof and are used for reference purposes only. Such use should not be construed as an
endorsement of the products or services of the Company or this proposed offering.
                                                                                                                                                                        2
GOPRO BY THE NUMBERS

      ESTABLISHED                        HQ IN                     1621                         IPO IN
        IN 2004                       SAN MATEO                  EMPLOYEES                    JUNE 2014

    • • • • • • • • • • •• • • • • • • • • • • • • • • • • • • • • •• • • • • • • • • • • • • • • • • • • • • • • •
         • 2Q16 unit sell-thru was up approximately 10% Q/Q and down less than 10% Y/Y
         • 2Q16 sell-thru exceeded sell-in by over 50%, reducing channel and GoPro
               inventory sequentially by ~35% and ~36%, respectively

         • GoPro’s $399 and above cameras accounted for 50%+ of units shipped
         • ~22 million cumulative cameras shipped thru 2Q16, including 759K cameras
               shipped in 2Q16

         • Quik & Splice mobile editing apps have been downloaded a combined 37 million
               times. The GoPro App has ~29 million cumulative downloads and installs of
               GoPro Studio have reached 17.7 million
Sources: NPD, GfK, & GoPro as of 6/30/2016                                                                            3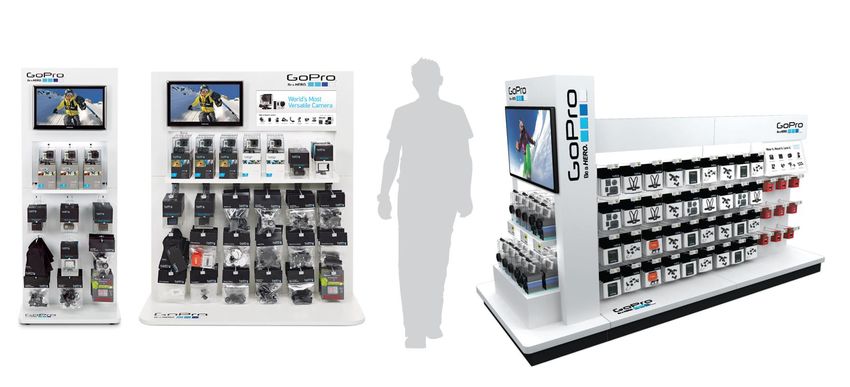
MARKET SHARE

      • Market Share
              •      GoPro accounted for 6 of the top 10 products on a unit basis, including the top 3 spots, for 2Q16 in the
                     combined digital camera/camcorder category in the U.S.*
              •      HERO4 Silver remains the best-selling digital image camera on a unit and dollar basis for the seventh
                     consecutive quarter.*
              •      By our estimate, HERO Session was the #2 best-selling camera on a unit basis for the second consecutive
                     quarter in the U.S.
              •      2Q16 digital camera/camcorder leading unit share in the U.S. increased 110 basis points YoY to 21.3%.*
              •      2Q16 digital imaging unit share in Europe increased 110 basis points YoY to 9.4%.**
              •      GoPro accounted for 4 of the top 5 camcorders in Europe on a unit basis.**

Sources: *NPD, **GfK, GoPro as of 6/30/2016                                                                                     4
RECENT ANNOUNCEMENTS

• Recent Announcements
   •   Announced an exclusive partnership with Reliance Digital, India's largest Consumer Electronics retailer, that will
       put GoPro's cameras, mounts and accessories, on the shelves of up to 1,800 Reliance Digital across India.
   •   Lauren Zalaznick was appointed to GoPro's Board of Directors. A 12-year executive at NBCUniversal, Ms.
       Zalaznick has devoted her career to transforming the cultural landscape in media, and has been named one of
       Time's 100 Most Influential People and Fortune's 50 Most Powerful Women.
   •   Signed content partnerships to create episodic content with some of the world's most recognized brands
       including Ford, Wimbledon, and Real Madrid. The first series, produced with Ford Motor Company titled
       "Unstoppable Life," profiles GoPro athletes who demonstrate the perseverance and determination on their
       respective life journeys.
   •   Launched GoPro Care to U.S. consumers, a fee-based service offering a range of support options, including
       extended warranty and accidental damage coverage.
   •   Entered into a multi-year, global agreement with Red Bull that included content production, distribution, and
       cross-promotion through which GoPro will become Red Bull's exclusive provider of point-of-view imaging
       technology. Content to be distributed across both Red Bull and GoPro's digital distribution networks, including
       The GoPro Channel, Red Bull TV, RedBull.com and in the Red Bull Content Pool, Red Bull's media service
       platform.
                                                                                                                      5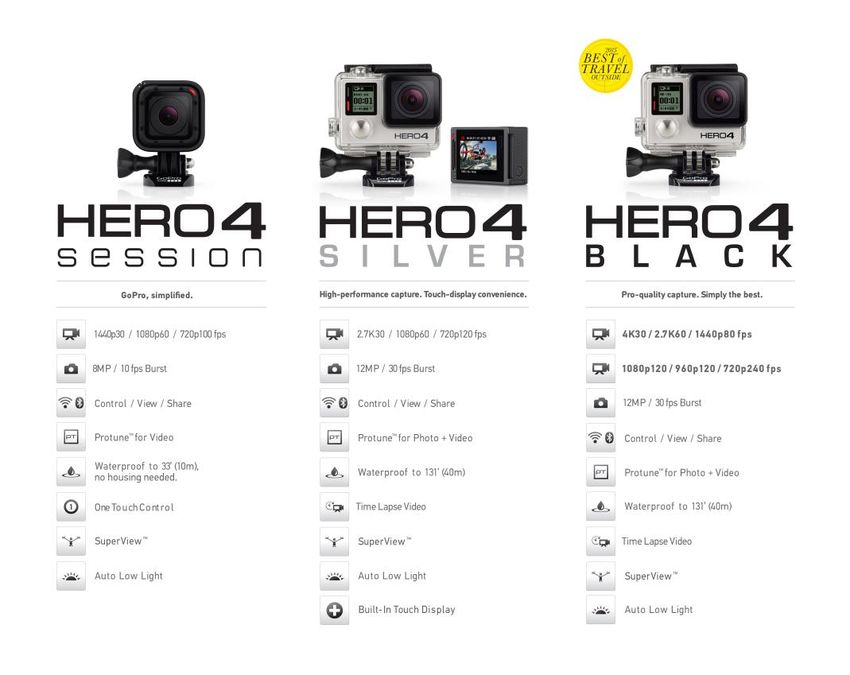
ABOUT US

           what we make         what we do

     World’s Most Versatile   Enable Engaging
       Capture Devices           Content

                                                6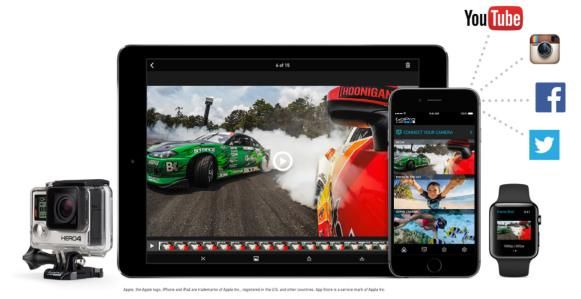
Why GoPro Matters
People are spending more time online   GoPro enables the world to capture and
sharing personal experiences through   share its passion in the form of immersive
photos and video                       and engaging content

                                                                                    7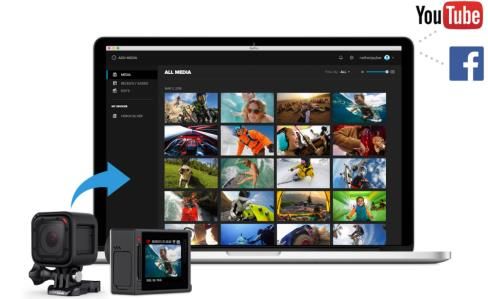
GOPRO MODEL: A VIRTUOUS CYCLE

    CAPTURE, ACCESS, & SHARE        VIRALLY SCALES
      ENGAGING CONTENT          AWARENESS + ENTHUSIASM

                                                         8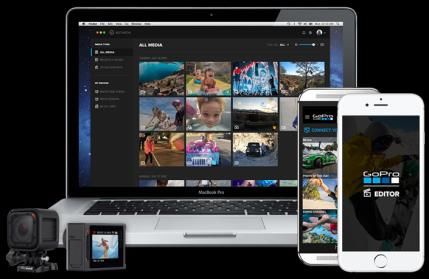
MARKET LEADING PRODUCT LINE & FEATURES

                                     Software features
                                    Hilight Tagging

                                    Trim n Share

                                    GoPro App for the
                                    Apple Watch

                                    Periscope – Live Streaming
            MSRP’s                  from a GoPro HERO4 Black
                                    or Silver
 $199.99    $399.99   $499.99
                                                                 9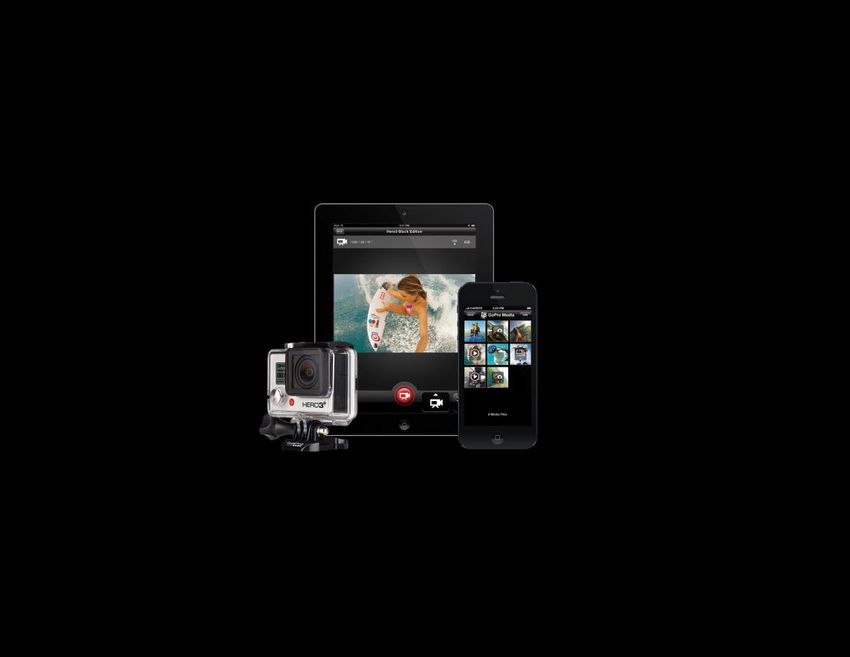
ATTRACTIVE MARKET OPPORTUNITY
ANNUAL UNIT MARKET OPPORTUNITY
CONTENT DRIVEN MODEL CREATES ORGANIC
User-Generated-
MEDIA OPPORTUNITIES
Content
Virtual Reality Software Advertising
NEW MEDIA
CAPTURE Services Linear programming
OPPORTUNITIES
Licensing OTT
DIGITAL CAMERAS
& CAMCORDERS Drone
50mm+
MATURE CE
PRODUCTS Social
30mm+
5.1mm units
(TTM)
Note: Portable navigation device market representative of mature CE products. 10
Source: IDC 2014, Technavio.OUR MISSION: ELIMINATE THE PAIN POINTS OF CAPTURING,
ACCESSING AND SHARING ENGAGING CONTENT
PHASE I PHASE II
MAXIMIZE SHARING &
CAPTURE ACCESS
ENJOYMENT
LEADING CAPTURE
BRAND Cross Platform Content
Management & Editing
Solutions
LEADING
+
ACCESSORY BRAND
GoPro Desktop App w/
GoPro Studio, Quik &
Splice
11GOPRO PLATFORM – INCREASINGLY MOBILE
29 million cumulative
downloads
GoPro Studio
37 million cumulative downloads
43,500 average
exports per day
during 2Q16, up
15% Y/Y
12PARTICIPATING IN TODAY’S MEGA-TRENDS
• Drones
• Karma, GoPro’s drone, to be released in the second half of 2016
• User Generated Content
• Consumers watch more UGC today than ever before
• Social Media GoPro Odyssey
VR App
• Global audience for shared GoPro content
• Stokes the virtuous cycle
• Virtual Reality – Omni & Odyssey
• GoPro broadly used for VR capture today Omni
• Partnerships with Google, Facebook and others
• GoPro VR mobile app for 360-degree & VR reality content
13STRATEGIC MARKETING AND BRANDING
TOP TIER
EVENTS
TV
SOCIAL 160+ GOPRO ATHLETES
Kelly Slater
Shaun White
MARKETING Missy Franklin
CONSUMER LIFESTYLE
MARKETING MARKETING
OUT-OF-HOME ADVERTISING
PRINT ADS
RESORTS / CAMPS GLOBAL TRADESHOWS
CHANNEL MARKETING 14DISTRIBUTION – POINT OF PURCHASE
Custom video-enabled point-of-purchase displays
distributed in over 45,000 retail locations, globally
Available in 2ft, 3ft and 4ft and 12ft footprints
2 ft POP display 4 ft POP display
12 ft POP display
15STRONG NETWORK OF DIRECT AND DISTRIBUTOR SALES
BIG BOX RETAIL MID MARKET RETAIL SPECIALTY RETAIL
STRONG NETWORK OF
INTERNATIONAL DISTRIBUTORS
- China increased 1H16 sell-thru by ~140%
Y/Y, while maintaining price discipline
- Korea retail locations reached ~680
stores in 2Q16, a Q/Q increase of ~65%
- Japan 2Q16 store count increased 25%
Y/Y helping to drive a 91% Y/Y increase
in sell-thru.
- GoPro’s market share in Japan increased
15 percentage points Y/Y to 42%
- Signed an exclusive partnership in 2Q16
with Reliance Digital, India’s largest
consumer electronics retailer
DIRECT -> 58% OF 2Q16 REVENUE DISTRIBUTION -> 42% OF 2Q16 REVENUE
GLOBAL FOOTPRINT
16
45,000+ Retail Locations, 100+ countriesSIGNIFICANT BARRIERS TO ENTRY
Aspirational brand
Meaningful with #1 market Unparalleled social
investment in position engagement –
product compelling and
development – over engaging content
650* R & D drives viewership
employees and adoption
Mission to eliminate
Sophisticated and pain points of
efficient global capturing, managing
supply chain and sharing engaging
content
Extensive multi- Global distribution
faceted marketing footprint – 40,000+
efforts retail outlets in 100+
POP displays as countries
unique marketing
tool
* As of 12/31/2015 17FINANCIAL OVERVIEW
REVENUE & UNITS SHIPPED

                                                 REVENUE                                                                           CAPTURE DEVICE UNITS SHIPPED
     • • • • • • • • • • • • • • • • • • • • • • • • • • • • • • • • • • • • • • • • • • •• • • • • • • • • • • • •   • • • • • • • • • • • • • • • • • • • • • • • • • • • • • • • • • • • • • •• • • • • • • • • • • • •

                                                                                                                       Units in millions                              6.6
$ in millions
                                               $1,620
                                                                                                                                                                                ~22 million cumulative units
                                                                           $1,500*
                              $1,394                                                                                                              5.2

                                                                            $1,350
                                                                                                                             3.8
                 $986

                                                                                $420                                                                                                       1.6

                                                                                                $221                                                                                                             0.8

                 2013            2014            2015           2016E           2Q15            2Q16                        2013                 2014                 2015                2Q15                 2Q16
* 2016 revenue guidance of between $1.35 billion and $1.5 billion, as of 7/27/2016                                                                                                                                           19
QUARTERLY TRENDS
QUARTERLY REVENUE QUARTERLY GROSS MARGIN*
• • • • • • • • • • •• • • • • • • • • • • • • • •• • • • • • • • • • • • • • • • • • • • • • • • • • • • • • • • • • • •• • • • • • • • • • • • • • •• • • • • • • • • • • • • • • • • • • • • • • • •
$ in millions
$634 48.0%
46.8%
44.5% 45.2% 46.4%
42.0% 41.1% 42.2% 42.4%
35.2%
$437 33.5% 33.0%
$420 32.3%
$400 29.6%
$361 $363
$280
$255
$236 $245
$221
$192 $184
$177
1Q13 2Q13 3Q13 4Q13 1Q14 2Q14 3Q14 4Q14 1Q15 2Q15 3Q15 4Q15 1Q16 2Q16 1Q13 2Q13 3Q13 4Q13 1Q14 2Q14 3Q14 4Q14 1Q15 2Q15 3Q15 4Q15 1Q16 2Q16
* Non-GAAP metric. See reconciliation in Appendix. 20SELECTED METRICS
$ in millions 2014 2015 2Q15 2Q16
••••••••••••••••••••••••••••••••••••••••••••••••••••••••••••••••
ADJUSTED EBITDA* $293 $178 $75.3 $(76.8)
DAYS SALES OUTSTANDING 26 30 25 27
ANNUALIZED INVENTORY TURNS 9.8x 4.6x 4.7x 4.4x
CASH, CASH EQUIVALENTS & $422 $474 $517 $279
MARKETABLE SECURITIES
* Non-GAAP metric. See reconciliation in Appendix. 21PRO FORMA LONG-TERM MODEL
Long-Term
2013 2014 2015 2Q16
Annual Target
• • • • • • • • • • •• • • • • • • • • • • • • • • • • • • • • • • • • • • • • • • • • • • • • • • • • • • • • • • • • • • • • • • • • • • • • • • • • • • •
GROSS MARGIN %* 36.9% 45.1% 41.7% 42.4% 42-44%
OPERATING EXPENSES 25.6% 26.5% 33.0% 82.8% 24-26%
%*
OPERATING MARGIN %* 11.2% 18.6% 8.7% (40.4)% 18-20%
ADJUSTED EBITDA %* 13.6% 21.0% 11.0% (34.8)% 21-23%
* Non-GAAP metric. See reconciliation in Appendix. 22SUMMARY
• Aspirational brand focused on enabling the world to capture and share
its passion in the form of immersive and engaging content
• Participating in today’s mega-trends in social, OTT, virtual reality, drones
and entertainment
• Developing an ecosystem of partners, content distributors and products
• Investing in hardware & software that make is easier for GoPro users to
offload, access and edit their content
• HERO5 and Karma to be released in the second half of 2016
23APPENDIX
24Appendix: GAAP to Non-GAAP Reconciliation
To supplement our unaudited selected financial data presented on a basis consistent with GAAP, we disclose certain non-GAAP
financial measures, including non-GAAP gross profit, gross margin, operating expenses, operating income (loss), net income
(loss), earnings (loss) per share and adjusted EBITDA. These non-GAAP measures are not in accordance with, nor serve as an
alternative for GAAP. We believe that these non-GAAP measures have limitations in that they do not reflect all of the amounts
associated with our GAAP results of operations. These non-GAAP measures should only be viewed in conjunction with
corresponding GAAP measures.
In calculating non-GAAP financial measures, we exclude certain items to facilitate a review of the comparability of our core
operating performance on a period-to-period basis. The excluded items represent stock-based compensation and charges that are
primarily driven by discrete events that we do not consider to be directly related to core operating performance. We use non-GAAP
measures to evaluate the core operating performance of our business, for comparison with forecasts and strategic plans and for
calculating return on investment. In addition, management’s incentive compensation is determined using non-GAAP measures.
Since we find these measures to be useful, we believe that investors benefit from seeing results reviewed by management in
addition to seeing GAAP results. We believe that these non-GAAP measures, when read in conjunction with our GAAP financials,
provide useful information to investors by facilitating:
• the comparability of our on-going operating results over the periods presented;
• the ability to identify trends in our underlying business; and
• the comparison of our operating results against analyst financial models and operating results of other public companies
that supplement their GAAP results with non-GAAP financial measures.
25Appendix: GAAP to Non-GAAP Reconciliation
The following are explanations of each type of adjustment that we incorporate into non-GAAP financial measures:
• Stock-based compensation expense relates to equity awards granted primarily to our workforce. We exclude stock-based compensation
expense because we believe that the non-GAAP financial measures excluding this item provide meaningful supplemental information regarding
operational performance. In particular, we note that companies calculate stock-based compensation expense for the variety of award types that
they employ using different valuation methodologies and subjective assumptions. These non-cash charges are not factored into our internal
evaluation of net income as we believe their inclusion would hinder our ability to assess core operational performance. We believe that
excluding this expense provides greater visibility to the underlying performance of our business operations, facilitates comparison of our results
with other periods, and may also facilitate comparison with the results of other companies in our industry.
• Acquisition-related costs include the amortization of acquired intangible assets (primarily consisting of acquired technology), and third party
transaction costs incurred for legal and other professional services. These costs are not factored into our evaluation of potential acquisitions, or
of our performance after completion of the acquisitions, because they are not related to our core operating performance, and the frequency and
amount of such costs vary significantly based on the timing and magnitude of our acquisition transactions and the maturities of the businesses
being acquired.
• Restructuring costs primarily include severance-related costs recorded in connection with our global workforce reduction in January 2016. We
believe that excluding this expense provides greater visibility to the underlying performance of our business operations, facilitates comparison
of our results with other periods, and may also facilitate comparison with the results of other companies in our industry.
• Adjustment for taxes relates to the tax effect of the adjustments that we incorporate into non-GAAP measures in order to provide a more
meaningful measure of non-GAAP net income. We believe that these adjustments provide us with the ability to more clearly view trends in our
core operating performance.
• Additionally, adjusted EBITDA excludes the amortization of point-of-purchase (POP) display assets because it is a non-cash charge, and similar
to depreciation of property and equipment and amortization of acquired intangible assets.
26Appendix: GAAP to Non-GAAP Reconciliation
27Appendix: GAAP to Non-GAAP Reconciliation
28Appendix: Adjusted EBITDA Reconciliation
29You can also read