DR. MURTHY RENDUCHINTALA - Chief Engineering Officer, Intel Group President, TSCG
←
→
Page content transcription
If your browser does not render page correctly, please read the page content below
DR. MURTHY RENDUCHINTALA

Chief Engineering Officer, Intel
   Group President, TSCG

Statements in this presentation that refer to business outlook, future plans and expectations are forward-looking statements that involve a
number of risks and uncertainties. Words such as "anticipates," "expects," "intends," "goals," "plans," "believes," "seeks," "estimates," "continues,"
"may," "will," “would,” "should," “could,” and variations of such words and similar expressions are intended to identify such forward-looking
statements. Statements that refer to or are based on estimates, forecasts, projections, uncertain events or assumptions, including statements
relating to total addressable market (TAM) or market opportunity, future products and the expected availability and benefits of such products,
and anticipated trends in our businesses or the markets relevant to them, also identify forward-looking statements. Such statements are based
on management's expectations as of May 8, 2019, unless an earlier date is indicated, and involve many risks and uncertainties that could cause
actual results to differ materially from those expressed or implied in these forward-looking statements. Important factors that could cause
actual results to differ materially from the company's expectations are set forth in Intel's earnings release dated April 25, 2019, which is
included as an exhibit to Intel’s Form 8-K furnished to the SEC on such date. Additional information regarding these and other factors that
could affect Intel's results is included in Intel's SEC filings, including the company's most recent reports on Forms 10-K and 10-Q. Copies of
Intel's Form 10-K, 10-Q and 8-K reports may be obtained by visiting our Investor Relations website at www.intc.com or the SEC's website at
www.sec.gov.

All information in this presentation reflects management’s views as of May 8, 2019, unless an earlier date is indicated. Intel does not undertake,
and expressly disclaims any duty, to update any statement made in this presentation, whether as a result of new information, new developments
or otherwise, except to the extent that disclosure may be required by law.

3
CAGR
            PB                                               2 ZB     15 ZB          160 ZB (17-25)

      PRODUCTIVITY DATA
                                                                                                20%           COMPUTE DIVERSITY
                                                                    BROADCAST MEDIA                      Scalar, vector, spatial - AI, graphics,
                                                                                                                   media, analytics

                                                                                                         NETWORK CLOUDIFICATION
                                                                              WEB /
                                                                                                       Compute & storage distributed across
                                                                              MOBILE            35%      core, access, and edge networks

                                                                                      IOT /                  INTELLIGENT AGENTS
                                                                                    ANALYTICS         Proliferation of autonomous / AI-enabled
                                                                                                         devices, things, and edge gateways

                           Outbound/                       Inbound/ Unstructured/
                           Structured                      Latency Sensitive
Source: Analyst reports, tech press, industry interviews

                                                                                                                                                   4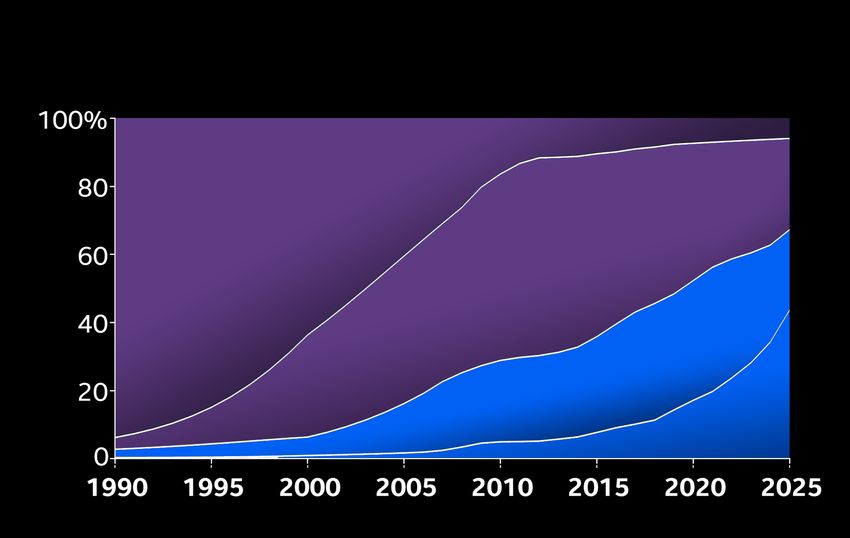
DATA CENTRIC: ~$220B                                                      PC CENTRIC: ~$68B
 High growth segments
 2018-23 growth relative to aggregate TAM                                                                                                           COMPUTE
                                                                                                                                                    DIVERSITY
10x+
                                                                                                                                                    NETWORK
                                                                                                                                                    CLOUDIFICATION

                                                                                                                                                    INTELLIGENT
                                                                                                                                                    AGENTS

   5x

                                                                             5G
                                             NVMe SSD

                                                                                                          ADAS/AD
                     DC FPGA

                                                                                                                                           Chrome
   2x

                                                                                                                                Notebook
                                   AI

                                                                                                                                Modern
                                                                                                                       Gaming
                                                                 NFV /
                                                                  SDN

                                                                                            Comp.
                                                                                            Edge
                               DATACENTER               +         Network             +             IOT
Source: Intel calculated 2023 TAM and growth rates derived from analyst forecasts and Intel TAM model
                                                                                                                     PC AND ADJACENCIES
                                                                                                                                                                     5
pc-centric     ERA
  CPU LEADERSHIP,
                                                Data-centric       ERA
                                              WORKLOAD-OPTIMIZED PLATFORMS,
 TRANSISTOR SCALING                     EFFORTLESS CUSTOMER & DEVELOPER INNOVATION

                SIX CONCURRENT PILLARS OF INNOVATION
               ACCELERATING PRODUCT ROADMAP REFRESH

                                                                                     6
SW portability, reusability and performance grows in value with compute diversity

Confidentiality, integrity and resiliency become increasingly critical

Increased data movement makes interconnects critical to the platform

Memory bandwidth/latency/cost critical to handle data

Data-centric workloads require scalar, vector, matrix and spatial compute: xPUs

Compute diversity benefits from process and packaging diversity

                                                                                 Data-centric       ERA
                                                                               WORKLOAD-OPTIMIZED PLATFORMS,
                                                                         EFFORTLESS CUSTOMER & DEVELOPER INNOVATION

                                                                                                                      7
TRANSISTOR SCALING & MONOLITHIC INTEGRATION     HETEROGENEOUS PROCESSES & INTEGRATION

  One process design point for all products   Multiple processes optimized for individual IPs
          Monolithic integration              Multi-chip integration with advanced packaging
        Product restricted by reticle                Product unconstrained by reticle

                                                                                                8
Transistor efficiency
(Perf / W)
10 Most ambitious scaling in history
2.7x density scaling
Self-aligned Quad-patterning
Contact Over Active Gate
14 Cobalt Interconnect (M0, M1)
1st Gen Foveros 3D Stacking
2nd Gen EMIB
1272 1274
2014 2015 2016 2017 2018 2019 2020 2021 2022 2023
9
Transistor efficiency
     (Perf / W)
                                                                              LEARNINGS
                                                                       Balance between schedule,
                                                                        performance, power, cost

                                               10

              14

          1272                                      1274
       2014        2015   2016   2017   2018   2019    2020   2021   2022    2023
                                                                                                   10
Transistor efficiency
(Perf / W)
LEARNINGS
Balance between schedule,
performance, power, cost
Significant opportunity for
intra-node advancement
10
>20% Increase 14++
14+
14
1272 1274
2014 2015 2016 2017 2018 2019 2020 2021 2022 2023
11Transistor efficiency
(Perf / W)
LEARNINGS
Balance between schedule,
performance, power, cost
10++ Significant opportunity for
10+ intra-node advancement
10 Value in maintaining
mix of nodes
14++
14+ Ease-of-design accelerates
14 innovation
1274
1272
2014 2015 2016 2017 2018 2019 2020 2021 2022 2023
12Transistor efficiency
(Perf / W)
7++
7+
7
2x scaling
10++ Planned intra-node optimizations
10+ 4x Reduction in design rules
EUV
10 Next-gen Foveros & EMIB packaging
14++
14+ 1276
14
1274
1272
2014 2015 2016 2017 2018 2019 2020 2021 2022 2023
13Transistor efficiency
(Perf / W) One ML of scaling & performance start of
7++ node + one ML performance intra-node
7+
Multi-chip SoC construction for
7 non-compromise performance
10++
Radical design simplification
10+ accelerates innovation
10
14++
10nm shipping in June, multiple
products through 2019 and 2020
14+ 1276
14
1274 7nm progressing to plan
Lead product launch in 2021
1272
2014 2015 2016 2017 2018 2019 2020 2021 2022 2023
14IPU
Core R Core
I
D N DISPLAY
D
Shipping in June
G
R Core Core
Approx.
2X Graphics Performance
GT
TYPE C
2.5X – 3x AI Performance
2x Video Encode
3x Wireless Speeds
OPIO
Disclaimer: Results are approximate and have been estimated or simulated as of April 2019 using Intel internal analysis or architecture simulation or modeling
Graphics and video – Next Gen Graphics Iris Plus Experience
Wireless – Intel’s Wi-Fi 6 (GIG+) vs typical competitive 11AC design
AI – AIXPRT Community 2 Preview; OpenVINO 2018.R5, Max Throughput 15W WHL to 15W ICL projection
15
For more complete information about performance and benchmark results, visit www.intel.com/benchmarks. Performance results are based on testing as of date specified and may not reflect all
publicly available security updates. See configuration disclosure for details. No product or component can be absolutely secure.Shipping in June
IPU
Core R
I
Core Multiple Product Launches
D N DISPLAY Across Entire Portfolio Through 2019 and 2020
D G
R Core Core
Xeon CPU GP-GPU AI Inference
GT
TYPE C FPGA 5G/Networking …
OPIO
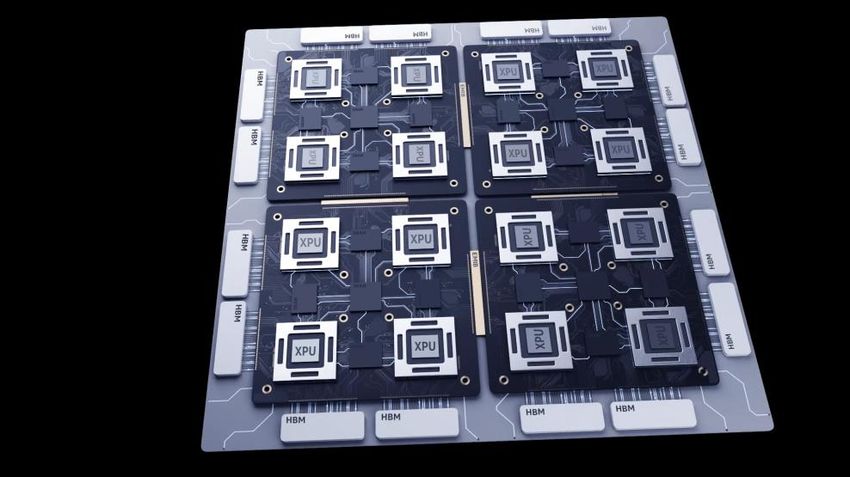
16Xe Architecture-Based GP-GPU
using Foveros for Datacenter AI & HPC
Launch in 2021
17For every order of magnitude performance
from new hardware, there is >2 orders of
magnitude unlocked by software
Raja Koduri
Chief Architect, SVP
Intel Architecture, Graphics and Software
18Example 1: Java runtime optimizations
6X
6x
4X
2X
1x
0X
JDK8 JDK9
For more complete information about performance and benchmark results, visit www.intel.com/benchmarks. Performance results are based on testing as of dates shown in
configuration and may not reflect all publicly available security updates. No product or component can be absolutely secure. 19Example 2: Persistent memory complete stack optimizations
8X
8.1 x
6X
4X
2X
1x
0X
SSD Storage Intel Optane™ DCPMM +software
For more complete information about performance and benchmark results, visit www.intel.com/benchmarks. Performance results are based on testing as of dates shown in
configuration and may not reflect all publicly available security updates. No product or component can be absolutely secure. 20Example 3: Deep Learning Boost
28 x
20X
15X
10X
5X
1x
0X
Base Hardware Hardware + Software
For more complete information about performance and benchmark results, visit www.intel.com/benchmarks. Performance results are based on testing as of dates shown in
configuration and may not reflect all publicly available security updates. No product or component can be absolutely secure. 21Per core performance advantage
Data
Analytics
Java
Web (1.9x)
Browsing
(2.1x)
(1.7x)
High
Performance
Compute
Networking (1.9x)
Productivity (2.0x)
(1.6x)
Gaming
Deep Learning
Content
(1.4x) Creation
(2.5x)
(10.3x)
For more complete information about performance and benchmark results, visit www.intel.com/benchmarks. Performance results are based on testing as of dates shown in
configuration and may not reflect all publicly available security updates. No product or component can be absolutely secure. 22>15,000 software engineers
#1 contributor to Linux kernel;
>1/2 million lines of code modified each year
> 100 operating systems optimized
top three contributors to Chromium
OS
>10,000 high touch customer deployments
top 10 contributor to Openstack
>12 million developers
For more complete information about performance and benchmark results, visit www.intel.com/benchmarks. Performance results are based on testing as of dates shown in
configuration and may not reflect all publicly available security updates. No product or component can be absolutely secure. 23Intel Software scale
CPU
Architecture
24One
Architecture
12 million developers
25One Cloud
Architecture GPU AI
Native
8 million 1 million 100K
developers developers developers
12 million developers
26One
Architecture GPU AI
27“The future is a diverse mix of
Scalar, Vector, Matrix and Spatial
CPU GPU
architectures deployed in CPU,
GPU, FPGA and Accelerator
AI FPGA
sockets…”
Intel Arch day, Dec ‘2018
28CPU GPU
GPU AI
AI FPGA
29CPU GPU
AI FPGA
30CPU GPU
GPU AI FPGA
CPU
GPU
Competitor 1 Competitor 2
31simple and scalable
open
one developer experience
32Coming soon to a developer
near you in Q4 2019
33Data Center Network Intelligent Agents
34COMPUTE DIVERSITY
Intel® MKL-DNN OpenVINO SPDK (Storage) Intel® Security
software (AI) (AI) DPDK (Network) Libraries - DC
Intel® Threat Intel®
Security Memory Encryption
Detection Tech SGX Card
Ultra Path
Interconnect Interconnect
Highest Native
Memory DDR Bandwidth
Intel® Intel® Speed Intel® Workload
XPU Architectures AVX-512 Select DL Boost Optimized SKUs
PROCESS & Packaging 14nm Scaling 56C MCP
Up to 28X AI performance
Up to 56 core per socket, 112 core in two socket
200GB/s bandwidth per socket
Up to 36TB addressable memory
AI Performance: In AP configuration
Memory bandwidth: 1-node, 2x Intel® Xeon® Platinum 9282 cpu on Walker Pass with 768 GB (24x 32GB 2933) total memory, ucode 0x400000A on RHEL7.6, 3.10.0-957.el7.x86_65, IC19u1, AVX512, HT off, Turbo on, Stream Triad
score=407 GB/s, test by Intel on 2/16/2019 35
For more complete information about performance and benchmark results, visit www.intel.com/benchmarks. Performance results are based on testing as of date specified and may not
reflect all publicly available security updates. See configuration disclosure for details. No product or component can be absolutely secure.INTELLIGENT AGENTS
software
Security
Interconnect
Memory
XPU Architectures
PROCESS & Packaging
36INTELLIGENT AGENTS
PC in Mobile form factor – 12x12x1
37INTELLIGENT AGENTS
PACKAGE Chipset
Power Delivery
Ultra low power logic - P1222
38INTELLIGENT AGENTS
Scalable 3D silicon interconnect
BASE
Ultra low-power: 0.15 pico Joules / bit
PACKAGE High bandwidth: 2-3X 2.5D interposer
Scalable power delivery: 3W-1KW
High yield process for die stacking
39INTELLIGENT AGENTS
10 nm process compute
foveros
Hybrid architecture: Core + Atom
BASE Thermal solution to enable 3D stacking
PACKAGE
40INTELLIGENT AGENTS
COMPUTE POP DRAM integration with 1 mm Z-height
foveros
BASE
PACKAGE
41INTELLIGENT AGENTS
software OpenVINO
POP DRAM
UFS Inline Boot from UFS VBS
Security Encryption
COMPUTE
Interconnect UFS 3.0 USB 3.0 MIPI CSI2
foveros
Memory POP DRAM
BASE
XPU Architectures HybRId ARCHITECTURE
GEN11 Graphics
Sunny Cove CPU Tremont CPU
PACKAGE
Foveros 3D Integration
PROCESS & Packaging
10nm Compute Die, Low Power Base Die
Results have been estimated or simulated as of April, 2019 using internal Intel
A 10X Standby SOC Power Improvement
analysis or architecture simulation or modeling vs. AML product
P
Disclaimer: Results are approximate and have been estimated or simulated as of April 2019
using Intel internal analysis or architecture simulation or modeling
P 1.5 – 2X Active SOC Power Improvement
R
For more complete information about performance and benchmark results, visit
2X Graphics Performance
www.intel.com/benchmarks. Performance results are based on testing as of date specified and
may not reflect all publicly available security updates. See configuration disclosure for details.
No product or component can be absolutely secure.
O
X 2X PCB Area Reduction 42Data drives extraordinary opportunities for growth
Intel products & methods targeted to win data-centric
growth with six pillar innovation model
You will see this in our product leadership
43Performance results are based on testing as of dates shown in configuration and may not reflect all publicly available security updates. See configuration disclosure for details. No product or component can be absolutely secure. Software and workloads used in performance tests may have been optimized for performance only on Intel microprocessors. Performance tests, such as SYSmark and MobileMark, are measured using specific computer systems, components, software, operations and functions. Any change to any of those factors may cause the results to vary. You should consult other information and performance tests to assist you in fully evaluating your contemplated purchases, including the performance of that product when combined with other products. For more complete information visit www.intel.com/benchmarks. Approx. 3x Ice Lake Wireless Speeds: 802.11ax 2x2 160MHz enables 2402Mbps maximum theoretical data rates, ~3X (2.8X) faster than standard 802.11ac 2x2 80MHz (867Mbps) as documented in IEEE 802.11 wireless standard specifications, and require the use of similarly configured 802.11ax wireless network routers. Approx. 2x Ice Lake Video Encode: Based on 4k HEVC to 4k HEVC transcode (8bit). Intel preproduction system, ICL 15w compared to WHL 15w. Measured by Intel as of April 2019. Approx. 2x Ice Lake Graphics Performance: Workload: 3DMark11 v 1.0.132. Intel PreProduction ICL U4+2 15W Configuration (Assumptions):, Processor: Intel® Core™ i7 (ICL-U 4+2) PL1=15W TDP, 4C8T, Memory: 2x8GB LPDDR4-3733 2Rx8, Storage: Intel® 760p m.2 PCIe NVMe SSD with AHCI Microsoft driver, Display Resolution: 3840x2160 eDP Panel 12.5”, OS: Windows* 10 RS5-17763.316, Graphics driver: PROD-H-RELEASES_ICL-PV-2019-04-09-1006832. Vs config – Intel PreProduction WHL U4+2 15W Configuration (Measured), Processor: Intel® Core™ i7-8565U (WHL-U4+2) PL1=15W TDP, 4C8T, Turbo up to 4.6Ghz, Memory: 2x8GB DDR4-2400 2Rx8, Storage: Intel® 760p m.2 PCIe NVMe SSD with AHCI Microsoft driver, Display Resolution: 3840x2160 eDP Panel 12.5”, OS: Windows* 10 RS4-17134.112. ,Graphics driver: 100.6195. Measured by Intel as of April 2019. Approx. 2.5x-3x Ice Lake AI Performance: Workload: images per second using AIXPRT Community Preview 2 with Int8 precision on ResNet-50 and SSD-Mobilenet-v1 models. Intel preproduction system, ICL-U, PL1 15w, 4C/8T, Turbo TBD, Intel Gen11 Graphics, GFX driver preproduction, Memory 8GB LPDDR4X-3733, Storage Intel SSD Pro 760P 256GB, OS Microsoft Windows 10, RS5 Build 475, preprod bios. Vs. Config – HP spectre x360 13t 13-ap0038nr, Intel® Core™ i7-8565U, PL1 20w, 4C/8T, Turbo up to 4.6Ghz, Intel UHD Graphics 620, Gfx driver 26.20.100.6709, Memory 16GB DDR4-2400, Storage Intel SSD 760p 512GB, OS – Microsoft Windows 10 RS5 Build 475 Bios F.26. Measured by Intel as of April 2019.
2nd Gen Intel® Xeon Scalable Processors up to 28X AI Performance: Based on Intel internal testing: 28x performance improvement based on Intel® Optimization for Café ResNet-50
inference throughput performance on Intel® Xeon® Scalable Processor.

28x inference throughput improvement on Intel® Xeon® Platinum 9282 processor with Intel® DL Boost: Tested by Intel as of 2/26/2019. Platform: Dragon rock 2 socket Intel® Xeon® Platinum
9282(56 cores per socket), HT ON, turbo ON, Total Memory 768 GB (24 slots/ 32 GB/ 2933 MHz), BIOS:SE5C620.86B.0D.01.0241.112020180249, Centos 7 Kernel 3.10.0-957.5.1.el7.x86_64,
Deep Learning Framework: Intel® Optimization for Caffe version: https://github.com/intel/caffe d554cbf1, ICC 2019.2.187, MKL DNN version: v0.17 (commit hash:
830a10059a018cd2634d94195140cf2d8790a75a), model: https://github.com/intel/caffe/blob/master/models/intel_optimized_models/int8/resnet50_int8_full_conv.prototxt, BS=64, No datalayer
syntheticData:3x224x224, 56 instance/2 socket, Datatype: INT8 vs. Tested by Intel as of July 11th 2017: 2S Intel® Xeon® Platinum 8180 CPU @ 2.50GHz (28 cores), HT disabled, turbo disabled,
scaling governor set to “performance” via intel_pstate driver, 384GB DDR4-2666 ECC RAM. CentOS Linux release 7.3.1611 (Core), Linux kernel 3.10.0-514.10.2.el7.x86_64. SSD: Intel® SSD
DC S3700 Series (800GB, 2.5in SATA 6Gb/s, 25nm, MLC).Performance measured with: Environment variables: KMP_AFFINITY='granularity=fine, compact‘, OMP_NUM_THREADS=56, CPU
Freq set with cpupower frequency-set -d 2.5G -u 3.8G -g performance. Caffe: (http://github.com/intel/caffe/), revision f96b759f71b2281835f690af267158b82b150b5c. Inference measured with
“caffe time --forward_only” command, training measured with “caffe time” command. For “ConvNet” topologies, synthetic dataset was used. For other topologies, data was stored on local storage
and cached in memory before training. Topology specs from https://github.com/intel/caffe/tree/master/models/intel_optimized_models (ResNet-50). Intel C++ compiler ver. 17.0.2 20170213, Intel
MKL small libraries version 2018.0.20

Performance results are based on testing as of 2/26/2019 (28x) and may not reflect all publically available security updates. No product can be absolutely secure. See configuration disclosure for
details.
Approx. 10x Lakefield Standby SoC Power Improvement: Estimated or simulated as of April 2019 using Intel internal analysis or architecture simulation or modeling. Vs. Amber Lake.

Approx. 1.5x-2x Lakefield Active SoC Power Improvement: Estimated or simulated as of April 2019 using Intel internal analysis or architecture simulation or modeling. Workload: 1080p video
playback. Vs. Amber Lake next-gen product.

Approx. 2x Lakefield Graphics Performance: Estimated or simulated as of April 2019 using Intel internal analysis or architecture simulation or modeling. Workload: GfxBENCH. LKF 5W & 7W
Configuration (Assumptions):,Processor: LKF PL1=5W & 7W TDP, 5C5T, Memory: 2X4GB LPDDR4x - 4267MHz, Storage: Intel® 760p m.2 PCIe NVMe SSD; LKF Optimized Power configuration
uses UFS, Display Resolution: 1920x1080 for Performance; 25x14 eDP 13.3” and 19x12 MIPI 8.0” for Power, OS: Windows* 10 RS5. Power policy set to AC/Balanced mode for all benchmarks
except SYSmark 2014 SE which is measured in AC/BAPCo mode for Performance. Power policy set to DC/Balanced mode for power. All benchmarks run in Admin mode., Graphics driver: X.X Vs.
Configuration Data: Intel® Core™ AML Y2+2 5W measurements: Processor: Intel® Core™ i7-8500Y processor, PL1=5.0W TDP, 2C4T, Turbo up to 4.2GHz/3.6GHz, Memory: 2x4GB LPDDR3-
1866MHz, Storage: Intel® 760p m.2 PCIe NVMe SSD, Display Resolution: 1920x1080 for Performance; 25x14 eDP 13.3” for Power, OS: Windows 10 Build RS3 17134.112. SYSmark 2014 SE is
measured in BAPCo power plan. Power policy set to DC/Balanced mode for power. All benchmarks run in Admin mode, Graphics driver: driver:whl.1006167-v2.
Software and workloads used in performance tests may have been optimized for performance only on Intel microprocessors.
Performance tests, such as SYSmark and MobileMark, are measured using specific computer systems, components, software, operations and
functions. Any change to any of those factors may cause the results to vary. You should consult other information and performance tests to
assist you in fully evaluating your contemplated purchases, including the performance of that product when combined with other products.
For more information go to www.intel.com/benchmarks.

Performance results are based on testing as of date specified in the Configuration Disclosure and may not reflect all publicly available security
updates. See configuration disclosure for details. No product or component can be absolutely secure.

Optimization Notice: Intel's compilers may or may not optimize to the same degree for non-Intel microprocessors for optimizations that are not
unique to Intel microprocessors. These optimizations include SSE2, SSE3, and SSSE3 instruction sets and other optimizations. Intel does not
guarantee the availability, functionality, or effectiveness of any optimization on microprocessors not manufactured by Intel. Microprocessor-
dependent optimizations in this product are intended for use with Intel microprocessors. Certain optimizations not specific to Intel
microarchitecture are reserved for Intel microprocessors. Please refer to the applicable product User and Reference Guides for more
information regarding the specific instruction sets covered by this notice.

Intel technologies’ features and benefits depend on system configuration and may require enabled hardware, software or service activation.
Performance varies depending on system configuration. Check with your system manufacturer or retailer or learn more at intel.com.

Intel, the Intel logo, Intel Agilex, Intel Optane, Intel Xeon, and OpenVINO are trademarks of Intel Corporation or its subsidiaries in the U.S. and/or
other countries.

*Other names and brands may be claimed as the property of others.
© Intel Corporation.
You can also read