HealtH Policy Jacqueline Cumming - Victoria University of Wellington
←
→
Page content transcription
If your browser does not render page correctly, please read the page content below
Jacqueline Cumming

Health Policy
Introduction                                                                                   Health policy is one of the most
                                                                                               challenging for any government. Many
Improving health and well-being and promoting equity                                           more health needs could be met with
in outcomes are long-standing goals of New Zealand                                             new funding; indeed, the demand for
                                                                                               health care is virtually insatiable. There
governments (for example, Department of Health, 1989; King,                                    are significant inequities in health to
                                                                                               ameliorate. There are workforce shortages
2000; Ryall, 2007; Ministry of Health, 2016a, 2016b).1 New
                                                                                               and salary inequities to overcome. There
Zealand’s publicly funded health system delivers millions of                                   are demands for new technologies. And
                                                                                               there are rising demands for services
high-quality services each year to achieve these goals. Our                                    arising from ageing populations and
level of expenditure per capita on health care is slightly below                               a growing burden from long-term
                                                                                               conditions. These factors pressure
the OECD average, but our health care system provides good                                     governments every day to spend more.
                                                                                                   This article explores some key questions
overall health outcomes for the money we spend (OECD,                                          to ask of potential future governments in
2015). Both our life expectancy and health expectancy (the                                     relation to health policy in New Zealand.
                                                                                               First, I look at issues relating to the health
years we live in good health) are increasing, although the                                     of New Zealanders. Second, I discuss recent
former is increasing faster than the latter, leading to an                                     health expenditure trends. Third, I turn to
                                                                                               focus on how we are doing with respect to
increase in the number of years New Zealanders spend in                                        primary health care, an area that has been
                                                                                               at the forefront of New Zealand health
poorer health; a key challenge is to improve our quality of                                    policy debate in recent years. Finally, I draw
life as people age (Ministry of Health, 2017a). Sadly, however,                                some overall conclusions.

there are significant inequities in health, with Mäori, Pasifika                               Improving the health of New Zealanders
                                                                                               A first key question is how much
and lower-income people having poorer health than other
                                                                                               government funding is allocated to
New Zealanders (Ministry of Health, 2017a).                                                    health care as opposed to other areas. It
                                                                                               may well be that key gains in health will
Jacqueline Cumming is Director of the Health Services Research Centre and a Professor in the   come from spending outside the health
Faculty of Health at Victoria University of Wellington.                                        care vote. New Zealand needs to do better

Page 12 – Policy Quarterly – Volume 13, Issue 3 – August 2017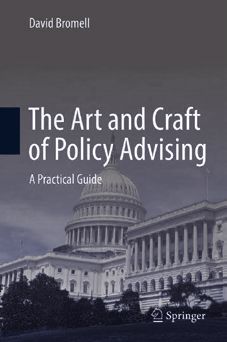
in initiatives to reduce poverty, support Figure 1: New Zealand Health Expenditure 1993-2018 $m
access to affordable healthy homes, 18000
reduce violence and improve education
outcomes, especially for specific groups 16000
16853
in the population. There is good evidence 16128
that spending in such areas can pay off in 14000 15058
14498
terms of improving health and potentially 13753
12000
reducing the demands on health care 12368
services over time (World Health
10000
Organization, 2013; Taylor et al. 2016). 10355
A second key question surrounds 8000 8813
government priorities within health care. 6573
7501
There is a tendency for those issues on 6000 6660
6573
the front pages of the newspapers to 5626
dominate our thinking. What is often 4000 4886
4168
missing, however, is a careful assessment
2000
of our current health status and its
distribution across the population, and a
0
clear outline of where key priorities lie.
10
12
14
16
18
94
96
98
00
02
04
06
08
11
13
15
17
93
95
97
99
01
03
05
07
09
20
20
20
20
19
19
19
20
20
20
20
20
20
20
20
20
20
19
19
19
19
20
20
20
20
20
Those contesting the election should
Source: New Zealand Institute of Economic Research and Victoria University, 2017
explain how they intend to tackle our key
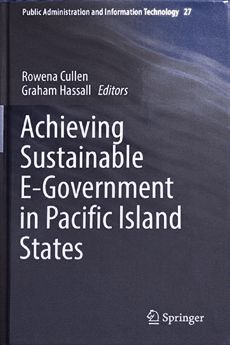
health concerns, such as mental health Figure 2: Real $NZ Per Capita Health Expenditure 1993-2018
issues (including suicide), cancers, 4,000
cardiovascular disease, diabetes,
musculoskeletal conditions, dementia, 3,500
injuries and oral health (Ministry of
$3,330 $3,277 $3,298
Health, 2017a). A number of these $3,254
3,000
$3,337
concerns have common underlying risk $3,191
$2,884
factors, including smoking, poor diet, 2,500 $2,659
$2,447
lack of physical activity and abuse of $2,351
$2,472
alcohol and drugs, alongside occupational 2,000 $2,174
$2,004
risks. These are issues that will take $1,859
1,500
sustained attention if we are to reduce
their impact over time (World Health
1,000
Organization, 2013; Taylor et al. 2016).
A third key question relates to
500
inequities in health. In 2012–14, life
expectancy at birth was 77.1 years for -
Mäori females and 73.0 years for Mäori
93
94
95
96
97
98
99
00
01
02
03
04
05
06
07
08
09
10
11
12
13
14
15
16
17
18
19
19
19
19
19
19
19
20
20
20
20
20
20
20
20
20
20
20
20
20
20
20
20
20
20
20
males, compared with 83.9 years for non- Source: New Zealand Institute of Economic Research and Victoria University, 2017
Mäori females and 80.3 years for non-
Mäori males. It was 78.7 years for Pasifika Trends in health care expenditure Victoria University (Figure 2) shows
females and 74.5 years for Pasifika males A fourth key question is how well trends in real (inflation-adjusted) health
(Statistics New Zealand, 2015). With governments are supporting our health care expenditure per capita in New Zealand,
respect to amenable mortality (premature system in terms of spending. New Zealand clearly demonstrating steady increases
death that could be avoided, given effective escaped the worst of the effects of the 2008 during the 2000s but a flatter profile since
and timely health care), Mäori have rates global financial crisis and our governments 2009/10.
2.7 times higher and Pasifika peoples have have continued to increase the funding Figure 3 shows the percentage increase
rates 2.4 times higher than the non-Mäori, available to health care (Figure 1). (or decrease) in real per capita health
non-Pasifika population (Ministry of But we have a growing population and expenditure year on year, showing a real
Health, 2017a). We should be challenging rising prices and simply focusing on total per capita decline in spending in 2010/11
potential future governments to be clear expenditure levels, as governments and 2014/15, and significantly lower
on what they intend to do to tackle such currently do, does not tell the full picture overall rates of growth in the 2010s than
inequities. In recent years there appears to of how far that spending will go. An in earlier years. The data show a lot of
have been little clear policy aimed at analysis of data by the New Zealand variability in increases year on year,
reducing such inequities. Institute of Economic Research and something that the sector no doubt
Policy Quarterly – Volume 13, Issue 3 – August 2017 – Page 13Health Policy
Figure 3: Year-on-Year Percentage Increase in Real Per Capita Health priority areas are being funded and to what
Expenditure 2000/01-2017/18 extent. And tracking performance against
8.00% these priorities – both at national and
district health board levels – is also no easy
6.38%
6.00%
task. There is no one place for New
5.35%
Zealanders to go to clearly see how our
4.43%
3.06% health system is performing over time. We
Percent increase in real per capita spending
4.00%
also cannot easily tell where we might be
1.17% getting less service than in the past. And
2.00% 0.91%
-0.54% even if there are increases in service delivery
in nominal terms, we need to examine the
0.00% increases in per capita terms, while
measures of unmet need, waiting times
-2.00% -1.25% -1.23% and other aspects of quality of care are also
important in gauging how well our system
-4.00% is doing in meeting needs. A single place
where we can go to get an overall sense of
-6.00%
the performance of the health system is
urgently needed to provide more
-6.70%
transparency in health policy.
-8.00%
2001
2002
2003
2004
2005
2006
2007
2008
2009
2010
2011
2012
2013
2014
2015
2016
2017
2018
A closer look at primary health care
Year
Since 2001 New Zealand has had a Primary
Source: New Zealand Institute of Economic Research and Victoria University, 2017
Health Care Strategy (King, 2001) which
aims to strengthen primary health care
struggles with in terms of planning, with 2015), Childhood Obesity (Ministry services, and deliver services ‘closer to
local peaks often around election years. of Health, 2017c)); home’: that is, in community settings such
Estimates by Infometrics for the New • specific programmes (e.g. the prime as general practice clinics, with general
Zealand Labour Party suggest that if cost minister’s youth mental health project practitioners, nurses, pharmacists, social
increases and increases in the population (Ministry of Health, 2017f), bowel workers and allied health professionals
had been fully funded since 2009/10, the cancer screening); increasingly working together to provide
sector would have an extra $2.342 billion • other general priorities identified in more ‘integrated’ care. A key reason for
in funding to support health services. an annual minister’s letter of emphasising primary health care is the
That funding, however, must come from expectations (e.g. improving quality, growth in the number of New Zealanders
somewhere and we need to ask ourselves health technology and workforce) living with longer-term conditions that
what we would have been prepared to give (Ministry of Health, 2017d); affect their health (such as cancer and
up for it to be allocated to health. • a new Systems Level Measures diabetes), requiring services that work
A fifth question is how, then, are performance framework, identifying more closely with people over time and in
resources allocated to key priorities within key targets for district health boards local settings.
the New Zealand health care sector? (e.g. reducing ambulatory-sensitive The strategy’s overall direction was
Unfortunately, getting a handle on hospitalisations for 0–4-year-olds; confirmed through changes of
priorities is not straightforward: reducing amenable mortality; babies government and ministers, in the form of
information on these is not often in smokefree homes) (Ministry of Better, Sooner, More Convenient in 2007
consolidated in one place. For example, Health, 2017e). (Ryall, 2007) and a ministerial review
New Zealand currently sets out the All the while, district health boards group report in 2009 (Ministerial Review
following as potential key priorities: have to ‘live within their means’: i.e. not Group, 2009), and most recently in a
• Better Public Service targets (State overspend their budgets (Ministry of ‘refreshed’ New Zealand Health Strategy
Services Commission, 2017); Health, 2017d). There is an urgent need to (Ministry of Health, 2016a, 2016b). The
• health targets (Ministry of Health, streamline the processes for signalling on minister of health’s most recent letter of
2017b); priorities and demonstrate how key expectations for district health boards
• a number of strategies (e.g. the New priorities and targets and the new Systems (2017/18) notes: ‘In particular, I want to
Zealand Health Strategy (Ministry of Level Measures framework relate to one see a strong focus on providing care in
Health, 2016a), Healthy Ageing another and to gains in health. the community and for services to be
(Associate Minister of Health, 2016)); Tracking expenditure within all these provided closer to home, especially for
• a number of plans (e.g. Living Well areas is not done in the New Zealand health the management of long-term
With Diabetes (Ministry of Health, care system, making it difficult to identify if conditions’ (Ministry of Health, 2017d).
Page 14 – Policy Quarterly – Volume 13, Issue 3 – August 2017New money for primary health care to funding for keeping fees low) and to 39.3%, with 48.8% of Mäori women
reduce the fees people pay when accessing support free services for those aged signalling issues with access. For those in
such services and to extend primary between 6 and 13 have supported primary the least well-off group (quintile 5) the
health care services was a feature of the health care services; but overall General total rate was 35.7%, and for women in
2000s (Cumming and Mays, 2011; Practice New Zealand finds a total that group 42.3%. Inability to obtain care
Cumming, Mays and Gribben, 2008). shortfall of $92.7m in funding between within 24 hours has become the most
Early research demonstrated some of the 2008/09 and 2015/16. common reason for lack of access, at
developments arising from the Primary Third, little new funding has been 17.5% of the population, the highest rates
Health Care Strategy, including extended made available to support further being among women aged 35–44 (29.3%)
services, and an increase in both GP and reductions in the fees charged for primary and Mäori women (27.2%). Unmet need
nurse consultations (Raymont and health care services. Consequently, fees for due to cost sits at 14.3% of the population,
Cumming, 2013). However, very little some people are now above the levels in with high rates for women aged 25–34
research is available examining more the early 2000s when the Primary Health (27.9%), Mäori women at 29.1%, Pasifika
recent progress (though see Lovelock et
al., 2014). Overall, this means that it
remains difficult to determine what Although New Zealand is achieving
progress is being made with respect to
primary health care in New Zealand. Here, gains in health, further progress is
I focus on several concerns.
First, an enhancement of primary
required in key areas. These include
health care services requires New reducing unmet need in key areas
Zealanders to understand the reasons for
change, including the increase in long- (such as mental health) and reducing
term conditions that we face and the need
for people to take some responsibility for
inequities in health.
their health and well-being. The distinct
roles of primary health care and hospital
services need debate and discussion. A Care Strategy was first introduced women at 25.7% and women in quintile 5
cynical public may well view the concept (Cumming and Gribben, 2007). Ministry at 24.4%. It is worth noting that the survey
of ‘closer to home’ as meaning fewer of Health data show that in very low-cost asks about at least one occasion on which
hospital services – and, more specifically, access-funded practices, between 2008 such unmet need existed. It may well be
fewer public hospital services – and people and 2017 fees have fallen for those aged 18 that some in the population experience
having to fall back on their own and and over by just over a dollar per visit, to a the problem multiple times in a year.
family/whänau resources when needing weighted average of $15.47, ranging from There are also high rates for unfilled
care. Much more attention needs to be $0 to $18.00 per visit. This is a bit lower prescriptions for Mäori (at 14.9%) and
given to engaging with New Zealanders than the averages in 2001 prior to the Pasifika (19.3%) and those in quintile 5
on the changes that are occurring in introduction of the Primary Health Care (12.9%) compared with the total
health care. Strategy. In other practices fees have gone population at 6.3%.
Second, we would expect a significant up on average by between $11.32 and Fifth, we would expect to find an
increase in the proportion of health care $13.45, around a 40% increase, and to a increase in the number of primary health
spending going to primary health care weighted average of $41.85 per visit, care consultations, and an increase in the
services in recent years, given their ranging from $0 to a high of $69 per visit. number of consultations with nurses and
emphasis in policy. However, analyses Fourth, these fee levels result in allied health professionals. According to
undertaken by General Practice New alarmingly high rates of unmet need for Ministry of Health data, the total number
Zealand show this not to be the case. In primary health care. Unmet need is of GP consultations has gone up by
2008/09, subsidies to support service user defined here as a person not being able to around 1.4m (11.87%) between 2008 and
access to first-contact primary health care access care when they felt they needed it 2016, while the number of nurse
services sat at 4.51% of Vote Health; they within the last 12 months. From recent consultations has increased by 1.87m
then fell each year to a low of 4.24% in New Zealand health surveys we can see (131.94%). The average number of GP
2015/16. General Practice New Zealand that, in total, 28.8% of New Zealanders consultations per person per year has
estimates an accumulated shortfall of noted such unmet need, with over 35% of increased from 2.9 in 2008/09 to 3 in
$139.5m over this time for first-contact women aged 25–34, 35–44 and 45–54, 2015/16, and the average number of nurse
primary health care services (personal Pasifika women and women in quintile 4 consultations has increased from 0.4 per
communication). Some increases in (the second most deprived of five person per year in 2008/09 to 0.7 in
funding for very low-cost access-funded quintiles) demonstrating unmet need. For 2015/16. The data also show, however,
practices (practices which get additional Mäori the total rate of unmet need was that higher health need groups (Mäori
Policy Quarterly – Volume 13, Issue 3 – August 2017 – Page 15Health Policy
and Pasifika peoples, and those on lower is improving health, and health system progress without ensuring that the fees
incomes) do not have a significantly outcomes: i.e. is it leading to the reductions that people pay remain affordable. New
higher mean number of GP visits (at 3 per in hospital service use that we expect? Zealand data suggest that funding is
annum) and have only a slightly higher Unfortunately, such analyses are not not moving to primary health care and
mean number of nurse visits (0.9 per available in New Zealand, leaving a major that our funding decisions continue to
annum for high needs groups compared gap in our understanding of the impacts support hospital care. New funding to
with 0.7 for non-high needs groups), of primary health care policy here. reduce the fees people pay when they use
suggesting that key barriers to access to primary health care services would help
primary health care services for these Conclusions encourage New Zealanders to better use
population groups in New Zealand remain Although New Zealand is achieving gains such services, but further investigation
a problem. The data also show what in health, further progress is required in is needed to understand why services
happens when fees reduce: those aged key areas. These include reducing unmet and funding may not be as quickly being
between 6 and 13 have had free care since need in key areas (such as mental health) moved into primary health care settings.
1 July 2015, and the average total (GP and and reducing inequities in health. We Finally, increased research and evaluation
nurse) consultation rate for those aged also need to be better at setting priorities around key policy changes in primary
5–14 has risen by 16.57% between 2014/15 – many new technologies are emerging health care are crucial if we are to be sure
and 2015/16. and we are not going to be able to afford that the ongoing focus on primary health
Finally, it is crucial is to understand them all. Much clearer information on the care is generating the improvements we
the overall impact of the new spending performance of the health sector would expect.
that has gone into primary health care help us all to judge how the sector is
1 Promoting the independence of people with disabilities is a
services, including whether service users doing. Although New Zealand (like other further goal. Issues relating to disability policy are beyond the
are more satisfied with access and the countries) is emphasising primary health scope of this article.
services they use, how new service delivery care services, we cannot make significant
References
Associate Minister of Health (2016) Healthy Ageing Strategy, Wellington: Zealand: report of the Ministerial Review Group, Wellington:
Ministry of Health Ministerial Review Group, retrieved from http://www.nzdoctor.co.nz/
Cumming, J. and B. Gribben (2007) Evaluation of the Primary Health media/6430/MRG%20Report%20Meeting%20the%20Challenge.pdf
Care Strategy: practice data analysis 2001–2005, Wellington: Health Ministry of Health (2015) Living Well with Diabetes: a plan for people at
Services Research Centre high risk of or living with diabetes 2015–2020, Wellington: Ministry
Cumming, J. and N. Mays (2011) ‘New Zealand’s primary health care of Health, retrieved from http://www.health.govt.nz/system/files/
strategy: early effects of the new financing and payment system for documents/publications/living-well-with-diabetes-oct15.pdf
general practice and future challenges’, Health Economics, Policy and Ministry of Health (2016a) New Zealand Health Strategy: future direction:
Law, 6 (1), pp.1-21 all New Zealanders live well, stay well, get well, Wellington: Ministry
Cumming, J., N. Mays and B. Gribben (2008) ‘Reforming primary health of Health
care: is New Zealand’s primary health care strategy achieving its early Ministry of Health (2016b) New Zealand Health Strategy: roadmap of
goals?’, Australia and New Zealand Health Policy, 5, article 24 actions: all New Zealanders live well, stay well, get well, Wellington:
Department of Health (1989) New Zealand Health Charter, Wellington: Ministry of Health
Department of Health Ministry of Health (2017a) Health and Independence Report 2016,
Infometrics (2017) ‘Core crown health expenditure since 2009/10 – May Wellington: Ministry of Health
2017’, https://d3n8a8pro7vhmx.cloudfront.net/nzlabour/pages/8181/ Ministry of Health (2017b) ‘Health targets’, retrieved from http://www.
attachments/original/1496806582/2017_Estimated_Core_Crown_ health.govt.nz/new-zealand-health-system/health-targets
Health_Expenditure__May_2017.pdf?1496806582 Ministry of Health (2017c) ‘Living well with diabetes’, retrieved from http://
King, A. (2000) The New Zealand Health Strategy, Wellington: Ministry of www.health.govt.nz/our-work/diseases-and-conditions/obesity/
Health childhood-obesity-plan
King, A. (2001) The Primary Health Care Strategy, Wellington: Ministry of Ministry of Health (2017d) ‘Minister’s 2017/18 letter of expectations’,
Health retrieved from http://nsfl.health.govt.nz/dhb-planning-
Lovelock, K., G. Martin, J. Cumming and R. Gauld (2014) The Evaluation package/201718-planning-package/supplementary-information-
of the Better, Sooner, More Convenient Business Cases in MidCentral 201718-planning-guidelines-1
and the West Coast District Health Boards, Wellington: Health Ministry of Health (2017e) ‘Systems level framework’, retrieved from
Research Council of New Zealand and Ministry of Health, retrieved http://www.health.govt.nz/new-zealand-health-system/system-level-
from http://www.victoria.ac.nz/sog/researchcentres/health-services- measures-framework
research-centre/publications/reports/BSMC-Final-Evaluation-Report-23- Ministry of Health (2017f) ‘Youth mental health project’, retrieved from
Mar-2015.pdf http://www.health.govt.nz/our-work/mental-health-and-addictions/
Ministerial Review Group (2009) Meeting the Challenge: enhancing youth-mental-health-project
sustainability and the patient and consumer experience within the New Zealand Institute of Economic Research and Victoria University
current legislative framework for health and disability services in New (2017) ‘Budget 2017 analysis of real per person spending shows real
Page 16 – Policy Quarterly – Volume 13, Issue 3 – August 2017winners and losers’, retrieved from http://www.victoria.ac.nz/ Statistics New Zealand (2015) ‘New Zealand period life tables: 2012–14’,
news/2017/05/budget-2017-analysis-of-real-per-person-spending- retrieved from http://www.stats.govt.nz/browse_for_stats/health/life_
shows-real-winners-and-losers expectancy/NZLifeTables_HOTP12-14.aspx
OECD (2015) Health At a Glance 2015 – OECD Indicators, Paris: OECD Taylor, L.A., A.X. Tan, C.E. Coyle, C. Ndumele, E. Rogan, M. Canavan, L.A.
Raymont, A. and J. Cumming (2013) Evaluation of the Primary Health Curry and E.H. Bradley (2016) ‘Leveraging the social determinants of
Care Strategy: final report, Wellington: Health Services Research health: what works?’, PLOS ONE, 11 (8), e0160217, doi:10.1371/
Centre, retrieved from http://www.victoria.ac.nz/sog/researchcentres/ journal.pone.0160217
health-services-research-centre/publications/reports World Health Organization (2013) The Economics of the Social
Ryall, H.T. (2007) Better, Sooner, More Convenient: health discussion Determinants of Health and Health Inequalities: a resource book,
paper, Wellington: National Party of New Zealand Geneva: World Health Organization
State Services Commission (2017) ‘Better Public Services 2012–2017’,
retrieved from http://www.ssc.govt.nz/better-public-services
SCHOOL OF GOVERNMENT NEW BOOKS
New Publication from Bridget Williams Books
Safeguarding the Future
Governing in an uncertain world
by Jonathan Boston, Victoria University of Wellington
In an era of populist politics, Brexit, Donald Trump, 24- governance’ might look like in New Zealand.
hour news cycles and perpetual election campaigning, Confronted with a world becoming more uncertain
how do we govern well for the future? How do we by the day, this book is essential reading for anyone
take the long view, ensuring that present-day policy questioning how democratic societies can tackle the
decisions reflect the needs and safeguard the interests unprecedented challenges ahead.
of future generations?
In this timely BWB Text, acclaimed policy This book can be ordered online from
scholar Jonathan Boston sets out what ‘anticipatory www.bwb.co.nz/books
New Publication from Springer
The Art and Craft of Policy Advising
A practical guide by David Bromell
This book offers a practical guide for policy advisors emotions and values; and the practice of ‘gifting and
and their managers, grounded in the author’s extensive gaining’ (rather than ‘trade-offs’) in collaborative
experience as a senior policy practitioner in central and governing for the long term. Theory is balanced
local government. with practical illustrations and processes, tools
The author introduces readers to a public value and techniques, helping readers master the art of
approach to policy advising that uses collective communicating what decision-makers need to hear, as
thinking to address complex policy problems; well as what they want to hear.
evidence-informed policy analysis that factors in The book can be ordered online from www.springer.com
New Publication from Springer
Achieving Sustainable E-Government
in Pacific Island States
Editors Rowena Cullen and Graham Hassall, Victoria University of Wellington
This book analyses the common set of obstacles notably Australia and New Zealand, both highly rated
to the development and integration of government in global rankings for e-government and active in a
Information and Communication Technology (ICT) variety of e-government development projects across
projects and effective e-government initiatives in the region.
developing countries. It draws on the expertise and
experience of more developed states in the Pacific, The book can be ordered online from www.springer.com
Policy Quarterly – Volume 13, Issue 3 – August 2017 – Page 17You can also read