Underpassing of Angel Underground by London Ring Main Extension Tunnel
←
→
Page content transcription
If your browser does not render page correctly, please read the page content below
Underpassing of Angel Underground by London Ring Main
                         Extension Tunnel
Benoît Jones, Senior Engineer, OTB Engineering, London, UK; e-mail: bjones@otbeng.com

ABSTRACT: This paper presents the predictions of movements, monitoring methods and measured movements of the
Angel Station Upper Escalator and the Northern Line London Underground tunnels during tunnelling for the Thames
Water Ring Main Extension Stoke Newington to New River Head (TWRM) tunnel. The earth pressure balance tunnel boring
machine was driven from a launch shaft in Stoke Newington in an approximately southerly direction to a reception shaft in
Islington, at depths of between 40 and 60 m. Along its route, the TWRM passed near to the Upper Escalator of Angel
London Underground station, the longest escalator in western Europe, and soon after passed underneath two operational
and one disused Northern Line tunnels. No discernible tunnel-induced movements of the escalator were observed. The
measured movements of the tunnels were within the conservative expected value predictions of volume loss, but the trough
widths were consistently narrower than expected.

KEYWORDS: Tunnels, tunnelling, underpassing, surveying, monitoring, TBM, EPB, ground movements

SITE LOCATION: IJGCH-database.kmz (requires Google Earth)

INTRODUCTION
The Thames Water Ring Main is a 2.5 m internal diameter tunnel that forms a closed loop around London conveying
potable water from water treatment works in the Thames Valley (Figure 1), in the southwest of London, to pump out shafts
all around London where the water is transferred to surface mains. The Stoke Newington to New River Head extension
tunnel will allow the transfer of water from Coppermills Water Treatment Works in the northeast of London into the
Thames Water Ring Main or the transfer of water from Thames Valley sources to Coppermills water treatment works in the
event of major treatment works failure at Coppermills.

The Stoke Newington to New River Head Thames Water Ring Main extension tunnel (from here on referred to as the
TWRM tunnel) is a 4.5 km long tunnel constructed at depths of between 40 and 60 m. The tunnel was constructed entirely
under urban areas and also passed under 13 third party tunnels along its route. This paper presents the results of monitoring
of the Angel Station Upper Escalator and the Northern Line tunnels during tunnelling.

TWRM TUNNEL CONSTRUCTION DETAILS

The Thames Water Ring Main (TWRM) tunnel was constructed from a launch shaft near the West Reservoir in Stoke
Newington to a reception shaft in the Thames Water New River Head compound in Amwell Street in Islington. The tunnel
route is shown in Figure 2. The tunnel is approximately 4.5 km long, with no intermediate shafts.

The TWRM tunnel was excavated by a Lovat Earth Pressure Balance (EPB) Tunnel Boring Machine (TBM). Foam and
water were injected into the face to condition the soil as it was excavated. Excavated spoil would pass through ports in the
face into a plenum chamber behind the cutterhead. It would then be withdrawn from the plenum by a screw conveyor. The
face pressure could be adjusted by varying the rate of spoil extraction from the plenum chamber and varying the speed of
the cutterhead rotation and ram thrust pressures.

 Submitted: 16 August 2010; Published: 28 March 2011
 Reference: Jones, B., (2011). Underpassing of Angel Underground by London Ring Main Extension Tunnel.
 International Journal of Geoengineering Case Histories, http://casehistories.geoengineer.org, Vol.2, Issue 2, p.105-126.
 doi: 10.4417/IJGCH-02-02-02.

                      International Journal of Geoengineering Case Histories ©, Vol. 2, Issue 2, p. 105
                                                                                    http://casehistories.geoengineer.org
Stoke Coppermills
New Tunnel WTW
Newington
Existing Tunnel
Shaft Barrow Hill
New River
Head
Holland Park
Avenue Park
Lane
Kew
Barnes Battersea
Mogden
Honor Oak
River Thames
Brixton
Ashford
Common Kempton
WTW Park WTW Streatham
Hampton WTW Merton
Raynes
Walton WTW Park
Hogsmill
N
Surbiton
Figure 1. Thames Water Ring Main - existing tunnels and tunnels under construction.
The excavated diameter was 3.362 m. In the tailskin of the TBM, a 180 mm thick steel fibre reinforced precast concrete
segmental lining was erected with an internal diameter of 2.85 m. Each 1 m long ring was composed of 6 trapezoidal
segments and held together by curved steel bolts at the radial joints and plastic ‘Buclock’ dowels at the circumferential
joints. Each ring had a 15 mm taper which meant that curves down to 300 m radius could be negotiated without the need for
packing and steering was aided by rotating the ring to change the position of the taper. Using only a 3 mm timber packer in
the circumferential joint enabled optimum gasket compression to be achieved at all times, improving watertightness of the
lining.
During TBM advancement, the annulus around the rings was grouted as they left the tailskin with accelerated cementitious
grout. The grout was prevented from running forward into the TBM by greased brushes on the inside of the tailskin. The
gel time of the grout was checked at least 4 times per day and the ring circularity was checked by the TBM Shift Engineer
as the rings left the tailskin using a laser distometer to verify that the rings were being adequately supported by the grout.
The spoil was loaded into 6 muck skips. For every 1 m advance in the Upnor Formation or Thanet Sand, 5.5 muck skips
would be filled. The muck volumes were recorded by the TBM Shift Engineers and they were instructed to immediately
report any over-excavation. In this way, the risk of over-excavation was mitigated.
After the TBM drive had finished, the tunnel was cleaned and then a secondary lining was installed. This consisted of a 125
mm thick in situ reinforced concrete lining designed to withstand internal water pressures up to 6 bar (60 m head). During
commissioning the tunnel will be pressure tested to 5 bar. The maximum working pressure during operation will be 3 bar.
International Journal of Geoengineering Case Histories ©, Vol. 2, Issue 2, p. 106
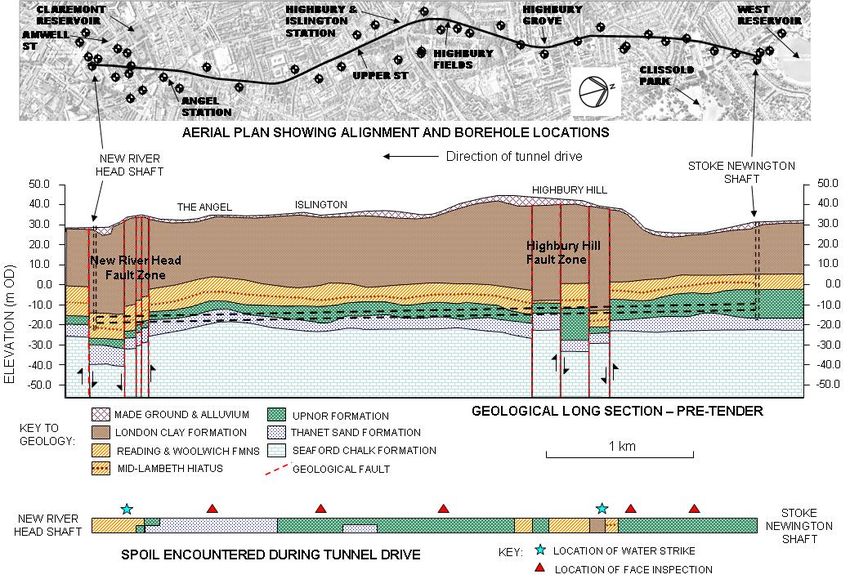
http://casehistories.geoengineer.orgThe predicted and encountered geology is shown in Figure 2 (Newman et al., 2010). In addition to pre-existing data, a total
of 28 rotary-cored boreholes were drilled for the site investigation, to depths up to 80 m below ground level. The cores were
used to identify the strata, and standpipes and piezometers were installed in the boreholes to monitor groundwater levels.
Low piezometric levels were found at the tunnel horizon, with head generally varying from 5 m below invert level to 2 m
above the crown. Localised peaks in groundwater pressure of 2-4 bar were found in isolated boreholes within the two major
structural fault zones at Highbury Hill and New River Head. In terms of laboratory testing, particle size distribution curves
and Atterberg limits were obtained to help identify strata and aid in the set up of the TBM.
Figure 2. Predicted and encountered geology (based on the work of Newman et al., 2010).
In the vicinity of Angel the TBM was mining through a mixed face of Upnor Formation and Thanet Sand, with strata gently
dipping to the south. The Northern Line tunnels are in a mixed face of Lower Mottled Clay and Woolwich Formation.
Therefore, between the crown of the TWRM tunnel and the invert of the Northern Line tunnels, there is the Upnor
Formation, a laminated stiff clayey sand/sandy clay, and then the Lower Mottled Clay, a very stiff fissured clay.
On its route south the TWRM tunnel passed near to the Upper Escalator of Angel Station and then underpassed the
Northern Line tunnels near the junction of Islington High Street and Pentonville Road approximately 4 km into the tunnel
drive (Figure 3, Figure 4, Figure 5 and Figure 6). At this location the depth to axis level of the TWRM tunnel was almost
52 m, making this a rare case study for a tunnel in clay.
The TWRM tunnel passed by the Upper Escalator’s Upper Machine Chamber (UMC) at around 19:00 on Wednesday
25/3/09 and passed by the Upper Escalator’s Lower Machine Chamber (LMC) at around 16:00 on Friday 27/3/09. The
TBM then stopped for the weekend 30 m away from the first of the Northern Line tunnels, the Southbound tunnel. It mined
continuously from 07:00 on Monday and crossed under the Southbound tunnel at 04:00 on Tuesday 31/3/09, the Disused
tunnel at 08:00 on Tuesday 31/3/09 and the Northbound tunnel at 17:00 on Tuesday 31/3/09.
International Journal of Geoengineering Case Histories ©, Vol. 2, Issue 2, p. 107
http://casehistories.geoengineer.orgFigure 3. Plan showing TWRM tunnel alignment and locations of the Angel Upper Escalator and Northern Line tunnels.
38.9m
Axis level
-17.66m 16.9m
TWRM Tunnel
Figure 4. Section showing the position of the TWRM tunnel relative to the Escalator Upper Machine Chamber.
International Journal of Geoengineering Case Histories ©, Vol. 2, Issue 2, p. 108
http://casehistories.geoengineer.org8.25m ID LMC
AXIS LEVEL +7.1m
18.5m
Axis level
-17.66m
36.9m
TWRM Tunnel
Figure 5. Section showing the position of the TWRM relative to the Escalator Lower Machine Chamber (LMC).
Ground level
Goswell Road
34.1m approx.
Southbound
Northbound Disused
Axis level Axis level Axis level
-2.116m -2.186m -1.798m
13.6m 5.9m
Axis level
-17.70m TWRM Tunnel
Direction of tunnel drive
Figure 6. Section showing position of TWRM relative to Northern Line tunnels.
International Journal of Geoengineering Case Histories ©, Vol. 2, Issue 2, p. 109
http://casehistories.geoengineer.orgANGEL UPPER ESCALATOR MONITORING
Predictions of Movements
The transverse settlement trough above a tunnel may be approximated by a Gaussian curve (Peck, 1969), that is, an inverted
normal distribution curve. The distance from the centreline to the point of inflexion of the curve, which in a normal
distribution would be the standard deviation, is known as the ‘trough width’, i. The maximum settlement over the centreline
of the tunnel Smax is analogous to the mean of a normal distribution. Settlement at offset y from the tunnel centreline is
given by:
(
S = S max exp − y 2 2 i 2 ) (1)
The area under the curve divided by the face area of the tunnel is defined as the ‘volume loss’. This may be given by the
following equation:
Vs = ∫
−∞
∞
S dy = ∫
−∞
∞
( )
S max exp − y 2 2i 2 dy = 2π i S max (2)
The trough width may be estimated by multiplying the height above the tunnel by the ‘trough width parameter’, K, which is
estimated by consideration of case histories. Trough width parameter, K, is related to trough width, i, by the following
equation:
i = K (z 0 − z ) (3)
where z0 is the depth to the tunnel under construction and z is the depth to the point of interest.
The predicted subsurface settlements at 0.5%, 1.0% and 1.5% volume loss and trough width parameter K of 0.45 are shown
in Figure 7 at the invert level of the Upper Machine Chamber of the Upper Escalator. These predictions were based on
greenfield ground movements and assume constant volume plane strain conditions, with movement vectors directed
towards the TWRM tunnel axis and a trough width varying linearly with depth (O’Reilly and New, 1982). The predicted
settlements at the West wall and East wall are summarised in Table 1 for volume losses equal to 0.5%, 1.0% and 1.5%.
The trough width parameter of 0.45 was based on case histories of tunnels in stiff clays (O’Reilly and New, 1982). Mair et
al. (1993) showed that trough width does not vary linearly with depth and subsurface settlement profiles could have trough
width parameters greater than 0.5, but the narrower and steeper-sided trough predicted using a trough width parameter of
0.45 was more conservative.
The values of volume loss used in the predictions of settlement were based on the contractor’s experience, and published
case studies of EPB TBM tunnels in similar geology. For instance, on the Docklands Light Railway Woolwich Extension
Project, which used an EPB machine in the Thanet Sand, an average volume loss of 0.3% was measured with a maximum
of 0.5%. Volume losses measured in the Central Line tunnels during construction of the CTRL, again using an EPB
machine through the Thanet Sand, were around 0.25% (Moss and Bowers, 2006).
The predicted subsurface settlements at 0.5% volume loss and trough width parameter K of 0.45 are shown in Figure 8 at
the invert level of the Lower Machine Chamber. The predicted settlements were less than 0.1 mm, even at 1.5% volume
loss.
Table 1. Predicted settlements at Angel Upper Escalator Upper Machine Chamber invert level.
1. Volume loss 2. Settlement at West wall * 3. Settlement at East wall **
0.5% 0.55 mm 0.35 mm
1.0% 1.10 mm 0.69 mm
1.5% 1.65 mm 1.04 mm
* 2. Settlement at West wall – 18.55 m offset from TWRM centreline.
** 3. Settlement at East wall – 27.32 m offset from TWRM centreline.
International Journal of Geoengineering Case Histories ©, Vol. 2, Issue 2, p. 110
http://casehistories.geoengineer.orgDistance f rom TWRM centreline (m)
-50 -40 -30 -20 -10 0 10 20 30 40 50
0
1
Settlement (mm)
2
3
Settlement prediction of UMC, Vl = 0.5%, K = 0.45
4
Vl = 1.0%, K = 0.45
Vl = 1.5%, K = 0.45
5
Location of UMC
Figure 7. Settlement predictions at 0.5%, 1.0% and 1.5% volume loss above the TWRM extension tunnel at the Upper
Escalator Upper Machine Chamber (UMC) invert level.
Distance from TWRM centreline (m)
-50 -40 -30 -20 -10 0 10 20 30 40 50
0
0.5
1
Settlement (mm)
1.5
2
Settlement
prediction of
2.5 LMC, Vl = 0.5%,
K = 0.45
3
Location of LMC
Figure 8. Settlement predictions above the TWRM extension tunnel at the Upper Escalator Lower Machine Chamber invert
level.
International Journal of Geoengineering Case Histories ©, Vol. 2, Issue 2, p. 111
http://casehistories.geoengineer.orgBack-Analysis of Surface and Subsurface Settlements Prior to TBM Arrival at Angel
Values of volume loss and trough width parameter K calculated from the surface settlement data are listed in Table 2. 14
single monitoring points were also installed along the centreline of the tunnel drive, and settlements varied between 0.0 and
2.1 mm. The surface settlement data indicated that the likely range of volume loss was 0.0 to 0.5%. The one array that
exceeded this, Array 2470, probably had up to 17 m of disturbed ground beneath it due to the presence of the Network Rail
Canonbury tunnel, a Victorian brick arch tunnel, which to one side of the TWRM alignment was constructed by the cut and
cover method and to the other side was bored. Visual inspections of the Canonbury tunnel indicated that it also behaved as
a drain on the ground above it, with significant volumes of water dripping onto the tracks from the crown.
The CTRL tunnels, which were underpassed earlier on in the tunnel drive (they are located under Highbury & Islington
Railway Station on Figure 2), were monitored in realtime using strings of tiltsensor beams. The Up line showed no
discernible movement so the volume loss was 0.0%. The Down line volume loss (Vl) was 0.29%, the maximum settlement
Smax was 1.4 mm and the trough width parameter K was 0.407. The conservative expected value of volume loss was
therefore taken to be 0.5%, with worst case values of 1.0% and 1.5% also used for comparison.
The trough width was not known with any certainty, since there was no published data for a tunnel underpassing at this
depth below the surface. The empirical relationship based on centrifuge tests and case studies of tunnels in clay proposed
by Mair et al. (1993) would predict a wider trough width than the one assumed using the method of O’Reilly and New
(1982). This would mean a smaller maximum settlement and smaller vertical and horizontal strains and angular distortions.
Therefore a prediction using the method of Mair et al. would be less conservative than the one adopted.
Table 2. Back-calculated surface settlement parameters.
1. Array 2. Volume loss Vs 3. Trough width 4. Maximum settlement 5. Depth to tunnel
reference parameter K Smax axis
Array 4500 0% Not measurable 0.0 mm 42.0 m
Array 4400 Unstable benchmark while TBM passing 39.1 m
Array 4300 0.5% 0.233 1.9 mm 38.5 m
Array 4100 % Not measurable 0.0 mm 37.9 m
Array 3975 0.12% 0.277 0.4 mm 38.2 m
Array 3060 0.52% 0.223 1.2 mm 58.5 m
Array 2800 0.23% 0.151 0.9 mm 58.8 m
Array 2470 0.67% 0.280 1.5 mm 54.1 m
Array 2150 0.33% 0.245 0.9 mm 50.9 m
Array 730 0.22% 0.343 0.4 mm 50.1 m
Array 530 Unstable benchmark while TBM passing 52.0 m
Monitoring Method
The Angel Station Upper Escalator was constructed in 1990 and is the longest escalator in Western Europe. The Upper
Machine Chamber of the Upper Escalator is a reinforced concrete box construction of internal dimensions 4 m x 6.77 m,
and 1 m thick walls (Figure 4). The closest wall of the Upper Machine Chamber to the TWRM tunnel is 16.9 m offset from
the extrados of the TWRM tunnel at axis level, and the invert of the Upper Machine Chamber is 38.9 m above the extrados
of the TWRM tunnel at the crown.
The escalator barrel of the Upper Escalator is lined with a 7.5 m ID ductile cast iron lining, with a flange thickness of 160
mm. It descends at 30°, the standard angle for escalators. The slope distance of the escalator is 54.85 m with a 27.5 m
change in level. Rather than plinths, each of the 3 escalator trusses is mounted on 2 concrete walls. Between and below the
3 escalators are 2 sets of concrete stairs for maintenance access (Figure 9).
The Lower Machine Chamber of the Upper Escalator is lined with an 8.25 m ID ductile cast iron lining, with a flange
thickness of 165 mm. The extrados at axis level of the Lower Machine Chamber is 36.9 m from the extrados at axis level of
the TWRM tunnel (Figure 5). The invert of the Lower Machine Chamber is 18.5 m above the crown extrados of the
TWRM tunnel.
International Journal of Geoengineering Case Histories ©, Vol. 2, Issue 2, p. 112
http://casehistories.geoengineer.orgFigure 9. View down the service stairs between escalator trusses.
The escalator was monitored by precise levelling using a Leica DNA 03 Precise Digital Level and an illuminated invar bar-
coded staff. Prior to each monitoring set the calibration of the level was checked and adjusted if necessary. Checks were
also made to ensure that the levelling staff ‘fish eye’ bubble was in adjustment. The Precise Levelling observation
measuring criteria was set as four sequential observations set at 0.03 mm acceptance level. PK survey nails were placed at 4
- 5 m centres down the concrete stairs between the escalators (Figure 9). This was the maximum distance between setups
that the headroom and slope angle would allow. The levelling run began at a benchmark (Survey Control Station 880/21 in
Figure 10) in the stairwell to the side of the Upper Machine Chamber, passed down one set of concrete stairs, went around
the Lower Machine Chamber and returned up the other set of stairs, closing the loop back at the benchmark (Figure 10). In
this way any rotation of the escalator barrel would be measured by a difference in level between monitoring points in the 2
staircases. The predicted repeatability of this method of surveying was ± 1 mm.
Results
The results presented in this paper are the differences between the levels measured during and after underpassing and the
mean of 2 base readings taken before the TBM entered the zone of influence. The levelling loop misclosures were all less
than ± 0.5 mm.
Since the Upper Escalator is very approximately parallel to the alignment of the TWRM tunnel, lines of points along the
length of the escalator should be affected by the tunnelling in sequence. Therefore the X-axis of the graphs show the nearest
TWRM tunnel chainage if a line was drawn from each monitoring point to meet the TWRM alignment at 90°, and the
position of the TBM cutterhead is also given in the legend for each set of readings. Note that the chainage on this project is
in reverse, i.e. as the TBM moves forward the chainage decreases. The alignment of the TWRM tunnel through this section
is straight. Table 3 gives the date, time and TBM position when each set of readings was taken.
Table 3. Date, time and TBM position for each set of monitoring readings in the Upper Escalator.
1. Set of readings 2. Date and time survey began 3. TBM cutterhead position
1 25/3/09 01:00 Ch. 625.5 m
2 26/3/09 01:00 Ch. 594.4 m
3 27/3/09 01:00 Ch. 569.3 m
4 30/3/09 01:00 Ch. 549.3 m
5 7/4/09 01:00 Ch. 378.0 m
6 14/4/09 01:00 Ch. 330.9 m
International Journal of Geoengineering Case Histories ©, Vol. 2, Issue 2, p. 113
http://casehistories.geoengineer.orgBenchmark
880/21
Entrance hall
Key:
Upper Machine Monitoring points
Chamber Benchmark
Lower
Machine
Chamber
Figure 10. Plan showing location of settlement monitoring points in the Angel Upper Escalator.
International Journal of Geoengineering Case Histories ©, Vol. 2, Issue 2, p. 114
http://casehistories.geoengineer.orgFigure 11 to Figure 16 show the 6 sets of readings taken as the TBM passed by the escalator. Figure 11 shows the vertical
displacements of the monitoring points along the West wall of the Upper Machine Chamber. Similarly, Figure 12 shows the
points along the East wall of the Upper Machine Chamber, Figure 13 shows the points along the West staircase of the
escalator barrel, Figure 14 shows the points along the East staircase of the escalator barrel, Figure 15 shows the points
along the West side of the Lower Machine Chamber and Figure 16 shows the points along the East side of the Lower
Machine Chamber.
Figure 11 and Figure 12 show no discernible movement trend. However, Figure 13 and Figure 14 show steadily increasing
settlement down the escalator culminating in approximately 1.3 mm of settlement in the Lower Machine Chamber, as
shown in Figure 15 and Figure 16. The figures show that there was no discernible twist of the escalator. Figure 17 shows all
the settlement data, plotted against TWRM chainage. This further illustrates the downward tilt of the whole escalator over
time.
The relative downward movement of the lower part of the escalator was too large to be explained by random error, given
the magnitude of the misclosures. It may be possible that a measurement error could be accumulated on the way down the
stairs to the Lower Machine Chamber that was reversed on the way back up the other side; but how this could occur is not
known. Negligible vertical displacement of the Lower Machine Chamber was predicted, even at high values of volume loss,
due to its lateral distance of nearly 40 m from the TWRM tunnel. The only other possible explanation, however, is that the
observed movement was induced by seasonal/thermal effects causing either an upward movement of the whole basement
structure that contains both the benchmark point and the Upper Machine Chamber, or a settlement of the invert of the
Lower Machine Chamber.
Since the observed movements were considered to be not induced by the tunnelling, monitoring was discontinued after Set
6. A continuation of monitoring may have led to an identification of the cause of the observed movements, but
unfortunately this could not be justified.
2
Set 1 TWRM at Ch.625.5m
1.5 Set 2 TWRM at Ch.594.4m
Set 3 TWRM at Ch.569.3m
Set 4 TWRM at Ch.549.3m
1
Set 5 TWRM at Ch.378.0m
Vertical displacement (mm)
Set 6 TWRM at Ch.330.9m
0.5
0
-0.5
-1
-1.5
-2
620 615 610 605 600 595 590
Monitoring point position perpendicular to TWRM Chainage (m)
Figure 11. Vertical displacements of monitoring points along the West wall of the Upper Machine Chamber.
International Journal of Geoengineering Case Histories ©, Vol. 2, Issue 2, p. 115
http://casehistories.geoengineer.org2
Set 1 TWRM at Ch.625.5m
Set 2 TWRM at Ch.594.4m
1.5
Set 3 TWRM at Ch.569.3m
Set 4 TWRM at Ch.549.3m
1
Set 5 TWRM at Ch.378.0m
Vertical displacement (mm)
Set 6 TWRM at Ch.330.9m
0.5
0
-0.5
-1
-1.5
-2
620 615 610 605 600 595 590
Monitoring point position perpendicular to TWRM Chainage (m)
Figure 12. Vertical displacements of monitoring points along the East wall of the Upper Machine Chamber.
2
Set 1 TWRM at Ch.625.5m
Set 2 TWRM at Ch.594.4m
1.5
Set 3 TWRM at Ch.569.3m
Set 4 TWRM at Ch.549.3m
1
Set 5 TWRM at Ch.378.0m
Vertical displacement (mm)
Set 6 TWRM at Ch.330.9m
0.5
0
-0.5
-1
-1.5
-2
600 590 580 570 560 550
Monitoring point position perpendicular to TWRM Chainage (m)
Figure 13. Vertical displacements of monitoring points on the West staircase of the escalator barrel.
International Journal of Geoengineering Case Histories ©, Vol. 2, Issue 2, p. 116
http://casehistories.geoengineer.org2
Set 1 TWRM at Ch.625.5m
Set 2 TWRM at Ch.594.4m
1.5
Set 3 TWRM at Ch.569.3m
Set 4 TWRM at Ch.549.3m
1
Set 5 TWRM at Ch.378.0m
Vertical displacement (mm)
Set 6 TWRM at Ch.330.9m
0.5
0
-0.5
-1
-1.5
-2
600 590 580 570 560 550
Monitoring point position perpendicular to TWRM Chainage (m)
Figure 14. Vertical displacements of monitoring points on the East staircase of the escalator barrel.
2
Set 1 TWRM at Ch.625.5m
Set 2 TWRM at Ch.594.4m
1.5
Set 3 TWRM at Ch.569.3m
Set 4 TWRM at Ch.549.3m
1
Set 5 TWRM at Ch.378.0m
Vertical displacement (mm)
Set 6 TWRM at Ch.330.9m
0.5
0
-0.5
-1
-1.5
-2
560 555 550 545 540
Monitoring point position perpendicular to TWRM Chainage (m)
Figure 15. Vertical displacements of monitoring points along the West side of the Lower Machine Chamber.
International Journal of Geoengineering Case Histories ©, Vol. 2, Issue 2, p. 117
http://casehistories.geoengineer.org2
Set 1 TWRM at Ch.625.5m
Set 2 TWRM at Ch.594.4m
1.5
Set 3 TWRM at Ch.569.3m
Set 4 TWRM at Ch.549.3m
1
Set 5 TWRM at Ch.378.0m
Vertical displacement (mm)
Set 6 TWRM at Ch.330.9m
0.5
0
-0.5
-1
-1.5
-2
560 555 550 545 540
Monitoring point position perpendicular to TWRM Chainage (m)
Figure 16. Vertical displacements of monitoring points along the East side of the Lower Machine Chamber.
Beginning of
SGI escalator Beginning of
Top of barrel Lower Machine
escalator Chamber
2
Set 1 TWRM at Ch.625.5m
1.5 Set 2 TWRM at Ch.594.4m
Set 3 TWRM at Ch.569.3m
Set 4 TWRM at Ch.549.3m
1 Set 5 TWRM at Ch.378.0m
Vertical displacement (mm)
Set 6 TWRM at Ch.330.9m
0.5
0
-0.5
-1
-1.5
-2
630 620 610 600 590 580 570 560 550 540
Monitoring point position perpendicular to TWRM Chainage (m)
Figure 17. Vertical displacements of all monitoring points in the Upper Escalator.
International Journal of Geoengineering Case Histories ©, Vol. 2, Issue 2, p. 118
http://casehistories.geoengineer.orgMONITORING OF THE NORTHERN LINE TUNNELS
Predictions of Movements
The predicted movements at the invert level of the Northern Line tunnels are summarised in Table 4, for a trough width
parameter K of 0.45. From previous experience using similar TBMs in similar ground conditions, the surface settlement
data and the CTRL underpassing data, the conservative expected value of volume loss was 0.5%. Values of 1.0% and 1.5%
were also used for comparison and as a worst case.
The extents of the predicted settlement troughs can be seen in Figure 18. The proposed limits of monitoring were 40 m
either side of the crossing centreline, in order to encompass enough distance either side of the trough to be sure the whole
trough had been measured. It also allowed for the possibility of a wider trough than predicted.
Table 4. Predicted maximum settlements of the Northern Line tunnels over the centreline of the TWRM tunnel.
3. Volume loss
1. Tunnel 2. Position 3. (a) 0.5% 3. (b) 1.0% 3. (c) 1.5%
Southbound Crown 2.1 mm 4.3 mm 6.4 mm
Invert 2.8 mm 5.5 mm 8.3 mm
Disused Crown 2.2 mm 4.4 mm 6.6 mm
Invert 2.9 mm 5.7 mm 8.5 mm
Northbound Crown 2.2 mm 4.4 mm 6.6 mm
Invert 2.9 mm 5.7 mm 8.5 mm
Distance from TWRM centreline (m)
-50 -40 -30 -20 -10 0 10 20 30 40 50
0
1
Settlement (mm)
2
Southbound, Vl =
0.5%, K = 0.45
3 Disused Tunnel, Vl =
0.5%, K = 0.45
Northbound, Vl =
0.5%, K = 0.45
4
5
Figure 18. Settlement predictions above the TWRM extension tunnel at the levels of each of the Northern Line running
tunnels.
International Journal of Geoengineering Case Histories ©, Vol. 2, Issue 2, p. 119
http://casehistories.geoengineer.orgMonitoring Method
The Northern Line tunnels were monitored by measuring changes in level of arrays of points installed in the concrete
trackbed. In each tunnel, 2 arrays of points were installed in the trackbed adjacent to the rails, as shown in Figure 19. In this
way, vertical displacement and twist of the tunnel could be monitored as the TBM passed underneath.
Levels were taken by a trigonometric leveling technique, using a Leica TCRA 1201 total station. The position of the
monitoring instrument was related to reference points located outside of the area of influence at both ends of the monitoring
array. A prism was then mounted over each point in turn and readings were taken of the absolute 3D position of the points.
The level repeatability of this system was predicted to be ± 1 mm, which was sufficient for determining whether the track
and structure tolerances of the asset owner had been exceeded.
Cross section 01 Southbound tunnel
Retro targets
Levelling points
Southbound to
Angel
Northbound to
King’s Cross Disused tunnel
Cross section 02
Northbound tunnel
Cross section 03
Monitoring cross sections
Figure 19. Location plan of monitoring points in the Northern Line tunnels.
In the interpretation of the results, it was found that the main source of error was in establishing the position of the
instrument. The repeatability of the monitoring point readings relative to each other was much better than the absolute
values and the results could be much improved by assuming the outermost points in each array were stable.
A cross-section array of points was also installed in each tunnel on the centreline of the TWRM tunnel crossing. These are
also shown on Figure 19. The points consisted of retro targets glued to the tunnel lining and readings were taken by the
total station. The retro targets could be placed using a specially adapted rod without the need for a stepladder or podium
steps.
Results
The results of the monitoring are shown in Figure 20 and Figure 21 for the Southbound tunnel, Figure 22 and Figure 23 for
the Disused tunnel and Figure 24 and Figure 25 for the Northbound tunnel. Maximum settlements of the 6 arrays in the 3
tunnels were very consistent at around 2 mm.
The maximum twist allowed in the Preparedness Plan as a variation in cross-level over 2 m was 11 mm for an amber
trigger. It can be seen by inspection of the ‘left rail’ and ‘right rail’ graphs that this trigger level was not exceeded.
The maximum twist allowed in the Preparedness Plan as a variation in cross-level over 10 m was 3 mm or 1 in 300 for an
amber trigger. There was no discernible difference between ‘left rail’ and ‘right rail’ levels, and since the maximum
settlement was less than 3 mm, it was impossible that this trigger level was exceeded.
International Journal of Geoengineering Case Histories ©, Vol. 2, Issue 2, p. 120
http://casehistories.geoengineer.orgSimilarly, the amber trigger level for change in cross level of marked cant averaged over 5 sleepers of - 4 mm or + 6 mm
(based on the latest TRV recording of track conditions) was not exceeded since there were no level changes of this
magnitude.
Changes in the vertical profile of the track were measured as the maximum deviation between levels on any rail, at 5 m
intervals. The amber trigger level was set at 3 mm based on the latest TRV data. This trigger level was not exceeded
because the maximum measured settlement was less than 3 mm.
Since there was little difference between levels either side of the rails in a given tunnel, and there were no increases in
settlement after the TBM was more than 40 m past the tunnels, the two sets of data for left and right rail were averaged for
each tunnel over the last 4 readings. A Gaussian curve was then fitted to the averaged data from each tunnel using the
statistical method described in Jones (2010), and these are shown on Figure 26. The Gaussian parameters relating to the
curves on Figure 26 are listed in Table 5.
Table 5 shows that the maximum movements were below the amber trigger level for structural distortion, which was set at
1% volume loss, and hence the status remained green.
Table 5. Gaussian curve parameters for the Northern Line tunnels.
2. Volume loss 3. Trough width 5. Average absolute
1. Tunnel 4. Maximum settlement Smax
Vs parameter K error in curve fitting
Southbound 0.43% 0.495 1.9 mm 0.13 mm
Disused 0.51% 0.564 2.0 mm 0.15 mm
Northbound 0.45% 0.510 1.9 mm 0.07 mm
5
-106m from array on 25-Mar-09 at 01:00
4
-5m from array on 31-Mar-09 at 01:00
32m from array on 01-Apr-09 at 01:00
3
61m from array on 02-Apr-09 at 01:00
188m from array on 10-Apr-09 at 01:00
2
188m from array on 16-Apr-09 at 01:00
Settlement (mm)
1 408m from array on 02-May-09 at 01:00
0
-1
-2
-3
-4
-5
-50 -40 -30 -20 -10 0 10 20 30 40 50
Offset from TWRM centreline (m)
Figure 20. Northern Line Southbound tunnel monitoring - left rail.
International Journal of Geoengineering Case Histories ©, Vol. 2, Issue 2, p. 121
http://casehistories.geoengineer.org5
-106m from array on 25-Mar-09 at 01:00
4
-5m from array on 31-Mar-09 at 01:00
32m from array on 01-Apr-09 at 01:00
3
61m from array on 02-Apr-09 at 01:00
188m from array on 10-Apr-09 at 01:00
2
188m from array on 16-Apr-09 at 01:00
Settlement (mm)
1 408m from array on 02-May-09 at 01:00
0
-1
-2
-3
-4
-5
-50 -40 -30 -20 -10 0 10 20 30 40 50
Offset from TWRM centreline (m)
Figure 21. Northern Line Southbound tunnel monitoring - right rail.
5
-112m from array on 25-Mar-09 at 01:00
4
-11m from array on 31-Mar-09 at 01:00
26m from array on 01-Apr-09 at 01:00
3
55m from array on 02-Apr-09 at 01:00
182m from array on 10-Apr-09 at 01:00
2
182m from array on 16-Apr-09 at 01:00
Settlement (mm)
1 402m from array on 02-May-09 at 01:00
0
-1
-2
-3
-4
-5
-50 -40 -30 -20 -10 0 10 20 30 40 50
Offset from TWRM centreline (m)
Figure 22. Northern Line Disused tunnel monitoring - left rail.
International Journal of Geoengineering Case Histories ©, Vol. 2, Issue 2, p. 122
http://casehistories.geoengineer.org5
-112m from array on 25-Mar-09 at 01:00
4
-11m from array on 31-Mar-09 at 01:00
26m from array on 01-Apr-09 at 01:00
3
55m from array on 02-Apr-09 at 01:00
182m from array on 10-Apr-09 at 01:00
2
182m from array on 16-Apr-09 at 01:00
Settlement (mm)
1 402m from array on 02-May-09 at 01:00
0
-1
-2
-3
-4
-5
-50 -40 -30 -20 -10 0 10 20 30 40 50
Offset from TWRM centreline (m)
Figure 23. Northern Line Disused tunnel monitoring - right rail.
5
-125m from array on 25-Mar-09 at 01:00
4
-25m from array on 31-Mar-09 at 01:00
12m from array on 01-Apr-09 at 01:00
3
41m from array on 02-Apr-09 at 01:00
168m from array on 10-Apr-09 at 01:00
2
168m from array on 16-Apr-09 at 01:00
Settlement (mm)
1 389m from array on 02-May-09 at 01:00
0
-1
-2
-3
-4
-5
-50 -40 -30 -20 -10 0 10 20 30 40 50
Offset from TWRM centreline (m)
Figure 24. Northern Line Northbound tunnel monitoring - left rail.
International Journal of Geoengineering Case Histories ©, Vol. 2, Issue 2, p. 123
http://casehistories.geoengineer.org5
-125m from array on 25-Mar-09 at 01:00
4 -25m from array on 31-Mar-09 at 01:00
12m from array on 01-Apr-09 at 01:00
3 41m from array on 02-Apr-09 at 01:00
168m from array on 10-Apr-09 at 01:00
2 168m from array on 16-Apr-09 at 01:00
389m from array on 02-May-09 at 01:00
Settlement (mm)
1
0
-1
-2
-3
-4
-5
-50 -40 -30 -20 -10 0 10 20 30 40 50
Offset from TWRM centreline (m)
Figure 25. Northern Line Northbound tunnel monitoring - right rail.
0.5
0
Vertical displacement
-0.5
-1
Northbound averaged data
-1.5 Gaussian fit Northbound
Disused averaged data
Gaussian fit Disused
-2 Southbound averaged data
Gaussian fit Southbound
-2.5
-50 -40 -30 -20 -10 0 10 20 30 40 50
Offset from TWRM centreline
Figure 26. Gaussian curve fit to the Northern Line tunnels data.
International Journal of Geoengineering Case Histories ©, Vol. 2, Issue 2, p. 124
http://casehistories.geoengineer.orgThe movements of the monitoring cross-sections after construction of the TWRM tunnel are shown in Figure 27 as
exaggerated vectors. The general pattern was a downwards movement of between 1 and 1.5 mm, with perhaps more
movement of the invert compared to the crown. This compares well with the predicted difference between invert and crown
movements in Table 4. The downward movements shown in Figure 27 are slightly smaller in magnitude than the values of
maximum settlement in Table 5. This is partly because the values in Figure 27 are related to the benchmarks whereas the
Table 5 values are, as mentioned previously, relative to the outermost points in the array. It may also be a function of the
repeatability of the measurements as the difference is a fraction of a millimetre.
Figure 27 shows that the maximum allowable out of circularity structural distortion in the Preparedness Plan of 19 mm was
not in danger of being reached.
Figure 27 also shows that there was no discernible change in lateral alignment of the tracks (amber trigger level was 3 mm
for the maximum variation between regular overlapping 10 m versines measured at 5 m intervals, based on the latest TRV
data).
Figure27. Movement of monitoring cross-sections in the Northern Line tunnels.
CONCLUSIONS
Precise leveling was used to monitor the Angel Station Upper Escalator during underpassing by the TWRM tunnel. The
measurements showed a very small downwards rotation of the lower end of the Upper Escalator. This was extremely
unlikely to have been caused by the TWRM tunnelling, and may have been due to measurement error or background
movement. There were no movements that could be ascribed to the TWRM tunnel construction.
The Southbound, Disused and Northbound Northern Line tunnels were monitored by points installed in the concrete
trackbed 40 m either side of the crossing location under Pentonville Road. The settlements measured in the 3 Northern Line
tunnels were very similar to each other in magnitude and shape, providing confidence in the consistency of the tunnelling
method and the monitoring method. The volume loss was close to the conservative expected value of 0.5%, varying
between 0.43 and 0.51%. The trough width parameter K was also reasonably consistent at between 0.495 and 0.564. This
was a higher value than 0.45, which is the value used in the prediction. The method of Mair et al. (1993) was not used as
predictions would have been less conservative in terms of maximum settlements, gradients and curvature.
The method of Mair et al. (1993) would have predicted K values between 0.896 and 0.910. These values were significantly
higher than the measured values of K. This was due to the way the relationship was formulated, as shown in Equation 4
below:
0.175 + 0.325(1 − z z 0 )
K=
1 − z z0 (4)
International Journal of Geoengineering Case Histories ©, Vol. 2, Issue 2, p. 125
http://casehistories.geoengineer.orgEquation 4 relates trough width parameter K to a ratio of depth to the subsurface point of interest z, to the depth to the axis
of the tunnel under construction z0. This ‘relative depth’ ratio z/z0 was shown to work well for tunnels at less than 35 m
depth. However, the TWRM tunnel was significantly deeper and therefore the relative depth made it seem the Northern
Line tunnels were very close to the TWRM tunnel, even though they were actually 5 or 6 tunnel diameters above. This may
have been due in part to the small diameter of the TWRM tunnel. A full discussion of the variation of trough width
parameter K with depth, based on the results of the Northern Line and CTRL monitoring, was given in Jones (2010).
The cross-section surveys on the crossing centreline showed minimal structural distortion of the tunnels. The pattern of
movements was characterized by a downward displacement that was of slightly greater magnitude at the invert relative to
the crown. This was in line with the general pattern of predicted movement.
ACKNOWLEDGMENTS
The author would like to thank Rachel Whiteman of Thames Water for giving permission for this paper to be published.
The contribution of many individuals on site to the successful construction of the tunnel is also acknowledged. In addition
the author would like to thank the Tube Lines outside party engineers Steve Holland and Phil Laurie for their help and
cooperation. The Northern Line monitoring was undertaken by Survey Associates Ltd, with special thanks to Grant Little
and Neil Yakes.
REFERENCES
Jones, B.D. (2010). “Low volume loss tunnelling for the Thames Water Ring Main Extension”. Proc. Instn. Civ. Engrs
Geotechnical Engrg 163(GE3), 167-185.
Mair, R.J., Taylor, R.N., and Bracegirdle, A. (1993). “Subsurface settlement profiles above tunnels in clay”. Géotechnique
43(2), 315-320.
Moss, N.A., and Bowers, K.H. (2006). “The effect of new tunnel construction under existing metro tunnels”. Proc.
Geotechnical Aspects of Underground Construction in Soft Ground, 151-157. London: Taylor & Francis Group.
Newman, T.G., Yuan, L.F.V., and O’Keeffe, L.C. (2010). “Using tunnel boring data to augment the geological model”.
Proc. Instn. Civ. Engrs Geotechnical Engrg 163(GE3), 157-166.
O’Reilly, M.P., and New, B.M. (1982). “Settlements above tunnels in the United Kingdom – their magnitude and
prediction”. Proc. Tunnelling ’82, IMM, London, 173-181. London: IMM.
Peck, R.B. (1969). “Deep excavations and tunnelling in soft ground”. Proc. 7th ICSMFE, Mexico, 1969, State of the art
volume, pp.225-290. Mexico: Sociedad Mexicana de Mecánica de Suelos.
NOTATION
i - trough width
K - trough width parameter
S - settlement
Smax - maximum settlement
Vs - volume loss
y - transverse offset from tunnel centreline
z - depth below ground level
z0 - depth to axis of tunnel under construction
International Journal of Geoengineering Case Histories ©, Vol. 2, Issue 2, p. 126
http://casehistories.geoengineer.orgThe International Journal of Geoengineering Case Histories
(IJGCH) is funded by:
Email us at journal@geoengineer.org if your company wishes to fund the International Journal of Geoengineering
Case Histories.You can also read