Technical Advisory Cell Summary of advice - 22 February 2021 - GOV.WALES
←
→
Page content transcription
If your browser does not render page correctly, please read the page content below

Technical Advisory Cell
Summary of advice
22 February 2021

© Crown copyright 2020

TAC ADVICE ONLY NOT WELSH GOVERNMENT POLICY
Technical Advisory Cell: Summary Brief
22 February 2021
The presence of the virus in Wales during the second wave continues to decline
(high confidence). The most recent estimate of the reproduction number (R t) for
Wales from SAGE is between 0.6 and 0.9. Testing data from Public Health Wales
and the Office for National Statistics (ONS) COVID-19 infection survey, indicate
that the positivity rate in Wales has decreased in the most recent week.
There are at least two SAR-COV-2 Variants of Concern (VOC) present in Wales.
As of 17 February, there were 2,631 genomically sequenced confirmed or
probable cases of VOC 202012/01 (the “Kent variant”, first identified in the UK)
in Wales. There were 17 confirmed or probable cases of VOC 202012/01 (the
variant linked to South Africa) and no cases of the variants linked to Brazil had
yet been identified in Wales.
When considering data collected from symptomatic and asymptomatic children,
it is very likely that the number of children who had COVID-19 declined over the
first six weeks of 2021 (high confidence). It will be important to monitor trends in
the coming weeks as more children return to school this week. An updated
summary of SAGE papers relevant to children is available later in this brief.
Modelling forecasts from TAG and SPI-M show that vaccination alone will not be
sufficient to control the epidemic unless vaccine effectiveness and coverage is
very high.
Adding to evidence from healthcare workers in Israel1 and the UK2, early
evidence from Public Health England suggests a greater than 50% reduction in
symptomatic cases in older vaccinees, including those in care homes, from
around 3 weeks after the first dose of Pfizer vaccine. Cases that do occur in older
vaccinated people are shown to be around as half as likely to lead to
hospitalisation and/or death. Further preliminary data from a cohort study of 5.4
million people in Scotland suggests that a single dose of the Pfizer and Oxford-
AstraZeneca vaccines resulted in substantial reductions in the risk of COVID-19
related hospitalisation.
1
Amit S, Regev-Yochay G, Afek A, Kreiss Y, Leshem E. Early rate reductions of SARS-CoV-2 infection and COVID 19
in BNT162b2 vaccine recipients. Lancet 2021, https://www.thelancet.com/journals/lancet/article/PIIS0140-
6736(21)004487/fulltext#:~:text=All%20HCWs%2C%20excluding%20those%20with,2%E2%80%937%20after%20
dose%20two.
2
Hall V, Foulkes S, Saei A, et al. Effectiveness of BNT162b2 mRNA vaccine against infection and COVID-19 vaccine
coverage in healthcare workers in England, multicentre prospective cohort study (the SIREN study).
https://papers.ssrn.com/sol3/papers.cfm?abstract_id=3790399
Page 2 of 30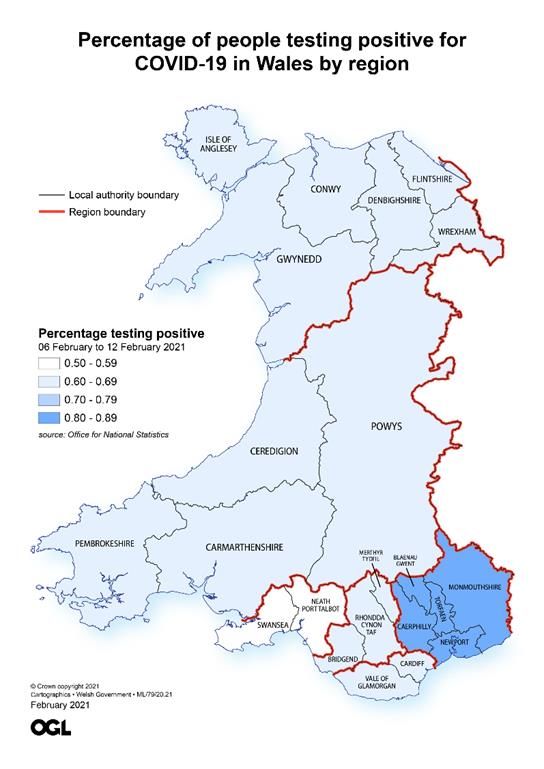
TAC ADVICE ONLY NOT WELSH GOVERNMENT POLICY
There is an ongoing need to monitor vaccine uptake and coverage. Whilst
numbers will be higher due to ongoing data entry, a total of 839,065 first doses
of COVID-19 vaccine have been given in Wales, with 25,433 people having
received two doses (as at 18 February). Vaccine refusals appear to be low,
however evidence is limited at present.
Survey data suggests greater vaccine hesitancy in younger adults, people with
fewer qualifications, people living in more deprived areas and some ethnic
minority groups. The reasons for refusals or hesitancy are complex and varied,
including distrust in vaccines, potential side effects and perceived low benefits.
Public Health Wales has reported emerging inequalities in COVID-19 vaccine
coverage with lower coverage in groups at increased risk of severe COVID-19
outcomes, including minority ethnic groups and those living in more deprived
areas. The reasons for these differences may relate to individual, community or
service characteristics.
Identifying both the likely effectiveness of the vaccine and areas of inequality
present an opportunity to address the challenges for groups who may be
otherwise disproportionately impacted as restrictions are relaxed.
As of 19 February, hospital occupancy and ICU occupancy continues to
decrease, but remains high. COVID-19 ICU admissions have been stable at
between 2 and 3 per day since 5 February. The number of people recovering
from COVID-19 is still at around 1,000 in the most recent week.
Deaths reported through Public Health Wales rapid surveillance have decreased,
but remain high at around 125 deaths per week. Deaths reported by ONS (as of
12 February), which lag rapid surveillance but are more complete, are around
216 per week, decreasing from 314 in the previous week.
Papers from SAGE considered by the Technical Advisory Cell are published
here. The Technical Advisory Group published an evidence paper on the
environmental risks associated with weddings.
Updates from SAGE
Exit scenarios and easing restrictions
SPI-M-O modelling papers and notes from SAGE 81 (18 February 2021) are
summarised below and published in full here.
As highlighted by SPI-M-O, “a minimum of three weeks after lifting one set of
restrictions is needed to determine whether it is safe to take the next step. The
Page 3 of 30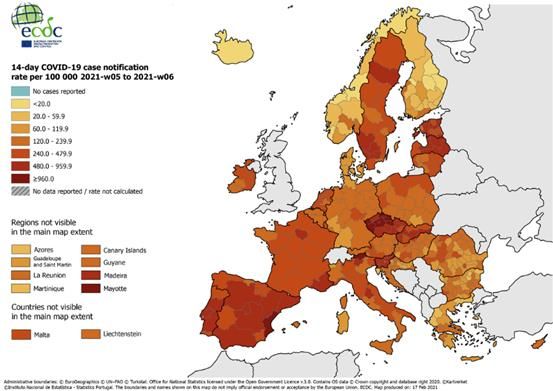
TAC ADVICE ONLY NOT WELSH GOVERNMENT POLICY
lower the prevalence when a relaxation step is taken, the more capacity and time
there would be to respond if it appears that relaxation of measures is leading to
an unsustainable rise in hospital admissions.”
Consistent with previous modelling, additional modelled scenarios show an
epidemic resurgence which results in a substantial number of hospital
admissions and deaths, though there are differences in the scale and timing (high
confidence).
The models suggest that allowing additional indoor mixing when prevalence is
higher and fewer people have been vaccinated would result in significantly higher
numbers of infections. If further mixing were to be allowed, risk would be reduced
if the mixing were limited to exclusive bubbles.
As previously advised, given uncertainties about the scale and timing of
resurgence, decisions about changes to restrictions are best made based on
epidemiological data rather than based on predetermined dates. Retaining a
baseline set of policies to reduce transmission after restrictions have been lifted
would reduce the scale of a resurgence (high confidence). Some of these policies
are likely to be needed in the longer term.
There will continue to be heterogeneity in the epidemic and therefore it is
important for careful monitor to continue at a local level.
Antibody prevalence in close-knit communities
Very high levels of seroprevalence shown in a study in a UK strictly-Orthodox
Jewish population show that where transmission is not well-controlled, a very
high proportion of the population can become infected. This is consistent with
findings from some university halls of residence and care homes in the UK, as
well as some international evidence.
Growth rate and Reproduction number
The Reproduction number (Rt) is the average number of secondary infections
produced by a single infected individual. Rt is an average value over time,
geographies, and communities. This should be considered when interpreting the
Rt estimate for the UK given the differences in policies across the four nations.
The estimate of Rt is shown as a range (90 or 95% confidence intervals) without
a central estimate and is a lagging indicator.
Page 4 of 30
TAC ADVICE ONLY NOT WELSH GOVERNMENT POLICY
The most recent estimate of the Rt for Wales from SAGE (as approved on 18
February) is predicted to be between 0.6 and 0.9 (90% confidence interval),
based on the latest data available up to 15 February.
Growth rate reflects how quickly the numbers of infections are changing day by
day. It is an approximation of the percentage change in the number of infections
each day. Growth rate is also a lagging indicator and shown as a range (90 or
95% confidence intervals) without a central estimate.
The current daily growth rate estimated by SAGE (as approved on 18 February)
is between -0.06 and -0.03 (90% confidence interval) in Wales, indicating that
infections could be shrinking by between -6% and -3% per day.
Public Health Wales also estimate Rt for Wales using data on the number of
positive cases only. These figures should be interpreted with caution as the
number of positive cases detected can be a reflection of the amount of testing. It
is assumed there is no change in testing patterns for the duration of these
estimates. As at 12 February, Rt (95% confidence interval) in Wales is estimated
to be 0.8 (0.8 to 0.8).
Care should still be taken when interpreting Rt and growth rate estimates for the
UK, due to their inherently lagged nature, testing availability and, as these figures
mask variation in the number of infections, how rates of transmission are
changing in some parts of the country.
Halving time
As at 16 February, Public Health Wales estimated the halving time (the time it
takes for the number of cases to half) to be 27 days, using data from 30/01/2021
to 12/02/2021 (see Figure below). The 95% confidence interval for this estimate
is between a halving time of 14 days and a doubling time of 706 days. It should
be noted that as the growth rate of cases tends to zero, the estimates of doubling
times tends to infinity.
Halving time (and Rt and growth rates), gives an indication of the rate of change
and therefore it should be treated with caution for the reasons outlined above.
International update
The map below shows the 14-day average notification rate per 100,000 people
in Europe. The UK is not included following the UKs departure from the European
Union.
Page 5 of 30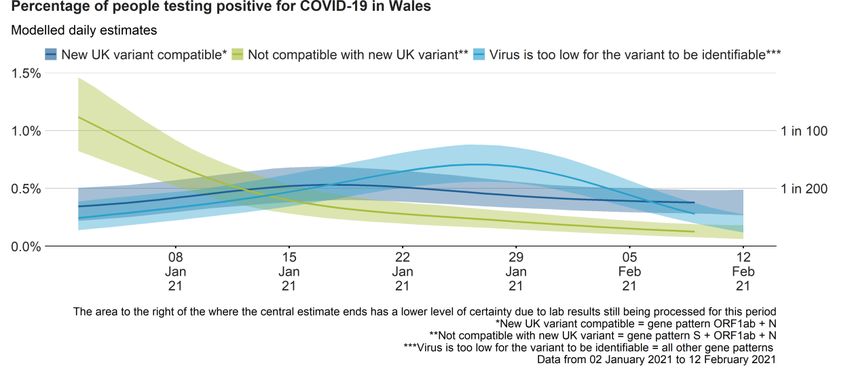
TAC ADVICE ONLY NOT WELSH GOVERNMENT POLICY
Cases continue to decrease across Europe and the world, but hospital
occupancy is still high in Europe. This decrease is due to continued restrictions
rather than vaccine roll out even though preliminary findings in Israel are
promising with over 30% of their population fully vaccinated. The next nearest to
Israel is America with almost 5% fully vaccinated.
Variant of Concern (VOC) 202012/01, first identified in the UK, is now verified in
88 countries, up from 83 last week.
The European Centre for Disease Control and Prevention (ECDC) highlights that
while a number of European countries have been reporting an overall decrease
in the incidence of COVID-19, likely due to a strong combination of public health
and social measures, the majority of countries in Europe continue to experience
high or increasing notification rates among older age groups and/or high death
rates. Moreover, among samples tested in Europe by PCR-based screening and
whole genome sequencing, the proportion of cases infected with VOC 202012/01
has increased in the past weeks, indicating community transmission in a number
of countries.3
VOC 202012/02 (first identified in South Africa) has been verified in 37 countries.
This has not changed from last week, however 9 countries are under
investigation which is 2 up on last week. VOC B.1.351 has now been reported
from in a total 46 countries, across all six World Health Organisation (WHO)
3
European Centre for Disease Prevention and Control, Risk assessment on COVID-19, 15 February 2021.
Available at : https://www.ecdc.europa.eu/en/current-risk-assessment-novel-coronavirus-situation
Page 6 of 30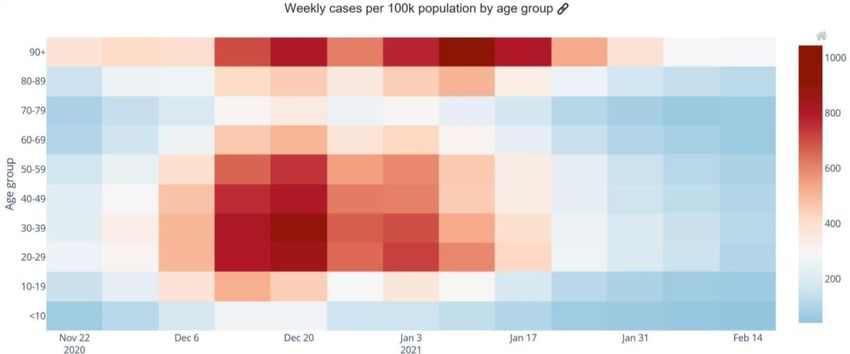
TAC ADVICE ONLY NOT WELSH GOVERNMENT POLICY
regions. Local transmission has been reported in at least 12 countries across
four WHO regions.
Data on the picture across Europe, including caveats around data lags and
variable testing policies is available here.
Case numbers
The figure below shows that numbers of confirmed COVID-19 cases per day (7
day rolling sum, per 100,000 of the population). Cases continue to show a
downward trend.
Source: Data from Public Health Wales as of 15 February
Age profile
The Figure below shows the number of confirmed COVID-19 episodes per
100,000 population, by week of sample collection and age group. The darker red
indicates an increased number of weekly cases.
According to Public Health Wales, during week 06, incidence decreased in most
age groups, with the exception of those aged 65-84 years where incidence was
stable. Incidence was highest in those aged 85+.
Page 7 of 30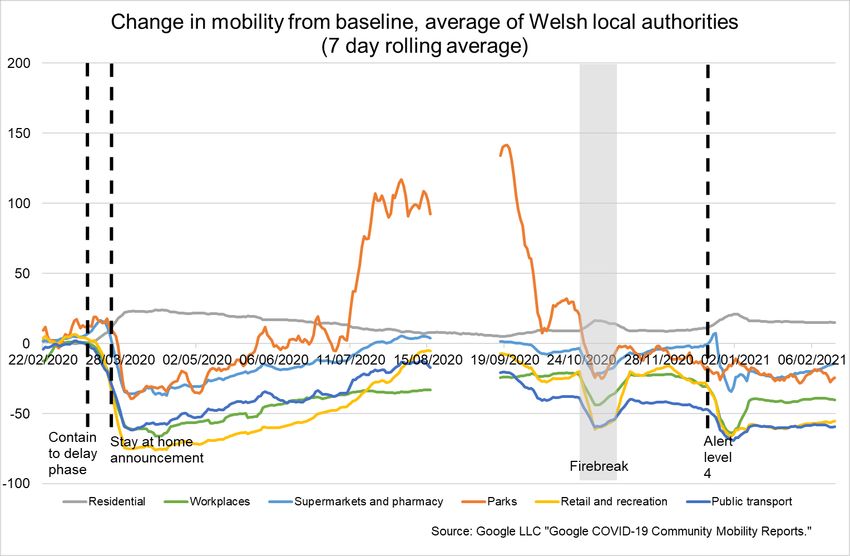
TAC ADVICE ONLY NOT WELSH GOVERNMENT POLICY
Source: Welsh Government dashboard, data from Public Health Wales as at 19
February.
Rates and estimates of coronavirus cases among children in Wales during early
2021
Confirmed case rates among children in Wales reduced during January 2021,
as they did for most other age groups, and have continued to decline slightly in
the first two weeks of February 2021. See Figure below for the number of cases
by age category (shown by the different coloured lines), per 100k population,
over the first six weeks of 2021.
Source: Welsh Government dashboard, data from Public Health Wales as at 15
February.
As can be seen from the figure above confirmed case rates have generally been
lower in 10-19 year olds, and particularly in 0-9 year olds, than in most other age
groups during this period, although as rates have come down overall there is now
less of a difference between rates in most age groups.
PHW’s published weekly schools report gives a more detailed breakdown of
confirmed case rates for children and young adults for the period to 17 February
Page 8 of 30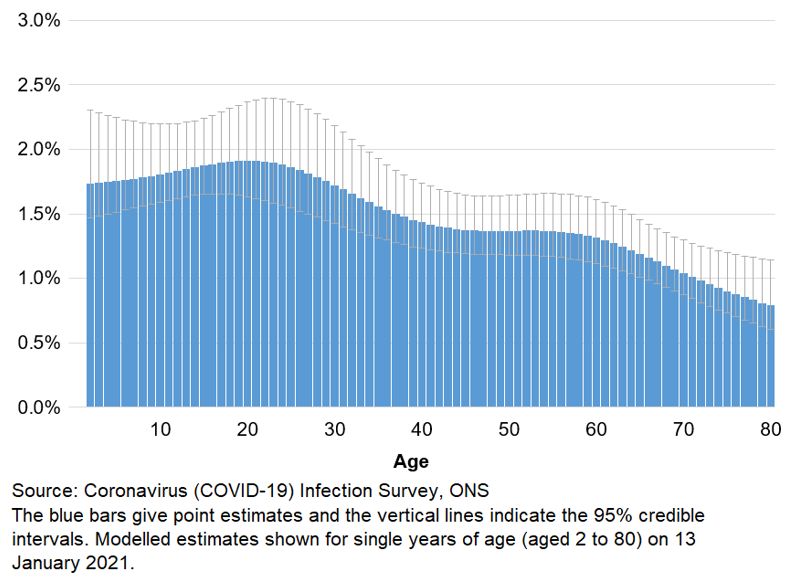
TAC ADVICE ONLY NOT WELSH GOVERNMENT POLICY
2021 (at figure 5, page 8).4 The confirmed case rates reflect testing of
symptomatic cases.
The ONS have also begun since 12 February to publish modelled estimates in
recent weeks of the percentage of the population in Wales that would have tested
positive for coronavirus, by age.5 The ONS Coronavirus (COVID-19) Infection
Survey data is used to estimate both symptomatic and asymptomatic cases.
The ONS estimates suggest that the percentage of positive cases among
children on 13 January was likely to have been relatively high compared to some
other age groups (although the 95% credible intervals overlap for most age
categories). See Figure below.
Estimates of the percentage of the population in Wales testing positive for the
coronavirus (COVID-19) by age on 13 January 2021
However the ONS estimates also indicate that the percentage of positive cases
would have fallen in all age groups between 13 January and 9 February 2021
including in children. See Figure below.
4
http://www2.nphs.wales.nhs.uk:8080/CommunitySurveillanceDocs.nsf/3dc04669c9e1eaa880257062003b246b
/4fca746dd30ee1cb8025861700309039/$FILE/Weekly%20COVID-19%20schools%20report.pdf
5
https://gov.wales/coronavirus-covid-19-infection-survey-6-12-february-2021-html
Page 9 of 30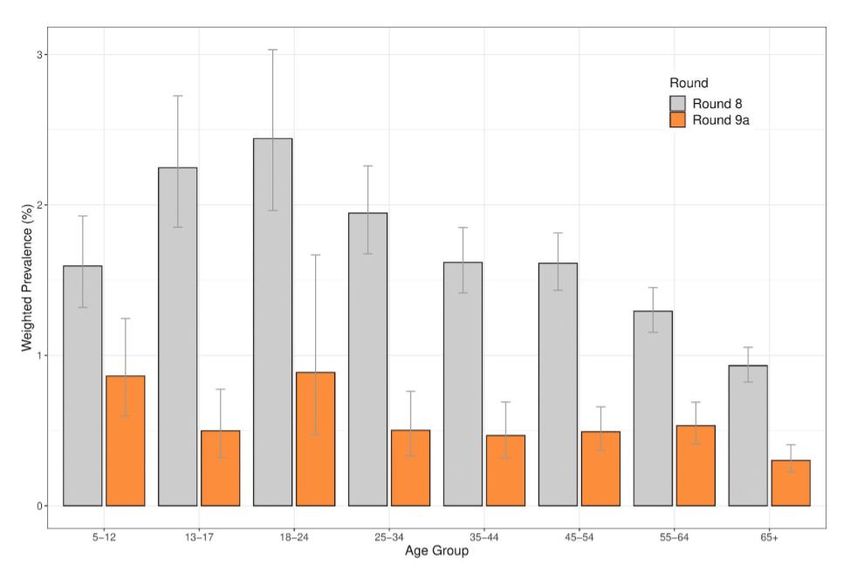
TAC ADVICE ONLY NOT WELSH GOVERNMENT POLICY
Estimates of the percentage of the population in Wales testing positive for the
coronavirus (COVID-19) by age on 9 February 2021
The ONS modelled estimates for age groups in Wales cannot be directly
compared with the ONS age analysis of the number of people who have had
COVID-19 in England for the same period, as a different approach has been
used.6 However the latest ONS age analysis for England similarly indicates that
the percentage of people testing positive in England has declined in all age
groups between 2 January 2021 and 12 February 2021, including among primary
school age children, secondary school age children and 16 – 24 year olds (see
Figure below).
Source: Coronavirus (COVID-19) Infection Survey, ONS7
6
They can however be directly compared with modelled estimates for Northern Ireland and Scotland .
7
https://www.ons.gov.uk/peoplepopulationandcommunity/healthandsocialcare/conditionsanddiseases/bulletin
s/coronaviruscovid19infectionsurveypilot/19february2021#age-analysis-of-the-number-of-people-who-had-
covid-19-in-england
Page 10 of 30TAC ADVICE ONLY NOT WELSH GOVERNMENT POLICY
The latest interim publication of REACT data for England, another survey which
seeks to estimate both symptomatic and asymptomatic cases, similarly
estimates that prevalence of COVID-19 infections fell among all age groups
between round 8 (covering 6-22 January 2021), and round 9a (covering 4-13
February 2021). See Figure below.
Weighted prevalence of swab-positivity by age groups for rounds 8 and
9a. Bars show 95% confidence intervals.
Source: REACT study, Imperial College London, 18 February 20218
Trends will need to be closely monitored as more children in Wales have begun
to return to face-to-face learning this week.
SAGE: Recent evidence on children, schools and transmission
SAGE has previously provided advice on children, schools and transmission
most recently in papers from SAGE meeting 65 on 4 November 2020 and SAGE
meetings 73 and 74, on 17 and 22 December 2020.
During January and February 2021, SAGE considered a number of papers on
these topics, which were published on 22 February 2021. Some key points from
these papers are summarised below.
8
https://spiral.imperial.ac.uk/bitstream/10044/1/86126/2/react1_r9_interim_preprint.pdf (figure 7)
Page 11 of 30TAC ADVICE ONLY NOT WELSH GOVERNMENT POLICY
Direct impacts of COVID-19 on children
As set out in an update to previous advice, evidence continues to suggest that
children are susceptible to COVID-19 infection, with primary aged children being
at lower risk of infection than older children (medium confidence). Children and
younger people (TAC ADVICE ONLY NOT WELSH GOVERNMENT POLICY
health of children and young people, with adolescents being particularly affected
(high confidence).9
Modelling of school re-opening across the UK
SPI-M’s consensus view on 27 January, and reaffirmed on 10 February, was that
the opening of primary and secondary schools is likely to increase effective R by
a factor of 1.1 to 1.5 (10% to 50%). This relative impact on R is highly sensitive
to assumptions on susceptibility and infectivity by age – particularly any
distinction between primary and secondary school-aged children.
The relative impact on R of schools opening for more on-site learning increases
as additional cohorts of children return to school. This largely results from
compounding the impact from other groups of pupils who have already returned.
Therefore, the risk is not linear and the groups which return latest may have the
greatest impact on R.
The consensus view was based on modelling of exploratory scenarios (which
also considered the impact of the ongoing vaccination programme), looking at
the position for England or the UK as a whole.10 SPI-M concluded on 27 January,
“These scenarios suggest that a partial return to school for some pupils may be
possible next month if R is currently, and remains, below 1 and the prevalence
of infection and hospital occupancy have demonstrably fallen and vaccines are
effective against transmission and people’s behaviours do not become riskier as
more of the population is vaccinated.” SPI-M noted that if changes are made
before prevalence and hospital occupancy reach low and sustainable levels, it
may risk immediate re-imposition of restrictions.
In their meeting on 11 February, SAGE also agreed that reopening schools
needs to be considered in the wider context. Opening schools will interact with
other NPIs, and affects the activities and behaviours of parents and other adults
as well as children. Targeting communications at adults about the risks
associated with these changes in behaviour could help people to reduce them.
At the same time SAGE noted that there are a number of uncertainties in the
modelling including the potential network implications of reopening schools, and
9
The conclusion, based on the SAGE, SPI-B and UK Government Department for Education paper on the
‘Benefits of remaining in education’ from 4 November 2020, also took into account a draft systematic review of
the impacts of school closures on the physical and mental health of children and young people, put online in
preprint on 12 February 2021.
10
Some of the modelling has been put online in preprint (CoMix, ‘The effect of school opening or closure on
social contacts in England from the CoMix social contact survey. Report for survey week 43b’ and ‘Estimating the
impact of reopening schools on the reproduction number of SARS-CoV-2 in England, using weekly contact survey
data’, last updated 15 February 2021) or on the SAGE webpages (Juniper consortium, ‘Impact of partial school
openings’, 10 February 2021) since the meetings when it was considered took place.
Page 13 of 30TAC ADVICE ONLY NOT WELSH GOVERNMENT POLICY
that a phased reopening would allow the effects to be assessed which would be
particularly valuable if schools were one of the first things to reopen, as there will
be more uncertainties in the early stages of releasing measures (e.g. around the
impact of vaccines).
The full papers discussed at SAGE are available here.
Covid-19 Infection Study results (Office for National Statistics)
Analysis of data from the ONS infection survey is helpful because it provides the
only estimates of infection covering asymptomatic as well as symptomatic cases,
and they are not affected by other factors such as testing capacity or the number
of people coming forward for testing. The results are for private households only
– the ‘community population’ – and do not apply to those in hospitals, care homes
or other institutional settings.
However there is a greater lag in data from the infection survey than from other
sources such as Public Health Wales. It is also important to stress the uncertainty
around these estimates. Since the survey picks up relatively few positive tests
overall, the results can be sensitive to small changes in the number of these
positive tests. The sequencing data from Public Health Wales for positive cases
may be more robust and less subject to a time lag, even though it generally only
includes people who have chosen to be tested.
Work is underway to understand the current differences between results from
the Covid Infection Survey and figures published by PHW.
Estimated positivity
For the week 6 to 12 February 2021, an average of 0.81% of the community
population had COVID-19 (95% credible interval: 0.66% to 0.97%).
This equates to approximately 1 person in every 125 (95% credible interval: 1 in
150 to 1 in 105), or 24,600 people during this time (95% credible interval: 20,100
to 29,400).
The positivity rate in Wales has continued to decrease in the most recent week.
The Figure below shows the latest estimates for positivity rates (%) since 2
January 2021 across the 4 UK Nations. There is some uncertainty around the
individual point estimates for the nations. Estimates for the last few days of the
series, shown as dashed lines in the chart below, have more uncertainty.
Page 14 of 30TAC ADVICE ONLY NOT WELSH GOVERNMENT POLICY
Source: Coronavirus (COVID-19) Infection Survey, ONS, 17/02/21
In Wales, there were decreases in cases not compatible with the new variant and
cases where the virus was too low for the variant to be identifiable. Cases
compatible with the new variant, did not decrease in the most recent week. See
Figure below.
Any cases of the South African variant would fall into the ‘clearly not compatible
with the new UK variant’ category, because cases compatible with the South
African variant would test positive on all 3 genes.
Source: Coronavirus Infection Survey, ONS, 17/02/21
Rates of positive cases vary by age, and appear to have decreased in all age
groups in recent weeks.
See here for full analysis from the ONS.
Page 15 of 30TAC ADVICE ONLY NOT WELSH GOVERNMENT POLICY
Regional analysis:
For the first time, regional modelled estimates are provided for Wales. Rates of
positive cases were highest in Caerphilly; Blaenau Gwent; Torfaen;
Monmouthshire and Newport between 6 and 12 February (see map below).
Source: Coronavirus (COVID-19) Infection Survey, ONS
Due to smaller sample sizes, there is a higher degree of uncertainty in estimates
for individual regions
Characteristics for people testing positive
Early analysis shows that for 25 occupations, the likelihood of testing positive for
COVID-19 at some time between 1 September 2020 and 7 January 2021 ranged
from 2.1% to 4.8.% and that the different occupations were largely distributed
uniformly across this continuum.
After adjusting for differences across occupations and reported ability to socially
distance in the workplace and work from home, there was no statistical evidence
of a difference in the likelihood of testing positive for the coronavirus (COVID-19)
between the majority of occupations. For nearly all occupations there is no
statistical evidence of difference with at least 15 of the other 24 occupation
groups.
During this period of time, there was a national lockdown in England between 5
November and 1 December 2020 and varying local tier restrictions in place; there
was also a significant rise in the positivity rate across the country, including that
Page 16 of 30TAC ADVICE ONLY NOT WELSH GOVERNMENT POLICY
related to the new variant. This analysis should be understood in that context as
opposed to the reducing prevalence currently being experienced.
The general contact individuals have with others both in and out of work will
contribute to their likelihood of testing positive. Within every occupation group,
there were people who were working from home, some who found social
distancing at work easy and those who found it hard. These factors in part explain
the differences in testing positive between occupations.
Further information on this analysis is available here.
Symptoms
There is no further update on symptoms. See here for latest symptoms profile
from the ONS.
Antibodies
There is no update this week as antibody data is updated fortnightly.
See here for Wales and here from the ONS.
Vaccination in Wales
As at 18 February, a total of 839,065 first doses of COVID-19 vaccine have
been given in Wales. 25,433 people have received two doses.
The actual number of doses will be higher due to ongoing data entry.
Vaccinations data, including coverage, is available from the PHW tableau.
Vaccine coverage
Public Health Wales have summarised equality in coverage of COVID-19
vaccination in Wales, from 8th December 2020 up to 14th February 2021, by sex,
socioeconomic deprivation and ethnic group. The report is available here.
There are emerging inequalities in coverage of COVID-19 vaccine in Wales.
The largest inequality in coverage was seen between ethnic groups in adults
aged 80+ years. Coverage for the combined Black, Asian, Mixed and Other
ethnic groups in this age-group was 71.5% compared to 85.6% in the White
Page 17 of 30TAC ADVICE ONLY NOT WELSH GOVERNMENT POLICY
ethnic group, a gap of 14.1%. The gap in coverage between these groups was
12.8% for adults aged 75 to 79 years, and 10% for adults aged 70 to 74 years.
Inequalities were also apparent between adults living in the most and least
deprived areas of Wales. In older adults, the inequality gap between those living
in the most deprived and least deprived quintiles of areas in Wales was 5.7%,
4.4% and 5.2% for adults aged 80y and older, 75 to 79 and 70 to 74 years
respectively.
Little difference was seen in uptake between those with a recorded sex of male
or female.
These inequalities show that vaccination coverage was lower in groups who are
at increased risk of severe COVID-19 outcomes.
The reasons for these differences may relate to individual, community or service
characteristics.
The programme is ongoing and coverage figures are not final, therefore there
remains opportunity to reduce inequities.
Vaccine hesitancy
The Understanding Society survey gathered data from over 12,000 people in the
UK in late November/early December. Overall, 82% of people said they were
likely or very likely to be vaccinated.
Vaccine hesitancy was higher in women (21.0% vs 14.7%), younger age groups
(26.5% in 16-24 year olds vs 4.5% in 75+) and less educated (18.6% no
qualifications vs 13.2% degree qualified). Vaccine hesitancy was particularly high
in Black (71.8%), Pakistani/Bangladeshi (42.3%), Mixed (32.4%) and non-
UK/Irish White (26.4%) ethnic groups. Fully adjusted models showed gender,
education and ethnicity were independently associated with vaccine hesitancy.
The main reason for hesitancy was fears over unknown future effects.
Page 18 of 30TAC ADVICE ONLY NOT WELSH GOVERNMENT POLICY
Source: Understanding Society survey, Robertson et al; 2021
The ONS Opinions and Lifestyle Survey found in early February that over 90%
of adults in GB said they had accepted or would accept the coronavirus vaccine.
This varied by age, with older age groups more likely to accept the vaccine. The
same survey found that less than 1% of people who had been offered the vaccine
had declined it.
In Wales, in the latest week, 8% of respondents to the fortnightly Public Health
Wales survey said they would not be vaccinated. Since the vaccine roll-out
began, the number of people answering no or saying they were unsure has been
falling. See figure below.
Page 19 of 30TAC ADVICE ONLY NOT WELSH GOVERNMENT POLICY
Would you personally be vaccinated?
40
No
35
Unsure
30
Per cent
25
20
15
10
5
0
7-13 21-27 5-11 19-25 2-8 Nov 14-20 4-10 Jan 18-24 1-7 Feb
Sept Sept Oct Oct Dec Jan
Week number
Source: ‘How are we doing in Wales?’ survey, Public Health Wales
The most common reasons given for responding ‘no’ or ‘unsure’ were related to
a lack of trust in the vaccines due to the speed of their development and unknown
side effects.
Other reasons included: not feeling a need to be vaccinated due to perceived low
risk; perceiving low benefit from vaccination; having insufficient information on
the vaccines; having existing health conditions such as allergies; having had bad
reactions to vaccines in the past; concern about impacts on fertility; having heard
about adverse reactions to the vaccines; and not agreeing with vaccinations in
general.
Deaths
The Figure below shows the 7 day rolling sum of COVID-19 deaths reported by
Public Health Wales rapid mortality surveillance as at 8 February. The weekly
number of deaths reported has decreased in the most recent week, but remains
high at over 100 per week. Care should be taken in interpreting the most recent
trends.
Page 20 of 30TAC ADVICE ONLY NOT WELSH GOVERNMENT POLICY
Source: Welsh Government dashboard, data from Public Health Wales as at 16
February
It is important to note that this data includes reports of a death of a hospitalised
patients in Welsh hospitals or care homes where COVID-19 has been confirmed
with a positive laboratory test and the clinician suspects COVID-19 was a factor
that caused death. It does not include patients who may have died from COVID-
19 but who were not confirmed by laboratory testing, those who died in other
settings, or Welsh residents who died outside of Wales. The true number of
deaths will be higher.
The Office for National Statistics (ONS) reports on both suspected and confirmed
COVID-19 deaths using data available on completion of the death registration
process and whilst subject to a time lag, is more complete.
Of the deaths registered in the week ending 12 February 2021, there were
provisionally 216 deaths involving COVID-19 registered in Welsh residents. This
was 28% of all deaths and 98 fewer than the previous week. The number of
registered deaths involving Covid has declined for four successive weeks.
Deaths have been above average since late September. However the lowest rate
of excess weekly deaths since October 2020 was reported in the most recent
week.
The Figure below shows ONS data of the number of deaths involving COVID-19
registered by week in Wales and the number of all cause deaths registered by
week from 28 December 2019 to 12 February 2021.
Page 21 of 30TAC ADVICE ONLY NOT WELSH GOVERNMENT POLICY
Source data: Office for National Statistics
Place of death
Most deaths involving COVID-19 registered up until 12 February occurred in
hospitals (72%), followed by care homes (22%).
Between Weeks 5 and 6, the number of deaths involving COVID-19 decreased
in all settings: hospitals (941 fewer), care homes (566 fewer), hospices (58
fewer), private homes (52 fewer), other communal establishments (8 fewer) and
elsewhere (4 fewer). Deaths involving COVID-19 in hospitals as a proportion of
all deaths in hospitals fell to 53.5% in Week 6 (58.0% in Week 5). Deaths
involving COVID-19 in care homes accounted for 37.8% of deaths, a decrease
from Week 5 (45.5%).See here for further information.
Further information on care home deaths from Care Inspectorate Wales is
available here. Please note these are provisional figures to help monitor the
impact of COVID-19. They are not comparable with data from Public Health
Wales.
Adherence and understanding of current measures
There is new data from IPSOS MORI this week. The results from Public Health
Wales are the same as last week.
Page 22 of 30TAC ADVICE ONLY NOT WELSH GOVERNMENT POLICY
The most recent IPSOS MORI data for the period 12 – 15 February for Wales
shows a similar picture to the last survey wave which was 2 weeks prior (29
January - 1 February). It should be noted that this is self-reported adherence and
will be affected by individuals understanding of the rules and the circumstances
that apply to them.
The figure below represents data collected online by IPSOS MORI as part of a
multi-country survey on the Global Advisor platform. Each of the waves has
included c.500 respondents in Wales. The sample is broadly representative of
the adult population aged 16-74. Data is weighted to reflect the age and gender
profile of the Welsh population aged 16-74. All samples have a margin of error
around them. For a sample of around 500, this is +/- 4.8 percentage points.
The latest results from the Public Engagement Survey on Health and Wellbeing
during Coronavirus Measures for the period 1 February – 7 February show that
53% of people say they understand the current restrictions in Wales ‘very well’.
A further 37% reported understanding the restrictions ‘fairly well’. The survey also
shows that 49% of people said they were following coronavirus restrictions
‘completely’ and a further 42% reported majority compliance, again similar to the
last two surveys and higher than in mid-December (before alert level 4 started).
20% reported having people outside their household/permitted extended
household come into their house, whilst 10% reported going into others people’s
houses, both of these are lower than in mid-December and similar to the last two
surveys.
Page 23 of 30TAC ADVICE ONLY NOT WELSH GOVERNMENT POLICY
Mobility
Mobility data for the third week in February (half term week) from Facebook
shows small reductions in mobility, whilst data from Apple shows increases. Data
from Google and O2 for the previous week in February also show a mixed
pattern, for example with increases in retail and recreation, but reductions in
workplaces. Levels of mobility continue to be mostly around the second week of
the firebreak.
Mobility of Facebook users in Wales shows movement was 28% below the
baseline for the week to the 19 February. This is lower than the week before
(27%). The percentage of users staying put (near to home) was 35%, higher than
the week before. The baseline is the average value, for the corresponding day of
the week, during the 4-week period 2 February – 29 February 2020.
Apple data for the week to the 20 February shows that requests for driving
directions in Wales were up from the previous week at 77% of the baseline (up
from 75%). Requests for walking directions and requests for public transport
directions increased from the previous week relative to the baseline. The
baseline is the 13th of January 2020.
The Google mobility data to the week of the 16 February for residential (i.e people
spending time at home) are similar to the week before at 15% above the baseline.
Workplaces were down slightly (at 40% below the baseline, down from 39%).
Retail & recreation mobility was up from last week (55% below the baseline, up
from 57%) whilst supermarkets & pharmacy show an increase (14% below the
baseline, up from 18%). Public transport and parks decreased over the week
relative to the baseline.
Page 24 of 30TAC ADVICE ONLY NOT WELSH GOVERNMENT POLICY
The figure below shows the change in mobility in Wales using Google mobility
data. The figures are based on the average of the local authorities that have data.
The baseline is the median value, for the corresponding day of the week, during
the 5-week period Jan 3–Feb 6, 2020. The data for several categories is not
available for August 17th – September 10th due to the data not meeting quality
thresholds.
Anonymised and aggregated mobile phone data from O2 for the week to the 12
February shows an increase in trips compared to the week before. Trips starting
in Wales rose by 1 percentage point to 56% of the baseline. The baseline for the
O2 data is the same day of the week in the first week of March.
Research
There are currently 12,225 Welsh patients recruited to COVID-19 urgent public
health studies, an increase of 254 since last report.
COVID-19 weekly surveillance and epidemiological summary from Public Health
Wales
As at 18 February
The proportion of calls to NHS 111 and NHS Direct related to possible COVID-
19 symptoms decreased compared to the previous week.
Page 25 of 30TAC ADVICE ONLY NOT WELSH GOVERNMENT POLICY
Overall GP consultations for any Acute Respiratory Infection (ARI) and
suspected COVID have decreased this week compared to the previous week.
The number of ambulance calls possibly related to COVID-19 increased in the
most recent week compared to the previous week.
The all-Wales number of lab confirmed COVID-19 episodes has continued to
decrease in the most recent week. Sample positivity for testing episodes was
7.6% in week 06.
During week 06, incidence decreased in most age groups, with the exception of
those aged 65-84 years where incidence was stable. Incidence was highest in
those aged 85+.
Confirmed case incidence and testing episode positivity has decreased in most
regions of Wales in recent weeks, with the exception of Powys which has
increased and Swansea Bay UHB which remains stable compared to the
previous week.
At a national level, confirmed case admissions to hospitals and confirmed cases
who are inpatients in hospital decreased compared to the previous week. In the
most recent week, admissions to critical care wards decreased compared to the
previous weeks.
Recent surveillance data suggest that COVID-19 infections in Wales are
decreasing in most regions of Wales. Cases remain geographically widespread,
however the majority of local authority (LA) areas are seeing decreasing overall
trends in confirmed case incidence in the most recent week.
There is an overall decreasing trend in incidents reported in recent weeks, with
care homes still accounting for the highest proportion.
Most school pupils are currently being taught online, with some face-to-face
learning for vulnerable children and children of critical workers. Schools
surveillance information is available on the Public Health Wales dashboard.
VOC 202012/01 (VOC1, identified in Kent) has been detected in all parts of
Wales. Although overall confirmed case incidence is declining, the proportion
accounted for by VOC1 has increased to between 63% and 100% (identified by
the proxy indicator SGTF) across Health Boards. 2,631 genomically probable or
confirmed cases have been identified as of 17/02/2021. There have been 17
genomically confirmed and probable cases of VOC 202012/01 (the variant linked
to South Africa) in Wales (as of 17/02/2021). No cases of the variants linked to
Brazil have yet been identified in Wales.
Page 26 of 30TAC ADVICE ONLY NOT WELSH GOVERNMENT POLICY
All-cause deaths are higher compared to the 5 year average, but have decreased
in the most recent week.
Deaths in confirmed cases in hospital, reported through PHW mortality
surveillance decreased in the most recent week.
In deaths where information is available from PHW rapid mortality surveillance,
chronic heart disease, diabetes and chronic respiratory disease are the most
commonly reported risk factors (in 34%, 28% and 22% of deaths respectively).
Influenza is not currently circulating in Wales.
Local authority analysis from Public Health Wales
(Period covering 07 to 13 February 2021)
All local authorities are in the highest threshold for 7-day incidence (> 50 per
100,000) and test positivity (>5%), apart from Ceredigion and Pembrokeshire
which are the lower bracket of 25 toTAC ADVICE ONLY NOT WELSH GOVERNMENT POLICY
The Figure below shows the confirmed COVID-19 intensive care unit (ICU)
occupancy over the first and second wave of the pandemic (7 day rolling
average, as at 17 February).
As of 19 February the number of people with confirmed COVID-19 in hospital
has decreased over recent weeks, but remains high and just below the April
peak. Both overall ICU occupancy (COVID-19 and non-COVID-19 patients) and
occupancy for COVID-19 patients only have shown a steady decline over but
remain high. The number of people recovering from COVID-19 is high, still at
around 1,000, in the most recent week.
When considering data on capacity (203 beds) and occupancy (165 beds)
reported to us by local health boards, Level 3 ICU across Wales is approximately
81% occupied with both COVID and non-COVID patients (as of 19 February).
However, there are normally approximately 152 critical care beds (Level 3 ICU
equivalent) and so hospitals are creating additional critical care bed capacity due
to increased demand. Therefore, critical care units in Wales are at or over 100%
occupied for their normal critical care capacity and 1:1 nursing staffing ratio for
all critical patients may not possible for many patients, even with non-critical care
staff helping to care for patients.
The Figure below shows the total number of people who have tested Covid-19
positive and are in ICU in hospitals across the different health boards in Wales.
Data as of 19 February.
Page 28 of 30TAC ADVICE ONLY NOT WELSH GOVERNMENT POLICY
The Figure below shows the number of people admitted to hospital and are either
suspected (SUS) or confirmed as having Covid-19 (COV+). The purple line
represents the total number over a rolling 7 day average, whilst the fainter grey
lines show the actual figures at that time. Data as of 19 February.
The Figure below shows the number of hospital discharges of people who are
either suspected (SUS) or confirmed as having Covid-19 (COV+). The purple line
represents the total number over a rolling 7 day average, whilst the fainter grey
lines show the actual figures at that time. Data as of 19 February.
The Figure below shows patients admitted to the intensive care units and are
either suspected (SUS) or confirmed as having Covid-19 (COV+). The purple line
represents the total number over a rolling 7 day average, whilst the fainter grey
lines show the actual figures at that time. Data as of 19 February.
Page 29 of 30TAC ADVICE ONLY NOT WELSH GOVERNMENT POLICY
Professional Head of Intelligence Assessment (PHIA) probability yardstick
Where appropriate, TAC advice will express Likelihood or confidence in the advice
provided using the PHIA probability yardstick to ensure consistency across the different
elements of advice.
Page 30 of 30You can also read