Characterization of the droplet temperature in sprays using laser-induced fluorescence and time-correlated single-photon counting
←
→
Page content transcription
If your browser does not render page correctly, please read the page content below
ICLASS 2021, 15th Triennial International Conference on Liquid Atomization and Spray Systems, Edinburgh, UK, 29 Aug. - 2 Sept. 2021

 Characterization of the droplet temperature in sprays using laser-induced
 fluorescence and time-correlated single-photon counting
 Yangpeng Liu1,2, Stiti Mehdi1, Castanet Guillaume*1, Chaynes Hadrien1, Lemoine Fabrice1,
 Xishi Wang2
 1
 Université de Lorraine, CNRS, LEMTA, F-54000, Nancy, France
 2
 State Key Lab. Of Fire Science, University of Science & technology of China, Hefei 230026,
 P.R. China

 *Corresponding author email: guillaume.castanet@univ-lorraine.fr

 Abstract
 The objective is here to develop a measurement technique based on laser-induced
 fluorescence lifetime (LIF). Measuring the fluorescence lifetime is a promising alternative to
 conventional approaches based on the intensity of the fluorescence signal. Given that the
 fluorescence lifetime is inversely proportional to the fluorescence quantum yield, it is
 dependent on temperature in the same manner as the intensity of the fluorescence signal.
 Intensity-based fluorescence do not yield absolute quantities and always require a reference
 to determine the temperature. Moreover, they are made complicated by the the fluorescence
 signal from a droplet which varies with many parameters in addition to the temperature such
 as the droplet size, the droplet position with respect to the laser beam and detector, the droplet
 shape. In contrast, measuring the lifetime by a technique either in the time-domain or in the
 frequency-domain provides directly an absolute measurement. In this study, the time-
 correlated single-photon counting (TCSPC) is applied for measuring the temperature in water
 sprays. The study of the evolution of the fluorescence lifetime of kiton Red allow us to
 determine a good solution to obtain the better accuracy in temperature.
 Keywords: Laser Induced fluorescence, Spray, Cooling

 Introduction
 The characterization of the droplet temperature in polydisperse sprays is an important
 challenge in many engineering applications. While the size and velocity of droplets can be
 measured using relatively widespread and well-established techniques, characterizing the
 temperature remains quite challenging (Lemoine and Castanet 2013). Laser-induced
 fluorescence (LIF) offers unprecedent temperature sensitivities. Examples of application
 include droplets spreading onto solid surfaces (Chaze et al. 2017), mono and multi-component
 fuel droplets combusting and evaporating in high-temperature environments (Perrin et al.
 2015), supercooled droplets in icing processes (Stiti et al. 2019). Usually, an organic dye is
 dissolved into the liquid prior to its injection. The droplets are illuminated by a laser beam with
 an appropriate wavelength to allow light absorption by the fluorescent molecules which emit
 in return a fluorescence signal depending on the temperature by some of its properties
 (intensity, wavelength, lifetime). A few dyes, such as rhodamine B or kiton red (KR), have
 been used so far for temperature measurement in water solutions. Besides a high dependency
 of their fluorescence signal on temperature, these dyes have remarkably high absorption cross
 sections and high quantum fluorescence yields, which is advantageous for the implementation
 of the measurements.
 Measurements are usually based on the intensity of the fluorescence signal. However, the
 intensity does not provide an absolute quantity and in spray, the fluorescence intensity from a
 droplet depends on many parameters in addition to the liquid temperature such as the droplet
 size, the droplet position with respect to the laser beam and the detector, the concentration in
 dye for evaporating droplets. As a result, it is generally unavoidable to use intensity ratios i.e.,
 to measure the intensities of the fluorescence signal in two spectral bands which are divided
 by each other. However, this approach can suffer from several sources of error as reported
ICLASS 2021, 15th Triennial International Conference on Liquid Atomization and Spray Systems, Edinburgh, UK, 29 Aug. - 2 Sept. 2021

 (Labergue et al. 2010, 2012) due to the polydispersion in droplet size and multiple light
 scattering by the droplets which induces a significant out-of-field fluorescence.
 As an alternative, measuring the fluorescence lifetime provides a direct means to access to
 an intrinsic parameter that is related to the key mechanisms of the fluorescence cycle, namely
 the fluorescence lifetime. The latter is closely dependent on the quenching rate of the
 fluorescence by collision with solvent molecules and therefore on the temperature. Contrary
 the fluorescence intensity, the lifetime value is not dependant on the measurement method
 and system,. Measurements will require a single dye and a single spectral detection band.
 The aim of the present study is to develop a very first application of TCSPC to measure the
 temperature of water droplets in a polydisperse spray.

 The effect of temperature on the fluorescence lifetime
 Fluorescence results from the spontaneous emission of a photon by molecules which has
 been excited to an electronic state of higher energy. In the case of laser induced fluorescence,
 the excitation comes from the absorption of a laser beam. Fluorescence typically follows first-
 order kinetics. After an excitation by an ultrashort pulse of light, the fluorescence signal ( )
 emitted by the population of molecules will ideally decay with time according to:
 ( )/ (0) = e− / , (1)
 where is the fluorescence lifetime. However, there are quite a few instances in the literature
 where biexponential decays were observed including rhodamine B (Kristoffersen et al. 2014).
 In this case, the decay be expressed by:

 − −
 ( )/ (0) = e 1 + (1 − ) e 2 , (2)
 where is a parameter between 0 and 1 and an average fluorescence lifetime can be
 computed as (Casadevall I Solvas et al. 2010) as followed:
 = 1 + (1 − ) 2 (3)
 In the following, the fluorescence lifetime will be fitted by a biexponential decays. An Arrhenius
 law is widely accepted to describe the effect of temperature on the rate of the non-radiative
 deactivations for KR in many solvents (Mendels et al. 2008). For simplicity, this law was also
 considered for the temperature dependence of the fluorescence intensity and the lifetime
 (Mercadé-Prieto et al. 2017):

 = exp ( ), (4)

 −1 −1
 where is the activation energy and is the gas constant ( = 8.314 J. K . mol ). For KR,
 values of have been reported by (Mercadé-Prieto et al. 2017) based on their own
 measurements and data taken from the literature., Mendels et al. (2008) obtained a value of
 = 24.2 kJ/mol. While the effect of the solvent and the chemical environment have been
 examined in several studies (Zhang et al. 2014; Hilaire et al. 2017), little consideration has
 been given to the dependence of on the emission wavelength. However, this dependence
 is strong enough to make it possible to use KR to measure the temperature with the two-color
 one-dye method (Lemoine and Castanet 2013).

 Experimental setup
 TCSPC is a method of choice for measuring the fluorescence lifetime in the time domain with
 an ultrashort pulsed laser. The technique is well established and is usually consider
 outperforming other lifetime measurement techniques in sensitivity, dynamic range and time
 resolution. Indeed, the elapsed time between the sample excitation by an ultrashort pulsed
 light source and the emission of a fluorescence photon can be measured typically with a
 picosecond accuracy. Figure 1 shows the optical system used for the implementation of the
 TCSPC technique. The excitation of the fluorescent dyes is performed by a femtosecond
 Ti:Sapphire laser (Coherent Chameleon Ultra II) which is tuneable from 690 to 1080 nm and
 generates light pulses with a width of about 140 fs. To induce the fluorescence of KR, the laser
 is firstly tuned on a wavelength of 980 nm. Then, frequency of the laser beam is doubled using
 the second harmonic generator HarmoniXX from A·P·E Angewandte Physik & Elektronik
ICLASS 2021, 15th Triennial International Conference on Liquid Atomization and Spray Systems, Edinburgh, UK, 29 Aug. - 2 Sept. 2021

 GmbH. The resulting wavelength cantered around 490 nm allows obtaining an intense
 fluorescence signal with RhB.
 Achromatic
 doublet
 Frequency Lens
 doubler Optical
 Ti:Sa fs laser fiber
 Polarizer Spray
 PM

 Filter
 Photodiode

 Optical fiber

 Achromatic PM
 Nozzle
 doublet
 ( )

 Lens
 ( ) Spray

 Figure 1: Experimental setup (a: Front view, b: Top view of the spray and the detection
 system, c: spraying system).
 When the measurements are performed in the spray, the laser beam is focused by means of
 a lens with a focal length =200 mm, allowing to obtain a beam waist diameter of about 100
 µm and a Rayleigh length of about 6 cm. A fast hybrid photomultiplier tube (R10467,
 Hamamatsu) with a Peltier cooler to reduce the dark count rate, is used for photon counting.
 The output of the detector is sent to a time-correlating counter, the HydraHarp 400 controller
 (PicoQuant GmbH) which is operating in forward start stop mode to measure the arrival times
 of single photons. In short, a laser pulse causes a photon event at the detector and the
 electronics measures the delay between the laser pulse and the subsequent photon event.
 This measurement implies a sharp timing of the laser pulse, which is obtained from a fast
 photodiode (TDA 200 from PicoQuant GmbH) also connected to the timing electronics. This
 photodiode allows detecting the laser pulses with a small-time jitter due a very sharp falling
 edge (Fall time typ. 250 ps). It works on the light component in reflection from a beam splitter
 (99% T, 1% R) placed at the laser output. The fluorescence signal is collected at right angle
 from the laser excitation using an achromatic doublet with a focal of 90 mm and the signal is
 transmitted by a single-mode optical fibre with a core diameter of 70 µm. Finally, different
 bandpass filters can be mounted in front of the photomultiplier tube in order to detect the
 photons on specific spectral bands.
 The basic principles of TCSPC have been discussed in great detail in literature (Lakowicz
 2013). The measurement method is based on the repetitive and precisely timed registration
 of single photons using the previously described system. By counting a high number of photon
 events to achieve statistical convergence, a histogram of the photon arrival times distribution
 can be built up. The width of the time bins in this histogram depends on the required time
 resolution (typically a few tens of ps). Finally,the fluorescence decay in the histogram is fitted
 by a biexponential function. A non-linear least squares analysis is used to test if the model is
 consistent with the data and estimate the parameters of the fluorescence decay model. The
 noise coming from the PM and the environment is also considered by adding “noise” photons
 uniformly distributed in time. Typically, in the dark, the count rate of the noise is about 60 Cps.
ICLASS 2021, 15th Triennial International Conference on Liquid Atomization and Spray Systems, Edinburgh, UK, 29 Aug. - 2 Sept. 2021

 a) b)
 0.8

 0.6

 0.4

 0.2

 0

 -0.2 Slope computed at
 95% of confidence
 -0.4 intervals

 0 2 4 6 8 10 12 14 03.6 23.7 4 3.8 6 3.9 8 4 10 4.112 4.214

 Figure 2: a) fluorescent decays of KR at different temperatures for the spectral bands [630 −
 650 ]. Measurements carried out in a cell at a concentration of 10−5 M. b) fitting of a linear
 regression of ( ) versus the inverse temperature to obtain the parameters of the
 Arrhenius equation (Ea = 18.7 ± 0.4 kJ/mol, A = 6.69 ± 0.85).

 Temperature calibration
 Before measuring the droplet temperature in sprays, it is necessary to perform a lifetime
 temperature calibration. This step consists in measuring the fluorescence lifetime in a cell for
 different liquid temperatures. The liquid is stirred to ensure a uniform temperature while a
 thermocouple is positioned a few mm from the LIF measurement volume. These calibration
 experiments were carried out using a filter on the spectral band [630 nm - 650 nm]. Figure 2
 shows the fluorescent decay of KR at different temperatures. As observed the fluorescence
 lifetime is strongly dependant on the temperature. In Figure 2.b, ( ) is plotted as a function
 of 1/ for KR in the band [630 nm - 650 nm] and the linearity of the plot confirms the good
 suitability of the Arrhenus law (Eq. 4). The temperature dependence of is controlled by the
 activation energy which can be determined from the slope of this curve. Presently, an
 activation energy of Ea = 18.7 ± 0.4 kJ/mol is found

 Application to droplets in polydisperse spray
 To test the measurement method, a spray configuration which has been already examined
 in earlier studies (Labergue et al. 2010, 2012; Rimbert and Castanet 2010) was chosen, as
 it illustrates the problems encountered in measuring the temperature in polydisperse sprays
 with the intensity of the fluorescence signal and the two-color laser-induced fluorescence
 technique. The spray is generated by a pressure swirled atomizer (Danfoss oil nozzle, angle
 30° type S, 0.50 USgal/h, 1.87 kg/h) designed to generate a full cone spray. Before entering
 the nozzle, the liquid flows across a heat exchanger, which allows to control the liquid
 temperature during the injection. A type K thermocouple inserted in the inlet pipe of the spray
 nozzle is used to determine the liquid injection temperature. The spraying system is also
 mounted on translations stages to move the spray relatively to the optics and perform
 measurements at different positions. The size and velocity distributions of the droplets can
 be found in the study by Labergue et al. (2012). An increase of the injection pressure from 2
 bar to 6.5 bar, induces a decrease in the statistical droplet diameter 10 from 40 µm to 20
 µm, while the droplet density increases from 103 to 5.104 particles per cm3 at = 13 mm
 downstream of the injector outlet (Figures 5 and 6 in Labergue et al. 2012).
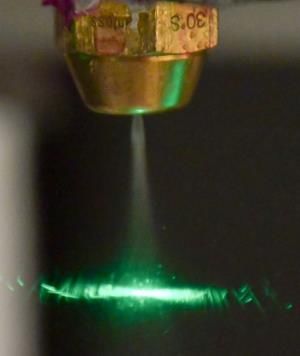
ICLASS 2021, 15th Triennial International Conference on Liquid Atomization and Spray Systems, Edinburgh, UK, 29 Aug. - 2 Sept. 2021

 a) b)

 Figure 3: Images of the spray at different injection pressures, a: Illumination with a focalized laser
 beam at 490 nm, b: Fluorescence field induced by two laser beams crossing each other in a
 configuration of Laser Doppler Velocimetry. Images extracted from Labergue et al. (2012).
 Photographs of the spray are showing evidence of multiple light scattering by the droplets.

 Using the same spraying system, Labergue et al. (2010) found that a significant distortion of
 the fluorescence spectrum could be observed when changing the injection pressure and thus
 the droplet size (Figure 6 in Labergue et al. 2010). They described for the first time an effect
 apparently related to the size of the droplets, which is capable to alter the fluorescence ratio
 and thus to induce a bias in the droplet temperature measurements. Later, Labergue et al.
 (2012) have highlighted the importance of reducing the depth of field of the detection optics.
 In a spray, multiple light scattering by the droplets can be significant, especially when the
 injection pressure and thus the density of the droplets is increased. While the laser beam
 has typically a diameter of a few hundred microns in their measurements, light scattering
 considerably enlarges the region of the fluorescence excitation. Droplets normally situated
 well outside the laser beams emit a substantial amount of parasitic fluorescence (Figure 3b).
 Although most of this fluorescence originates from regions outside of the focal plane of the
 collection optics, effects on the intensity of the fluorescence signal can be significant. The
 detection system collects light originating from a region that has a significant depth on both
 sides of the focal plane (typically several mm). In the two-color one-dye measurements
 method, the signal intensities detected on two emission bands of a single dye are used to
 calculate an intensity ratio and determine the temperature, provided two bands of different
 activation energies:
 −
 = 1 / 2 = 1 / 2 = exp ( 1 2 ) (1)

 For KR on the spectral bands [535 nm - 545 nm] and [615 nm - 750 nm], a temperature
 sensitivity of the ratio of about 0.9%/°C was reported by Labergue et al. (2012). However,
 the ratio is changing considerably when the injection pressure is increased from 3 bar to 6.5
 bar (Figure 4a) while the spraying conditions are isothermal. The variations of the ratio are
 reduced with the long-distance microscope which removes more efficiently the out-of-field
 fluorescence (Figure 13 in Labergue et al. 2012). Nevertheless, converted into temperature,
 the remaining variations of still corresponds to more than 10°C. The front lens used for
 collecting the signal in the present study has the same deficiencies. From measurements
 performed with a spectrometer, the ratio varies within a significant range when using the
 same spectral bands (Figure 4a). Labergue et al. (2012) developed an empirical method of
 correction using a third spectral band of detection. Although many measurement biases
 seem to be effectively corrected in their study, it cannot be ensured that all are completely
 removed due to the lack of a theoretical basis for these corrections.
 Preliminary tests have been performed to verify that lifetime-based measurements are not
 affected by the problems discussed above. The injection pressure was increased from 2 bar
 to 6 bar while the injection temperature was fixed at 20°C. Then, lifetime measurements were
 performed at = 13 , which is the same downstream position as the measurements
ICLASS 2021, 15th Triennial International Conference on Liquid Atomization and Spray Systems, Edinburgh, UK, 29 Aug. - 2 Sept. 2021

 shown in Figure 4.a. The results were then compared to measurements performed at the
 same temperature in a cell and in a monodisperse droplet stream where the droplet size is
 about 150 µm. Results, presented for = 20°C in Figure 4.b, reveal that the fluorescent
 decay does not change significantly in all these situations. A lifetime difference of about 0.015
 ns is observed. Such a small difference, corresponding to a bit more than 1°C, can be
 partially explained by a deviation in the liquid temperature, despite much care has been taken
 to have the same temperature in the spray, the droplet stream and the cell. Finally, the main
 difference between the cell, and the spray appears to be in the noise contribution, which is
 slightly higher for the spray measurements. It obviously takes a longer time to acquire as
 many photons in a spray as in a cell due to a lower liquid volume fraction. However, as long
 as the noise level is known, the noise contribution can be taken into account in the fitting
 model. From these preliminary tests, it seems that no bias is affecting the temperature
 measurements using the TCSPC technique, as opposed to intensity-based measurements
 using the 2cLIF method.
 a) b)
 1.7

 1.6
 Fluorescence ratio

 1.5

 1.4

 1.3

 1.2

 1.1 -2°C
 3 3.5 4 4.5 5 5.5 6 6.5 Fitted slope
 Injection pressure (bar) +2°C
 Achromatic doublet present study)
 Achromatic doublet 0 2 4 6 8 10 12
 Long distance microscope (ns)
 Figure 4: a) Evolution of the fluorescence ratio R as a function of the injection pressure for different
 detection optics. The fluorescence signal is detected on the spectral bands [535 nm- 545 nm] and
 [615 nm – 675 nm] downstream of the nozzle outlet at =13 mm. b) fluorescent decay of KR in a
 spray (z=13 mm, P=5 bar), in a droplet stream (at z=10 mm) and in a cell for a liquid temperature
 of 20°C.

 Application to droplets in polydisperse spray
 The measurement technique was used to characterize the droplet cooling for different
 injection temperatures and an injection pressure of = 5 bar. Figure 5 presents the evolution
 of the droplet temperature on the spray axis for =19°C,
 Fitted slope 44°C and 60°C. Due to
 evaporation, droplets injected at room temperature can be cooling down. -2°C
 While the cooling
 +2°C
 rate is dependent on the size, velocity and initial temperature of the droplets, the final
 0 2 4 6 8 10 12
 temperature of the droplet depends basically on the ambient air temperature(ns)
 and the
 relative humidity . It corresponds to the wet-bulb temperature . Under the experimental
 conditions in Figure 5, =19°C and =52%, the wet bulb temperature can be valuated
 at =13.2°C (Stull 2011). In Figure 5, measurements seem to converge towards this
 theoretical limit for the case =19°C. For =44°C and 60°C, the droplets have not
 reached their thermal equilibrium at = 100 mm, but their temperature is well below the
 ambient temperature. It should be mentioned that the spray was injected into a large room
 in which air is constantly refreshed. However, local humidity inside the spray is surely higher
 than in the ambient.
 A comparison is also possible with measurements carried out by Labergue et al. (2012) using
 the intensity of the fluorescence signal. Measurements obtained by Labergue et al. (2012)
 for =51°C and =4.5 bar have been added in Figure 5. An important difference can be
 observed between both measurement techniques. It is clear that the cooling rate is lower and
 does not follow the same time evolution. This can hardly be explained by differences in the
ICLASS 2021, 15th Triennial International Conference on Liquid Atomization and Spray Systems, Edinburgh, UK, 29 Aug. - 2 Sept. 2021

 injection conditions ( = 4.5 bar against = 5 bar), nor by the ambient conditions
 (unfortunately, Labergue et al. (2012) provide no information about the relative humidity or
 about the ambient temperature). More likely, intrinsic biases are affecting the intensity-based
 measurements performed by Labergue et al. (2012). The fluorescence signal is detected by
 means of two photomultiplier tubes and a threshold level is fixed significantly above the noise
 level of the channels of detection. If a sequence has more than ten consecutive samples
 above this threshold, it is considered coming from droplets otherwise the sequence is fully
 rejected. Obviously, this condition is more difficult to fulfill for very small droplets. The
 fluorescence signal emitted by a droplet varies roughly with 3 , being the droplet diameter.
 However, in intensity-based measurements, the dynamic range of the PMT detectors (ratio
 of the maximum signal and the noise level) is hardly greater than 15-20, making it difficult to
 study a droplet population whose size ranges over more than a 2.5:1 ratio. Considering that
 the high voltages of the PMTs were adjusted so as to detect the largest droplets without any
 saturation of the signal level, many of the small droplets could simply not be detected. This
 issue is not encountered in the case of the current lifetime-based measurement technique
 which operates on single photons with no distinction whether they originate from a small or
 a large droplet. Therefore, we believe that the temperature measured using TCSPC is very
 close to the volume average temperature of the liquid phase without any effect of the droplet
 size distribution of the spray.
 60

 55

 50

 45

 40

 35
 0
 30

 25

 20

 15 13.2°C
 10
 10 20 30 40 50 60 70 80 90 100
 (mm)
 Figure 5: Evolution of the droplet temperature measured in the centreline of the spray for different
 injection temperature (P=5 bar). Comparison to the data from Labergue et al. (2012) at P=4.5 bar.

 Conclusions
 A new method for measuring the droplets temperature in sprays was developed and tested.
 The method is based on the measurement of the fluorescence lifetime of certain dyes that are
 particularly sensitive to temperature such as kiton red. One of the major advantages of using
 the fluorescence lifetime is the fact that it is an absolute measurement, unlike the intensity,
 which is always relative. The fluorescence lifetime is an intrinsic molecular property, which is
 not affected by fluctuations in excitation source intensity or in the collections of the
 fluorescence signal. This makes all the difference when measuring the temperature in dense
 sprays. Although the technique is not suitable for measuring the temperature of individual
 droplets as opposed to intensity-based measurements (Labergue et al. 2012), it is possible to
 obtain the mean volume temperature of the liquid phase with no bias. Intensity-based
 measurements are usually limited by the dynamic range of their detectors, which are not able
 to detect with the same settings (gain voltage, laser power…) individual droplets when they
 have very different size. This problem is not encountered with lifetime measurements and the
 TCSPC technique which operates on single photons regardless of their origin (large or small
 droplets).
ICLASS 2021, 15th Triennial International Conference on Liquid Atomization and Spray Systems, Edinburgh, UK, 29 Aug. - 2 Sept. 2021

 A very high signal-to-noise ratio could be achieved under all the conditions which were tested
 in sprays. A dynamic range of about 3 decades for the decay curve can be retained in the
 spray, which is just slightly lower than in a liquid cell. This provides to the measurements, an
 accuracy and robustness which is probably unrivalled among the other temperature
 measurement techniques available in sprays. The absolute error typically does not exceed
 ±1°C in most cases and even reduces to about ±0.5°C if any uncertainty affecting the
 calibration coefficients are put aside.
 Nomenclature
 T Temperature [K]
 z Height [m]
 Ea Activation energy [J.mol-1]
 Fluorescence lifetime [s]
 t Time [s]
 P Pressure [bar]
 References
 Casadevall I Solvas X, Srisa-Art M, Demello AJ, Edel JB (2010) Mapping of fluidic mixing in
 microdroplets with 1 μs time resolution using fluorescence lifetime imaging. Anal Chem
 82:3950–3956
 Chaze W, Caballina O, Castanet G, Lemoine F (2017) Spatially and temporally resolved
 measurements of the temperature inside droplets impinging on a hot solid surface. Exp Fluids
 58:
 Hilaire MR, Mukherjee D, Troxler T, Gai F (2017) Solvent dependence of cyanoindole fluorescence
 lifetime. Chem Phys Lett 685:133–138
 Kristoffersen AS, Erga SR, Hamre B, Frette Ø (2014) Testing fluorescence lifetime standards using
 two-photon excitation and time-domain instrumentation: Rhodamine B, coumarin 6 and lucifer
 yellow. J Fluoresc. https://doi.org/10.1007/s10895-014-1368-1
 Labergue A, Delconte A, Castanet G, Lemoine F (2012) Study of the droplet size effect coupled with
 the laser light scattering in sprays for two-color LIF thermometry measurements. Exp Fluids
 52:1121–1132
 Labergue A, Deprédurand V, Delconte A, et al (2010) New insight into two-color LIF thermometry
 applied to temperature measurements of droplets. Exp Fluids 49:547–556
 Lakowicz JR (2013) Principles of fluorescence spectroscopy. Springer science & business media
 Lemoine F, Castanet G (2013) Temperature and chemical composition of droplets by optical
 measurement techniques: a state-of-the-art review. Exp Fluids 54:1572
 Mendels DA, Graham EM, Magennis SW, et al (2008) Quantitative comparison of thermal and solutal
 transport in a T-mixer by FLIM and CFD. Microfluid Nanofluidics. https://doi.org/10.1007/s10404-
 008-0269-5
 Mercadé-Prieto R, Rodriguez-Rivera L, Chen XD (2017) Fluorescence lifetime of Rhodamine B in
 aqueous solutions of polysaccharides and proteins as a function of viscosity and temperature.
 Photochem Photobiol Sci. https://doi.org/10.1039/c7pp00330g
 Müller CB, Weiß K, Loman A, et al (2009) Remote temperature measurements in femto-liter volumes
 using dual-focus-Fluorescence Correlation Spectroscopy. Lab Chip.
 https://doi.org/10.1039/b807910b
 Paviolo C, Clayton AHA, Mcarthur SL, Stoddart PR (2013) Temperature measurement in the
 microscopic regime: A comparison between fluorescence lifetime- and intensity-based methods.
 J Microsc. https://doi.org/10.1111/jmi.12033
 Perrin L, Castanet G, Lemoine F (2015) Characterization of the evaporation of interacting droplets
 using combined optical techniques. Exp Fluids 56:
 Rimbert N, Castanet G (2010) Liquid Atomization out of a Full Cone Pressure Swirl Nozzle. 7th Int
 Conf Multiph Flow ICMF 2010 Tampa FL May 30 June 4 2010
 Stiti M, Labergue A, Lemoine F, et al (2019) Temperature measurement and state determination of
 supercooled droplets using laser-induced fluorescence. Exp Fluids 60:1–13
 Stull R (2011) Wet-bulb temperature from relative humidity and air temperature. J Appl Meteorol
 Climatol 50:2267–2269
 Zhang XF, Zhang Y, Liu L (2014) Fluorescence lifetimes and quantum yields of ten rhodamine
 derivatives: Structural effect on emission mechanism in different solvents. J Lumin 145:448–453
You can also read