A multi cantilever beam low frequency FBG acceleration sensor
←
→
Page content transcription
If your browser does not render page correctly, please read the page content below
www.nature.com/scientificreports
OPEN A multi‑cantilever beam
low‑frequency FBG acceleration
sensor
Li Hong1,2, Rui Sun1,2, Zhongchao Qiu1,2,3*, Zhiming Han1,2 & Yanan Li1,2
The acquisition of 2–50 Hz low-frequency vibration signals is of great significance for the monitoring
researches on engineering seismology, bridges & dams, oil & gas exploration, etc. A multi-
cantilever beam low-frequency FBG acceleration sensor is proposed against the low sensitivity that
predominates in the low-frequency vibration measurement by FBG acceleration sensors. Structural
parameters of the sensor is subjected to simulation analysis and optimization design using the ANSYS
software; the real sensor is developed based on the simulation results in the following manner: Three
rectangular of the cantilever beams are evenly arranged around the mass block at 120°to improve
the sensitivity and alleviate the transverse crosstalk of sensor; in the end, a performance test is
performed on the sensor. According to the research findings, the sensor, whose natural frequency is
approximately 64 Hz, is applicable for monitoring the low-frequency vibration signals within the range
16–54 Hz. The sensor sensitivity is approximately 87.955 pm/m s−2, the linearity being greater than
99%, the transverse interference immunity being lower than 2.58%, and the dynamic range being up
to 86 dB. The findings offer a reference for developing sensor of the same type and further improving
the sensitivity of fiber optic acceleration sensor.
The acquisition of 2–50 Hz low-frequency vibration signals is of great significance for the monitoring researches
on engineering seismology, bridges & dams, oil & gas exploration, e tc1,2. In recent years, acceleration sensors,
one of the key devices for dynamic acquisition of vibration signals, has been extensively used for the monitoring
of large structures and environmental s afety3,4. By contrast, traditional electronic accelerometers have limited
applications due to their susceptibility to electromagnetic interference. Fiber Bragg Grating (FBG) is an optical
sensing element featuring small footprint, strong stability, excellent electromagnetic immunity, high measure-
ment accuracy, etc. Such merits enable FBG to replace electronic accelerometers in seismic wave detection,
large structure health monitoring, oil & gas exploration, etc., thereby improving the remote online monitoring
capabilities in harsh environments5–7.
In recent years, low-frequency FBG acceleration sensors have been extensively and intensively studied at
home and a broad8,9. Dingyi Feng et al.10 proposed a dual-cantilever beam compact FBG acceleration sensor,
where two identical L-shaped rigid cantilever beams are connected back-to-back and fixed as mass blocks at the
free end of the rectangular cantilever beam. That structure offers a dynamic range of 3 G, but it’s less sensitive.
M.M.Khan et al.11 proposed a FBG accelerometer with L-shaped non-uniform cross-section cantilever beams,
where dual FBGs were used for sensor temperature self-compensation; the sensor sensitivity was 306 pm/g at a
resonant frequency above 150 Hz; however, the sensor sensitivity was restricted to 40 pm/g within the frequency
range below 50 Hz. Qinpeng L iu12 designed a dual-cantilever beam FBG accelerometer based on the theory of
coupled film, and it exhibited favorable linear response within the frequency range 4–30 Hz, with the correspond-
ing range of sensitivity being 7.76 − 10.8 pm/m s−2. Om Prakash et al.13 presented a FBG accelerometer with
dual L-shaped cantilever beams, where two FBGs were integrated in a differential sensing device to broaden the
operational range in addition to improving the sensitivity. Despite the fruitful results that have been achieved
in low-frequency FBG acceleration sensors in recent years, low sensitivity has been a bottleneck hindering the
practical engineering application of low-frequency FBG acceleration sensors.
Aiming at the problem that the sensitivity of the current FBG acceleration sensor is generally low during the
measurement of low-frequency vibration signals, the paper proposes a multi-cantilever beam low-frequency FBG
acceleration sensor. Three rectangular cantilever beams are evenly arranged around the mass block at 120° to
improve the sensitivity, in addition to alleviating the transverse crosstalk of sensor. Furthermore, the two-point
1
Institute of Disaster Prevention, School of Electronic Science and Control Engineering, Sanhe 065201, Hebei,
China. 2Key Laboratory of Seismic Dynamics of Hebei Province, Sanhe 065201, Hebei, China. 3Institute of
Geophysics, China Earthquake Administration, Beijing 100081, China. *email: qiuzc1987@163.com
Scientific Reports | (2021) 11:18502 | https://doi.org/10.1038/s41598-021-98055-z 1
Vol.:(0123456789)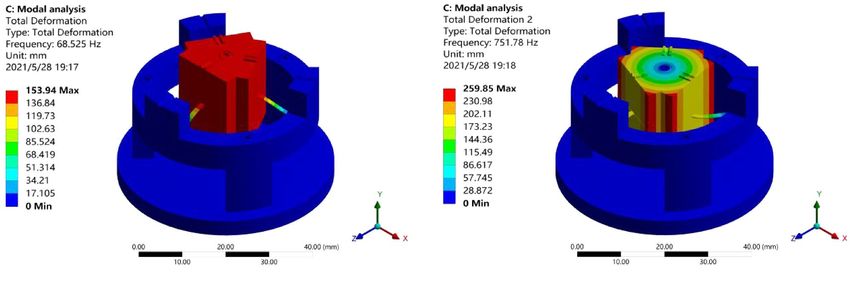
www.nature.com/scientificreports/
Optical fiber Mass
FBG Cantilever
Base
(a) 3D Structure Diagram (b) Picture I (c) Picture II
Figure 1. Structure diagram of the sensor [(a) was generated by Solidworks 2016 × 64 (https://www.solidworks.
com/); (b,c) were shot by Huawei P40pro].
FBG
m FBG
h L
m
m L y
B
x
(a) Front View of the Sensor Equivalent Model (b) Top View of the Sensor Equivalent Model
Figure 2. Structural equivalent model of the sensor [(a,b) were generated by Microsoft Visio Professional 2016
(https://www.microsoft.com/zh-CN/download/details.aspx?id=51188)].
attachment technique was adopted by attaching the FBG along the cantilever beam centerline between the hold-
down support and mass block; a pre-stress is applied to avoid FBG chirp and enhance the sensor s ensitivity14,15.
The multi-cantilever beam FBG acceleration sensor was theoretically analyzed in terms of sensitivity, natural
frequency, transverse interference immunity, etc.; simulation analysis and optimization design were performed
for the sensor using the ANSYS software; the real sensor was fabricated based on the simulation result, and its
performance was tested through experiments.
Structural design and theoretical analysis of the sensor
Structural design of the sensor. The multi-cantilever beam low-frequency FBG acceleration sensor was
principally composed of three rectangular cantilever beams, two mass blocks, the hold-down support, and three
FBGs with similar central wavelengths. The rectangular cantilever beam was fabricated at 120° intervals on a
circular spring steel sheet, and the two mass blocks were fixed through screws on the front and back sides of
the cantilever beam; then, the beams and mass blocks were integrally fixed onto the hold-down support. The
FBG was fixed into the grooves of the mass block and hold-down support along the cantilever beam centerline
through two-point attachment, and was then pre-stressed; the structure is detailed in Fig. 1.
With FBG as its sensing element, the multi-cantilever beam low-frequency FBG acceleration sensor converts
mechanical vibration signals into FBG central wavelength shift signals. When the sensor is excited by the vibra-
tion signal in the Z direction, the mass block drives the free end of cantilever beam to move up and down under
the action of inertial force, which in turn causes the FBG to stretch or compress; as a result, the central wavelength
of the FBG reflected wave would shift. Therefore, the acceleration value of the external vibration signal can be
determined by simply measuring the offset of the FBG center wavelength.
Theoretical analysis of the sensor. The structural equivalent model of the sensor is shown in Fig. 2,
where h represents the thickness of cantilever beam; L is the length of cantilever beam; B denotes its width; m
stands for the mass of the sensor mass block.
The mechanical structural portion of the multi-cantilever beam FBG acceleration sensor can be simplified
to a second-order single- Degree-Of-Freedom (DOF) forced vibration system consisting of m (mass block), k
(equivalent spring stiffness of the cantilever beam) and γ (damping). In the coordinate system shown in Fig. 2b,
the kinematic equation of the mass block is
Scientific Reports | (2021) 11:18502 | https://doi.org/10.1038/s41598-021-98055-z 2
Vol:.(1234567890)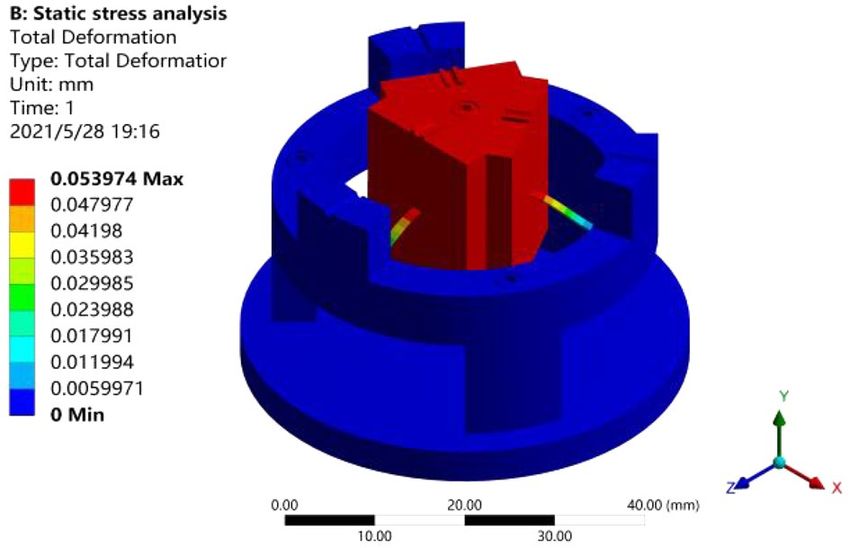
www.nature.com/scientificreports/
d2 y dy
M +γ + ky = −mag (1)
dx 2 dx
where, m represents the mass of the mass block; y means the absolute displacement of mass block;γ denotes the
damping constant of vibration system; k is the equivalent elastic coefficient of the vibration system; ag stands for
the acceleration of the vibration signal received by the sensor.
When the forced vibration of the mass block causes the cantilever beam to deform, the resulting strain ε in
the cantilever beam should be
2FL
ε= (2)
EBh2
where, F is the inertial force on the mass block; L denotes the length of cantilever beam; E represents the elastic-
ity modulus of the cantilever beam material; B means the width of cantilever beam; h stands for the thickness
of cantilever beam.
FBG refers to an intrinsic optical sensor where the refractive index of the fiber core changes periodically. The
region where the refractive index of fiber core changes periodically is equivalent to a periodic vertical mirror,
where incident light produces reflected light that interferes with each other, which causes the reflected spectrum
to appear as a peak. The stretching or compression of FBG will change the period of the refractive index of fiber
core, which causes the reflection peak to shift. Therefore, the FBG attached between the hold-down support and
the mass block will be longitudinally deformed, which in turn causes the central wavelength to change in the
following magnitude
� = (1 − Pe )ε (3)
where, represents the central wavelength of FBG;Pe ≈ 0.22 denotes the elasto-optical coefficient;ε stands for
the strain in FBG; is the FBG wavelength shift caused by strain.
Since the cantilever beam and FBG share the same plane, the deformation of cantilever beam can be approxi-
mated as that of the FBG. The following is true when Eq. (2) is substituted into Eq. (3)
2FL
� = (1 − Pe ) (4)
EBh2
To attain low-frequency vibration signals in a more favorable manner, the sensor should be favorably sensitive
within a certain frequency band. Equation (4),F = mag and S= ag are simultaneously established to identify
the following sensitivity of acceleration sensor
2ML
S= (1 − Pe ) (5)
EBh2
According to Eq. (5), the sensor sensitivity is associated with the strain generated when the sensor’s sensing
element is forced to vibrate. The sensitivity referred to in this paper is peak-to-peak, i.e., 2S.
The natural frequency of FBG acceleration sensor determines the input signal frequencies in all measure-
ments. When it comes to seismic wave detection, large structure health monitoring, oil & gas exploration, etc.,
vibration signals with frequencies below 50 Hz and low amplitudes are often critical. The natural frequency of
sensor is
EBh3
F0 = 2π (6)
2ML3
Structural parameter analysis and simulation
Effect of structural parameters on sensor capabilities. The vibration performance and measur-
ing range of sensor are associated with the natural frequency of sensor. To achieve higher sensitivities within
the vibration frequency range of 2–50 Hz, it’s essential to maximize the sensor sensitivity S through optimized
design, and to ensure appropriate values are available for natural frequency F0, so as to guarantee higher sensi-
tivity indexes within the favorable frequency response range. According to the outcome of theoretical analysis,
the length (L), width (B), and height (h) of the cantilever beam are key parameters affecting sensor sensitivity
S and natural frequency F0. Hence, with the other parameters fixed, the cantilever beams in various sizes were
modeled with Solidworks and subjected to simulation analysis with ANSYS to study the effects of these three key
parameters on sensor sensitivity and natural frequency, respectively.
First of all, since the probe should be as small as possible to facilitate the actual installation and operation,
the effects of length L of the cantilever beam that varied within the range 5–15 mm on sensor sensitivity S and
natural frequency F0 were discussed; the simulation result and its fit curve is shown in Fig. 3.
As shown in Fig. 3, sensor sensitivity S increased with the increase in length L of the cantilever beam; natural
frequency F0 increased with the decrease in length L of the cantilever beam. Where 5 mm < L < 10 mm, natural
frequency F0 decreased sharply with the increase in L; where L > 10 mm, the variation leveled off progressively.
In view of the fact that the sensor was designed to acquire low-frequency vibration signals below 50 Hz, the
natural frequency F0 of sensor was chosen to be greater than 50 Hz. Besides, since sensor sensitivity S should not
be excessively low, the length of cantilever beam is expected to fall within the range 8 mm < L < 10 mm.
Scientific Reports | (2021) 11:18502 | https://doi.org/10.1038/s41598-021-98055-z 3
Vol.:(0123456789)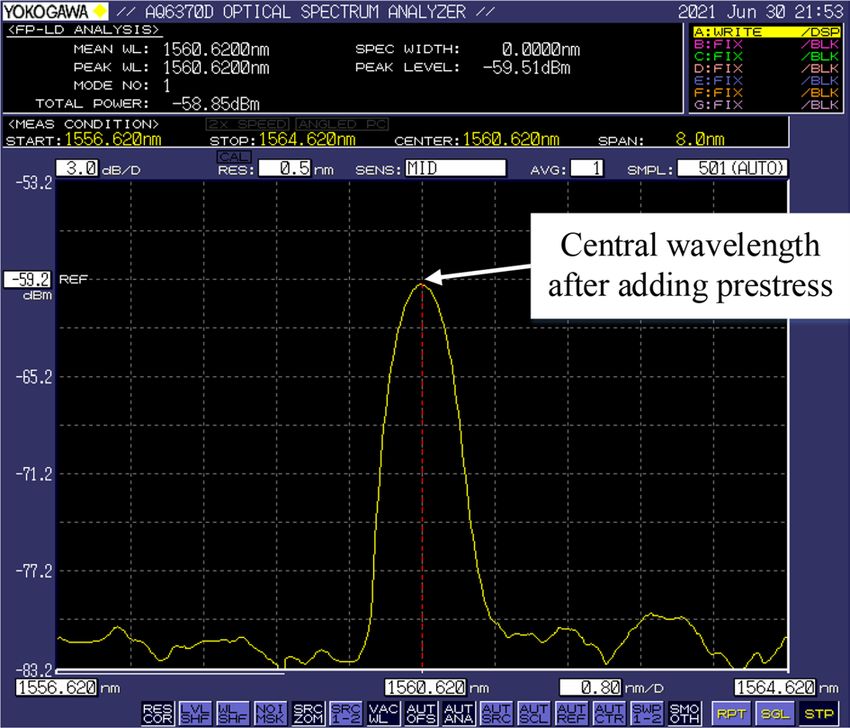
www.nature.com/scientificreports/
First-order Natural Frequency F of the Sensor (Hz)
1000 180
900 Simulation Curve of Sensor Sensitivity
Simulation Curve of Natural Frequency of the Sensor 160
800
Sensor Sensitivity S (pm/g)
140
700
600 120
500
100
400
300 80
200
60
100
40
0
-100 20
4 6 8 10 12 14 16
Cantilever Beam Length L (mm)
Figure 3. Relation curve of the variation of S and F0 with L [the figure was generated by Origin 2016 × 64
(https://www.originlab.com/2016)].
First-order Natural Frequency F of the Sensor (Hz)
1400 80
Simulation Curve of Sensor Sensitivity
Simulation Curve of Natural Frequency of the Sensor
75
1200
Sensor Sensitivity S (pm/g)
70
1000
65
800
60
600 55
50
400
45
200
4 6 8 10 12 14 16
Cantilever Beam width B (mm)
Figure 4. Relation curve of the variation of S and F0 with B [the figure was generated by Origin 2016 × 64
(https://www.originlab.com/2016)].
Secondly, analyze the influence of the cantilever beam width B on the sensitivity S and natural frequency
F0 of the sensor when the width of the cantilever is changed from 5 to 15 mm. The simulation result and its fit
curve are shown in Fig. 4.
As shown in Fig. 4, sensor sensitivity S decreased with the increase in width B of the cantilever beam; natural
frequency F0 increased with the increase in width B of the cantilever beam. When B ≤ 9 mm, the S curve exhib-
ited a clear downward trend with the increase in B; the change leveled off when 10 mm < B < 14 mm. To achieve
a higher sensitivity, the cantilever beam width B should be minimized; in consideration of the restrictions on
material selection and actual processing conditions of cantilever beam,B is recommended to be 12 mm.
Finally, the effect of variation of cantilever beam height h between 0.1and 1 mm on sensor sensitivity S and
natural frequency F0 was considered. The simulation result and its fit curve are shown in Fig. 5.
As shown in Fig. 5, sensor sensitivity S decreased with the increase in height h of the cantilever beam; natural
frequency F0 increased with the increase in height h of the cantilever beam. To address the sensor requirements
for sensitivity and natural frequency,h is recommended to be 0.2 mm.
Through the analysis of the effects of three key parameters on the sensor sensitivity and natural frequency
with consideration to the material selection and processing conditions, spring steel (65Mn, Young modulus
E = 210 GPa; Poisson’s ratio µ = 0.28); length of each cantilever beam L = 9 mm; width B = 1.2 mm; thickness
h = 0.2 mm was taken as the cantilever beam material used in production of sensors. Due to the constraints of
sensor size and processing cost, the mass block was required to be heavy in small size; hence, brass (H62), which
is denser, was chosen as the material of mass block; the calculated mass of mass block was approximately 0.042 kg.
Static stress analysis of sensor structure. The sensor was modeled with Solidworks based on the struc-
tural parameters identified through the above-noted analysis, and the result was imported into the ANSYS soft-
Scientific Reports | (2021) 11:18502 | https://doi.org/10.1038/s41598-021-98055-z 4
Vol:.(1234567890)
www.nature.com/scientificreports/
First-order Natural Frequency F of the Sensor (Hz)
1200 800
Simulation Curve of Sensor Sensitivity
Simulation Curve of Natural Frequency of the Sensor
1000 700
Sensor Sensitivity S (pm/g)
600
800
500
600
400
400
300
200
200
0 100
-200 0
0.0 0.2 0.4 0.6 0.8 1.0
Cantilever Beam height h (mm)
Figure 5. Relation curve of the variation of S and F0 with h [the figure was generated by Origin 2016 × 64
(https://www.originlab.com/2016)].
Figure 6. Static stress simulation analysis [the figure was generated by ANSYS workbench 19.0 (https://www.
ansys.com/zh-cn/products/structures/ansys-mechanical)].
ware for simulation analysis. First, fixed constraint was applied to the bottom of sensor model; the connection
surfaces between cantilever beam and mass block and between cantilever beam and hold-down support were
designated as fully bound support constraints; an external load with standard earth’s gravitational acceleration g
was applied to the sensor as a whole; the model was subjected to static stress simulation analysis through mesh-
ing to draw the strain plot of model, as shown in Fig. 6.
As shown in Fig. 6, the maximum deformation was observed at the free end of sensor, and the deformation
decreased toward the fixed end; the maximum deformation at the free end was approximately 0.054 mm.
Modal analysis of the sensor structure. Mode is an inherent property of the sensor structure itself; the
sensor model was subjected to modal analysis based on the result of static stress analysis on sensor. The natu-
ral frequencies of the first-order, second-order, third-order, and fourth-order modes identified were 68.5 Hz,
751.8 Hz, 2052.7 Hz, 2053.8 Hz, respectively; the main mode graph extracted from the modes of the first two
orders is shown in Fig. 7.
As shown in Fig. 7a, the first-order mode is simple harmonic vibration, indicating that the sensor model
vibrates along the Y-axis under external excitation. As shown in Fig. 7b, the second-order mode is a rotational
mode, indicating that the sensor model rotates around the Y-axis under external excitation. By comparing the
frequencies of the modals of each order, it can be known that, the frequency of the first-order modal was quite
different from the frequencies of the second-order, third-order, and fourth-order modals, it indicates that the
sensor in this structure is designed with small cross coupling that helps reduce cross interference.
Experimental test of the sensor. The FBG used in the sensor is three fiber Bragg gratings in the same
batch, whose central wavelength is 1560.5 nm, reflectivity is ≥ 90%, and the length of the FBG gate region is
10 mm. The reflection spectrum is shown in Fig. 8.
Scientific Reports | (2021) 11:18502 | https://doi.org/10.1038/s41598-021-98055-z 5
Vol.:(0123456789)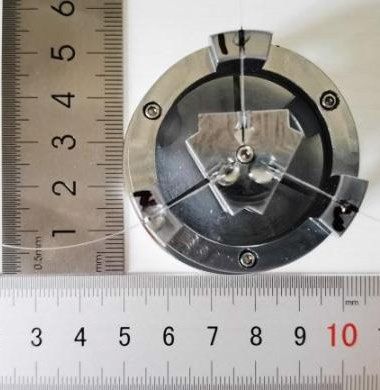
www.nature.com/scientificreports/
(a) First-order Mode (b) Second-order Mode
Figure 7. Modal analysis [(a,b) were generated by ANSYS workbench 19.0 (https://www.ansys.com/zh-cn/
products/structures/ansys-mechanical)].
Figure 8. The spectrum of the FBG sensor at room temperature and force-free [the figure was generated by
Microsoft Visio Professional 2016 (https://www.microsoft.com/zh-CN/download/details.aspx?id=51188)].
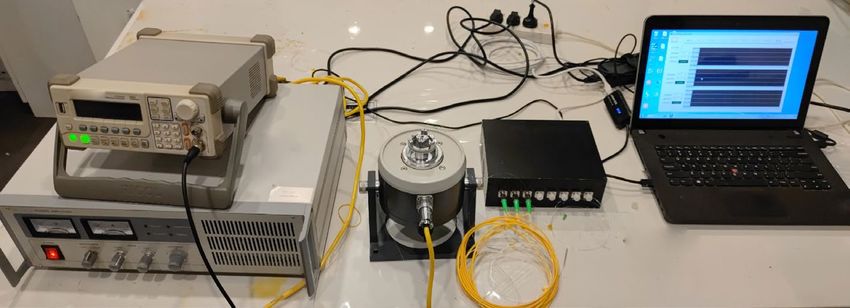
The apparatus for experimental test of the sensor principally included function signal generator, signal ampli-
fier, standard exciter, FBG demodulator, computer, etc. The test was performed with a function signal generator
(DG1022) from RIGOL Technologies with a sampling rate of 1 GSa/a, 14 quasi-waveform functions and abun-
dant standard interfaces designed for users to remotely control the data transmission of instruments and USB
interfaces via Web. The signal amplifier (MWY-TZQ50) was manufactured by Beijing Weiyun with a frequency
response range of 1–15,000 Hz and an SNR of more than 75 dB to work with the function signal generator to
amplify the function signals. The FBG demodulator (MWY-FBG-CS800) was also manufactured by Beijing Wei-
yun with a sampling frequency of up to 1 kHz and a built-in laser source to deliver the transmitted light waves to
the multi-cantilever beam low-frequency acceleration sensor on the vibration exciter system via optical fibers;
additionally, the FBG demodulator has 8 independent demodulation channels, which can effectively distinguish
the reflection spectra of different FBGs, conducted spectral analysis and data acquisition inside, and transferred
the acquired data to the computer in the end. The experimental test system established with above-noted devices
for the multi-cantilever beam low-frequency FBG acceleration sensor is shown in Fig. 9.
Analysis of amplitude‑frequency response characteristics. First, the signal generator was adjusted
in the experiment so that the vibration exciter could deliver sinusoidal excitation signals with an acceleration
amplitude of 2.5 m/s2 for the sensor sweep test. According to the simulation result, the sweep frequency range
was set to 10–100 Hz at a step of 10 Hz. The approximate range of the natural frequency of sensor was identified,
and then the test was repeated at a step of 2 Hz; the ultimate amplitude-frequency response curve of the sensor
is shown in Fig. 10.
Scientific Reports | (2021) 11:18502 | https://doi.org/10.1038/s41598-021-98055-z 6
Vol:.(1234567890)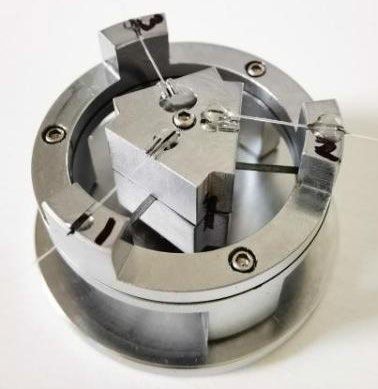
www.nature.com/scientificreports/
Incident Light
Reflected Light
FBG Acceleration
Function Signal Sensor
FBG Demodulator
Generator
Vibration Exciter
Signal Amplifier Computer
(a) Schematic Diagram of the Experimental Test System
Function Signal Generator FBG Acceleration Sensor
Signal Amplifier Vibration Exciter FBG Demodulator computer
(b) Picture of the Experimental Test System
Figure 9. FBG acceleration sensor test system [(a,b) were generated by Microsoft Visio Professional 2016
(https://www.microsoft.com/zh-CN/download/details.aspx?id=51188)].
450
400 64 Hz
350
Wavelength shift (pm)
300
250
200
150
100
50
0 10 20 30 40 50 60 70 80 90 100
Frequency (Hz)
Figure 10. Amplitude-frequency response of the FBG accelerometer [the figure was generated by Origin
2016 × 64 (https://www.originlab.com/2016)].
As shown in Fig. 10, the natural frequency is approximately 64 Hz, and the response was relatively gentle
within the frequency range of 16–54 Hz, thus being substantially are applicable for the measurement of low-
frequency signals; moreover, the experimental measurement of the natural frequency was close to 68 Hz, a
simulation calculated value; the minor errors might result from the mechanical losses that occurred between
components of the screwed sensor under external excitations.
Linear response test. To study the linearity and sensitivity of the multi-cantilever beam acceleration sen-
sor, the signal generator was so adjusted that the output frequency of vibration exciter was 20 Hz and 40 Hz. Due
Scientific Reports | (2021) 11:18502 | https://doi.org/10.1038/s41598-021-98055-z 7
Vol.:(0123456789)www.nature.com/scientificreports/
600 2400
FBG1 FBG1
500 FBG2 2000 FBG2
FBG3 FBG3
Sensitivity Fit Curve Sensitivity Fit Curve
Wavelength Shift(pm)
Wavelength Shift(pm)
400 1600
300 1200
200 800
100 400
0 0
0 1 2 3 4 5 6 0 5 10 15 20 25
2
Acceleration(m/s ) Acceleration(m/s )2
(a) Linearity of the Acceleration Sensor at 20 Hz (b) Linearity of the Acceleration Sensor at 40 Hz
Figure 11. Linearity of the acceleration sensor [(a,b) were generated by Origin 2016 × 64 (https://www.origi
nlab.com/2016)].
to the vibration exciter constraints, the variation amplitude of acceleration at the vibration signal frequency of
20 Hz was 0.1 m/s−2-6.1 m/s−2,at a step of 0.3 m/s−2. The variation amplitude of acceleration at the vibration
signal frequency of 40 Hz was 0.6 m/s−2-24.6 m/s−2, at a step of 1.2 m/s−2. The acceleration response curve plot-
ted is shown in Fig. 11.
As shown in Fig. 11, at 20 Hz, the measuring sensitivity of multi-cantilever beam FBG acceleration sensor
is 88.02 pm/m s−2 , while the fit coefficient R2 = 0.9995; at 40 Hz, the measuring sensitivity of multi-cantile-
ver beam FBG acceleration sensor is 87.89 pm/m s−2 , while the fit coefficient R 2 = 0.9947; in conclusion, the
experiment determined the sensitivity of multi-cantilever beam FBG acceleration sensor to be approximately
87.955 pm/m s−2, and determined the natural frequency to be about 64 Hz; hence, it’s applicable for detecting
violation signals with the frequency range of 16–54 Hz. With the requirements for low-frequency vibration
measurement met, it’s more sensitive than other FBG acceleration sensors.
In addition to the sensitivity, dynamic range is one of the key parameter indicators of s ensor16. When it
comes to FBG acceleration sensor, the dynamic range DR is associated with maximum wavelength shift max and
minimum wavelength drift min detectable by sensor; the relational expression is
max
DR = 20 lg( ) (7)
min
Furthermore, maximum wavelength drift max is principally restricted by the elastic deformation range of elas-
tic element of the sensor as well as the grating prestress; minimum wavelength drift min is principally dependent
on the FBG demodulation system resolution. In the sensor sensitivity test experiment, the maximum wavelength
shift from the sensor was 2172 pm , while the resolution of FBG demodulator for the experiment was 0.1 pm ;
the calculated dynamic range of the sensor was up to 86 dB, which substantially met the requirements of ANSS
(advanced national seismic system) on dynamic range of the class-C acceleration s ensors17.
Transverse interference immunity experiment. Transverse interference behavior is also an important
performance indicator to consider for single-DOF acceleration sensors. The sensor employs three cantilever
beams to clamp the mass block at its center; no matter from which side the transverse interference is applied, the
cantilever beam will provide pulling force or supporting force at the same time, thereby alleviating the deforma-
tion of fiber grating, so as to reduce the transverse interference. To study the transverse interference immunity
behavior of the acceleration sensor, its bottom was fixed to the side of the horizontal vibration exciter during the
experiment so that the vibrating direction was perpendicular to the measuring spindle of the sensor. The sensor
was brought under an acceleration excitation signal with a frequency of 40 Hz and an amplitude of 2.5 m/s−2,
and the shift value of output wavelength was compared with respective result in direction of the measuring spin-
dle to plot the characteristic curve of sensor’s transverse interference immunity, as shown in Fig. 12.
Figure 12 indicates a transverse wavelength shift of approximately 5.2 pm, a principal wavelength shift of
about 201.9 pm, and a transverse interference of less than 2.58%, which demonstrates the favorable transverse
interference immunity of sensor.
Impulse response experiment. Compared with excitation signal, impulse signal is an unsteady tran-
sient signal that contains abundant vibration information to adequately reflect the response characteristics of
acceleration sensor. Along with it, it’s possible to verify the natural frequency of the sensor. The generation of an
Scientific Reports | (2021) 11:18502 | https://doi.org/10.1038/s41598-021-98055-z 8
Vol:.(1234567890)www.nature.com/scientificreports/
1560.65
Vertical
Horizontal
1560.60
Central Wavelength(nm)
1560.55
1560.50
1560.45
0 20 40 60 80 100 120
Time(ms)
Figure 12. Transverse interference immunity behavior of the sensor [the figure was generated by Origin
2016 × 64 (https://www.originlab.com/2016)].
1560.54 1.50
1.25 62.71 Hz
1560.53
Central Wavelength (pm)
1.00
Amplitude
1560.52
0.75
1560.51
0.50
1560.50
0.25
1560.49 0.00
0.0 0.2 0.4 0.6 0.8 1.0 0 100 200 300 400 500
Time (s) Frequency (Hz)
(a) Impulse Time-domain Response of the FBG (b) Frequency Spectrum for Impulse Time-domain
Acceleration Sensor Response of the FBG Acceleration Sensor
Figure 13. Impulse response behavior of the sensor [(a,b) were generated by Origin 2016 × 64 (https://www.
originlab.com/2016)].
impulse signal was simulated by instantly knocking on the surface of vibration exciter during the experiment;
the results of impulse response test and Fourier spectrum analysis within the time domain are shown in Fig. 13.
According to Fig. 13, the multi-cantilever beam FBG acceleration sensor can effectively reflect impulse exci-
tation; the Fourier analysis of the time domain data brings about a frequency spectrum, where the natural
frequency of sensor is about 62.71 Hz, which is close to the simulation result and the experimental result of the
sensor amplitude frequency; the minor errors may result from the inadequate fixation between vibration exciter
surface and sensor; the artificial percussion for impulse signal simulation leads to the resonance between vibra-
tion exciter surface and sensor, thereby causing minor errors.
The repeatability of the sensor measurement. The test repeatability data is one of the effective evi-
dences that the sensor can maintain a good working condition for a long time. In this test, the output frequency
of the vibration table is set to 20 Hz and 40 Hz, and the acceleration is 2 m/s−2 and 4 m/s−2. Every 60 min, the
vibration is suspended for 30 min for 30 min, and the measurement is repeated four times to test the correspond-
ing stability of the sensor output. The test uses the relative standard deviation RSD to represent the repeatability
error of the sensor, and its expression is
Scientific Reports | (2021) 11:18502 | https://doi.org/10.1038/s41598-021-98055-z 9
Vol.:(0123456789)www.nature.com/scientificreports/
400
a=4 m/s2
350
Wavelengh drift(pm)
300
+]
+]
250
200
a=2 m/s2
150
0 1 2 3 4
Time(hour)
Figure 14. Sensor repeatability test [the figure was generated by Origin 2016 × 64 (https://www.originlab.com/
2016)].
� �n
(xi −x)2
i=1
SD n−1
RSD= × 100% = × 100% (8)
x x
where, SD is the standard deviation and x the corresponding mean value. The experimental results are shown
in Fig. 14.
As shown in Fig. 14, when the frequency is 20 Hz, the relative standard deviations of the FBG center wave-
length drift corresponding to 2 m/s−2 and 4 m/s−2 are 0.715% and 0.572%, respectively. When the frequency is
40 Hz, the relative standard deviations of the FBG center wavelength drift corresponding to 2 m/s−2 and 4 m/s−2
are 1.216% and 0.871%, respectively. It can be seen that the repeatability error of the sensor is small and the
stability is good in the ideal flat area.
Conclusion
The present paper proposes a multi-cantilever beam low-frequency FBG acceleration sensor, where three can-
tilever beams are evenly arranged at 120° to clamp the mass in the center, while the sensitivity and transverse
interference immunity are improved. Simulation analysis was used with experimental verification to optimize
the design of the sensor and perform performance tests. According to the research findings, the sensors, whose
natural frequency is approx. 64 Hz, is applicable for monitoring the vibration signals within the range 16–54 Hz.
The sensor sensitivity is approximately 87.955 pm/m s−2, the transverse interference immunity being lower
than 2.58%, and the dynamic range being up to 86 dB. The sensor designed in the paper is more compact, more
sensitive, good stability and more dynamically extensive than other cantilever type FBG acceleration sensors.
But there is still much room for improvement; for instance, when used for dynamic monitoring, the sensor
may vibrate tens of thousands of times a day; if things go on like this, the fixing screws and cantilever beams
among various parts of the sensor may develop fatigue wear, which may in turn impair the sensor performance.
Moreover, since the sensor has not yet introduced reference fibers for temperature compensation, it may fail in
an operating environment with significant temperature differences. Hence, the original scheme can be further
improved so that the sensor can be used for monitoring researches in water conservancy & electric power, bridges
& dams, engineering seismology, etc.
Received: 1 June 2021; Accepted: 2 September 2021
References
1. Goyal, D. & Pabla, B. S. The vibration monitoring methods and signal processing techniques for structural health monitoring: A
review. Arch. Comput. Methods Eng. 23(4), 585–594 (2016).
2. Ou, J. & Li, H. Structural health monitoring in mainland China: Review and future trends. Struct. Health Monit. 9(3), 219–231
(2010).
3. Zhou, C. et al. Study on a high-temperature optical fiber F-P acceleration sensing system based on MEMS. Opt. Lasers Eng. 120,
95–100 (2019).
4. Hong, L. et al. Sensitivity improvement of a new structure crack meter with angular adjustment. Meas. Control. 52(9–10), 1545–
1551 (2019).
5. Chen, J., Liu, B. & Zhang, H. Review of fiber Bragg grating sensor technology. Front. Optoelectron. China 4(2), 204–212 (2011).
6. Hong, C. Y. et al. Application of FBG sensors for geotechnical health monitoring, a review of sensor design, implementation
methods and packaging techniques. Sens. Actuators A 244, 184–197 (2016).
Scientific Reports | (2021) 11:18502 | https://doi.org/10.1038/s41598-021-98055-z 10
Vol:.(1234567890)www.nature.com/scientificreports/
7. Lu, Q. et al. Review of micromachined optical accelerometers: From mg to sub-ug. Opto-Electron. Adv. 4(03), 20–45 (2021).
8. Li, T. et al. Recent advances and tendency in fiber Bragg grating-based vibration sensor: A review. IEEE Sens. J. 20(20), 12074–12087
(2020).
9. Zhang, X. et al. Reliable high sensitivity FBG geophone for low frequency seismic acquisition. Measurement 129, 62–67 (2018).
10. Feng, D. et al. A fiber Bragg grating accelerometer based on a hybridization of cantilever beam. IEEE Sens. J. 15(3), 1532–1537
(2014).
11. Khan, M. M., Panwar, N. & Dhawan, R. Modified cantilever beam shaped FBG based accelerometer with self temperature com-
pensation. Sens. Actuators A 205, 79–85 (2014).
12. Liu, Q. et al. Double cantilever beams accelerometer using short fiber Bragg grating for eliminating chirp. IEEE Sens. J. 16(17),
6611–6616 (2016).
13. Parida, O. P. et al. Double-L cantilever-based fiber Bragg grating accelerometer. IEEE Sens. J. 19(23), 11247–11254 (2019).
14. Guo, Y., Chen, M., Xiong, L., et al. Fiber Bragg grating based acceleration sensors: A review. Sens. Rev. (2021).
15. Baldwin, C. et al. Review of fiber optic accelerometers. in Proceedings of IMAC XXIII: A Conference & Exposition on Structural
Dynamics. (2005).
16. Saha, S. & Biswas, K. A comparative study of fiber Bragg grating based tilt sensors. Rev. Comput. Eng. Stud. 4(1), 41–46 (2017).
17. Evans, J. R. et al. Performance of several low-cost accelerometers. Seismol. Res. Lett. 85(1), 147–158 (2014).
Acknowledgements
This study was financially supported by the "Basic scientific research business fees for central universities" gradu-
ate science and technology innovation fund project (Grant No. ZY20210303), the National Key Research and
Development Programme of China (Grant No. 2018YFC1503801); the second batch of new engineering research
and practice projects (Grant No. ESXWLHXLX20202607), The 2020 Educational Research and Teaching Reform
Project of the School of Disaster Prevention Science and Technology (Grant No. JY2020A12).
Author contributions
L.H.: Supervision on manuscript writing and analyses, R.S. and Z.Q.: Design the sensor structure, be respon-
sible for the sensor experiment and wrote the main manuscript text. Z.H. and Y.L.: Processing of sensor parts,
analysis of experimental results and prepared Figs. 1, 2, 3, 4, 5, 6, 7, 8, 9, 10, 11, 12, 13, 14. All authors reviewed
the manuscript.
Competing interests
The authors declare no competing interests.
Additional information
Correspondence and requests for materials should be addressed to Z.Q.
Reprints and permissions information is available at www.nature.com/reprints.
Publisher’s note Springer Nature remains neutral with regard to jurisdictional claims in published maps and
institutional affiliations.
Open Access This article is licensed under a Creative Commons Attribution 4.0 International
License, which permits use, sharing, adaptation, distribution and reproduction in any medium or
format, as long as you give appropriate credit to the original author(s) and the source, provide a link to the
Creative Commons licence, and indicate if changes were made. The images or other third party material in this
article are included in the article’s Creative Commons licence, unless indicated otherwise in a credit line to the
material. If material is not included in the article’s Creative Commons licence and your intended use is not
permitted by statutory regulation or exceeds the permitted use, you will need to obtain permission directly from
the copyright holder. To view a copy of this licence, visit http://creativecommons.org/licenses/by/4.0/.
© The Author(s) 2021
Scientific Reports | (2021) 11:18502 | https://doi.org/10.1038/s41598-021-98055-z 11
Vol.:(0123456789)You can also read