Deep Learning-based Fatigue Cracks Detection in Bridge Girders Using Feature Pyramid Networks
←
→
Page content transcription
If your browser does not render page correctly, please read the page content below
Deep Learning-based Fatigue Cracks Detection in Bridge Girders Using Feature Pyramid Networks Jun Li Zhejiang University Zhenfen Jin Zhejiang University Jiangpeng Shu ( jpeshu@zju.edu.cn ) Zhejiang University Research Keywords: Crack detection, feature pyramid network, steel structures, high-resolution image Posted Date: May 20th, 2021 DOI: https://doi.org/10.21203/rs.3.rs-509066/v1 License: This work is licensed under a Creative Commons Attribution 4.0 International License. Read Full License
Deep learning-based fatigue cracks detection in bridge girders

 using feature pyramid networks

 Jun Li1, Zhenfen Jin2, Jiangpeng Shu1*
Abstract
 For structural health monitoring and inspection of infrastructures, continuous and automatic
crack detection has been a challenging problem. This study is conducted to propose a
framework of automatic crack segmentation from high-resolution images containing crack
information about steel box girders of bridges. Considering the multi-scale feature of cracks, a
processing flow based on convolutional neural network architecture of Feature Pyramid
Networks (FPN) for high-resolution crack images is proposed. In the experiments, 120 raw
images of 3264 × 4928 pixels or 3864 × 5152 pixels are processed via two approaches (the
proposed method and shrinking the size of images). The comparison results show FPN in the
proposed method can achieve the highest Intersection over Union (IoU) of 0.78 and the lowest
Dice loss of 0.12. When shrinking the size of high-resolution images, details of crack edges are
lost and the segmentation accuracy is reduced. The proposed method can maintain the original
information of high-resolution images and perform automatic and accurate pixel-wise crack
detection.
Keywords: Crack detection; feature pyramid network; steel structures; high-resolution image

1. Introduction
 Numerous civil infrastructures such as aged buildings and bridges have gradually
approached their design life expectancy, which could cause harmful effects on the safety of
people [1]. Therefore, it is necessary to effectively check and evaluate the integrity of the civil
structure. However, the currently used human-based visual inspection is limited by the training
of the inspector and the high labor cost. There are also problems with unreliable inspection
results as well as the time it takes.
 As computer vision has made remarkable achievements in various fields, such as object
recognition, image segmentation and image classification, more and more researchers start to
focus on the research of concrete damage detection based on computer vision. Some of the
well-known image processing techniques of computer vision are least square method[2], image
binarization methods[3] percolation models[4] and so on. However, most of the traditional
image analysis methods focus on crack detection under non-complex conditions. For this reason,
its applications are limited because of the great variation of image data with lots of noise and

 *
 Correspondence: jpeshu@zju.edu.cn

 College of Civil Engineering and Architecture, Zhejiang University, 310058 Hangzhou, China
 1

 Center for Balance Architecture, Zhejiang University, 310058 Hangzhou, China
 2
complex background, from engineering practice.
 Structural damage inspection is essential for the safety of in-service civil structures, and
thus many research groups have utilized the deep learning-based approaches to conduct damage
detection on a variety of structures. And because of the great success of deep convolutional
neural networks (DCNN), more and more algorithms based on DCNN have been proposed for
the application of structural damage inspection like concrete damage detection and crack
semantic segmentation. Considering the multilevel and multi-scale features of the crack images,
a modified fusion convolutional neural network architecture is proposed[5]. And original crack
images are cut into several elements with small size as the input dataset[6]. A three-level deep
learning-based method of the inspection of post-disaster bridges was developed with VGG-
16[7], Faster R-CNN and SegNet were used to detect system-level failure, component -level
and local -level damage respectively. A CNN-based approach was developed to detect bridge
damages by acceleration responses[8]. And another five-layer CNN was designed to detect and
classify anomalous monitoring data from an SHM system[9]. A semantic segmentation neural
network based on SegNet[10] was proposed to automatically localize concrete cracks. Similarly,
an U-Net[11] based concrete crack detection framework was developed, which able to identify
crack locations under various conditions with the complex background with high efficiency and
robustness. Researchers have developed another crack detection system[12] based on FCN,
which uses VGG[13] as an encoder. In 2017, Lin et al. [14] introduced a new network
architecture called Feature Pyramid Network (FPN). FPN uses a pyramidal hierarchy of deep
convolutional networks to construct feature pyramids with marginal extra cost. FPN is
renowned for its object detection capabilities. It can improve small object detection by
enhancing shallow features. And its architecture shows significant improvement as a generic
feature extractor in several applications[15][16][17].
 In this paper, to train a model for the semantic segmentation of fatigue crack from dataset
of high-resolution images, an approach for automatic crack segmentation task based on an
improved fully convolutional neural network of FPN is proposed. Before inputting the data set
into the neural network, an image preprocessing method will be performed on the dataset,
according to the characteristic of crack. After getting the predicted picture, IoUs of the predicted
pictures are calculated respectively. In the end, the effectiveness of the proposed methods is
discussed and compared.

2. Methods
 In this section, the proposed method based on FPN for high-resolution crack images is
introduced. The preprocessing flows for images to construct a dataset for network training and
testing is presented. Then, the structure of Feature Pyramid Network (FPN) is detailed.

2.1 Preprocessing of high-resolution crack images
 The core of deep-learning method for crack segmentation tasks is the dataset. Considering
the long and thin characteristics of crack and the feature sensing ability of FPN, a new
preprocessing method is proposed to build datasets of high-resolution crack images. The
preprocessing method has two main parts: dataset for training and dataset for testing. In the
following, the processing flow to build a training set with high-resolution crack images and the
flow to generate predictions with high-resolution images as input during testing are detailed.
2.1.1 Training set
 Segmentation for cracks doesn’t need the full-size object information. Even with the
fragment of cracks presented, the crack damage can still be recognized. Thus, the proposed
method aims to achieve a balance between efficiency and accuracy by splitting high-resolution
images into sub-images in a certain processing flow. For an initial high-resolution crack image
(assuming the size is h × w; h is the height of the image and w is the width of the image), there
are three steps to generate the images for training the network. First, determine a certain split
size, 32m × 32n (m and n are integers greater than 1). The m and n are limited by the compute
resources. The initial image will be padded with 0 around it, to make sure the size of the image
is the multiple of 32m × 32n. The image size after padding is H × W, calculated as the following
equation:
 ℎ
 = ([ ] + 1) 32 (1)
 32

 = ([ ] + 1) 32 (2)
 32

The second step is using a sliding window of 32m × 32n to crop the padding image. The strides
in rows/columns are 16m/16n. The third step is to pick out those sub-images containing crack
pixels, according to the corresponding labels. Assume the number of sub-images is k. To ensure
the deep-learning network can learning enough background features, k sub-images that only
contain background images is randomly picked out. In the final, from an initial high-resolution
image, 2k sub-images of 32m × 32n size are obtained, including crack and complex background.
In the three steps, any size of high-resolution images can be put into the crack segmentation
network as the training data.
2.1.2 Testing set
 In testing, the inputs of the network are high-resolution crack images. However, similar to
the processing flow for the training set, some preprocessing approaches are applied for input
images. Still assume the input high-resolution crack image is h × w. To cover the edge of crack
images, the input is first padding into a size of H × W with 0, calculated as:
 ℎ
 = ([ ] + 2) 32 (3)
 32

 = ([ ] + 2) 32 (4)
 32

 Where the value of m and n is the same as the one in last section.
 Then, a sliding window of 32m × 32n is adapted to sample the padding image. The strides
in rows/columns are 32m/32n.To cover the edge of samples of 32m × 32n, using the public
point of four adjacent samples as the center point, a series of samples are obtained again. All
the samples then are taken as the final input for the trained network. After the network yields
predictions, the predict of samples are assembled back to a padding image, following the sample
rule. After removing the padding zone, the whole crack prediction of h × w is got.
2.2 The structure of FPN
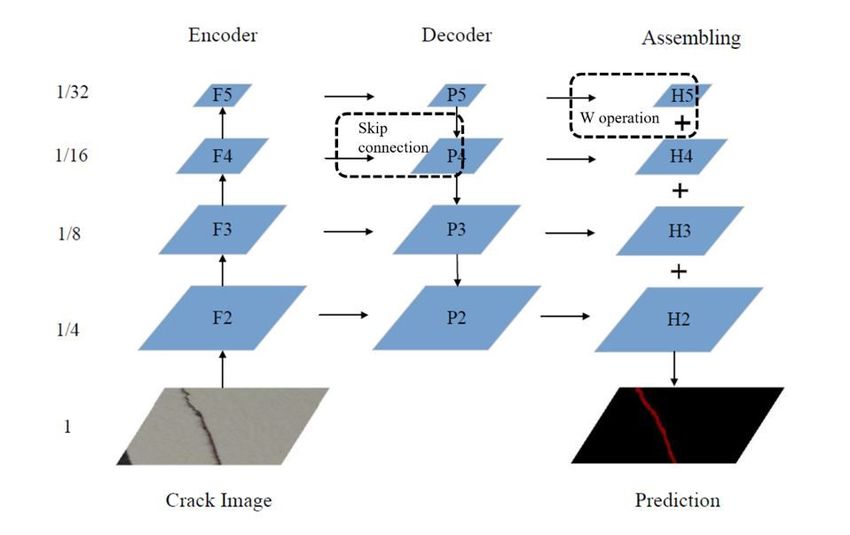
The network structure is roughly divided into three parts, namely encoder, decoder and
assembling, as shown in Fig. 1. The encoder is the feedforward process of the convolutional
network, which extracts feature vectors at different stages, and the feature resolution is
continuously reduced. The decoder is the process of bottom-up feature map enlargement. The
top-level feature map is merged with the bottom-level feature map through upsampling to
enrich semantic information. After the fusion, a 3×3 convolution kernel will be used to
convolve each fusion result. The purpose is to eliminate the aliasing effect of upsampling.
Finally, in the assembling part, the feature maps of each stage are added to obtain each layer
information, which makes the FPN have strong semantic information, and meet the
requirements of speed and memory. The difference in FPN is that the prediction is carried out
independently in different feature layers, which is helpful to detect crack targets of different
sizes.
2.2.1 Encoder
 The encoder part is a feature extraction network, which generally uses VGG[18] and
ResNet[19] as a backbone. To pursue better feature extraction results, se_resnext50_32x4d[20]
is adopted. It includes three parts, ResNet, Squeeze-and-Excitation (SE) block, and X. ResNet’s
residual block allows the network to be deeper, faster to converge, and easier to optimize. At
the same time, it has fewer parameters and lower complexity than the previous model, which is
suitable for a variety of computer vision tasks. SE block is a computational unit adopted from
SENet[20]. Squeeze executes a global average pooling and obtains feature maps with global
receptive fields. Excitation uses a fully connected neural network to get a nonlinear
transformation on the result after Squeeze, and then use it as a weight to multiply the input
feature. SENet mainly learns the correlation between channels, filters out the attention to the
channel, and slightly increases the amount of calculation, but the effect is better. X comes from
ResNeXt[21], an upgraded version of ResNet. The core innovation of ResNeXt lies in the
proposed aggregated transformations, which replaces the original ResNet's three-layer
convolutional block with a parallel stacked block of the same topology, which improves the
accuracy of the model without significantly increasing the magnitude of the parameter. At the
same time, due to the same topology, the hyperparameters are also reduced, which is convenient
for model transplantation. ReNext50_32x4d is improved from ResNet50 with 50 layers. 32x4d
represents 32 paths, and the number of channels for each path is four. Finally, the SE block is
embedded in ReNext50_32x4d to get the final network se_resnext50_32x4d. And its pre-
training parameters are obtained from imagenet1000.
 Therefore, the encoder part is a bottom-up crack feature extraction network with
se_resnext50_32x4d as the backbone. At the entrance of the encoder, the input crack image size
is uniformly cropped to 640×480. And a stage corresponds to a level of the feature pyramid in
subsequent operations. The features extracted from conv2, conv3, conv4 and conv5 layers are
selected as {C2, C3, C4, C5}, which are the four levels of FPN network. The feature vectors
are 2 = ( , 256, 120, 160) , 3 = ( , 512, 60, 80) , 4 = ( , 1024, 30, 40) ,
 5 = ( , 2048, 15, 20) respectively. It should be noted that since the last one F5 is 1 / 32,
the length and width of the crack image should be a multiple of 32.
2.2.2 Decoder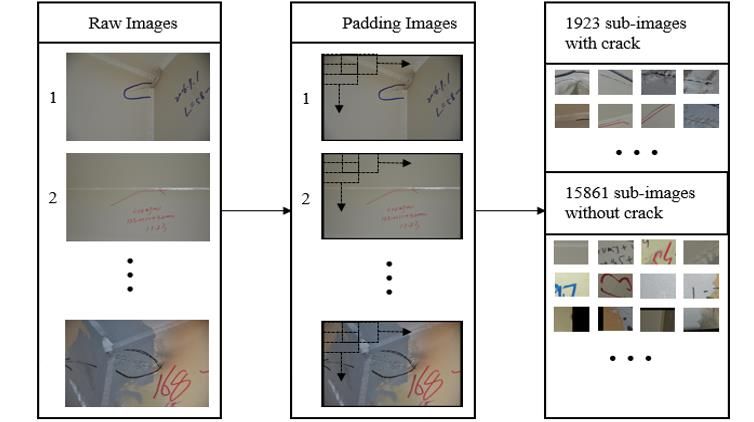
The decoder part is a top-down process of enlarging crack feature map. 5 =
 ( , 256, 15, 20) is directly obtained from F5 through a 1×1 convolutional layer. In the
following operations, P5 is magnified twice to ( , 256, 30, 40) by interpolation algorithm. F4
undergoes a 1×1 convolutional layer and becomes ( , 256, 30, 40). The above two feature
vectors are added to form 4 = ( , 256, 30, 40). These operations are called skip connection,
as shown in Fig. 2(a), which are continued using to get P4, P3 and P2.
 The cleverness of skip connection (Fig. 2(a)) is that it can make use of both the high-level
semantic features of the top layer (helpful for crack feature classification) and the high-
resolution information of the bottom layer (helpful for crack feature location).
2.2.3 Assembling
 For the following assembly assembling operation, the output feature vector of each level of
the pyramid should be the same resolution. An operation W contains a 3 × 3 convolution layer
and double linear interpolation amplification are chosen to meet the goal, as shown in Fig. 2(b).
P5 changes to 5 = ( , 256,120,160) after three W operations. And so on, H4 and H3
undergo two and one W operation respectively. Besides, H2 does not need to be amplified. Then,
 ( = 2~5) are directly added to get a vector ( , 256,120,160). This vector undergoes a
3 × 3 convolution layer and a bilinear interpolation enlarging to original crack image size
( , 1,480,640). In order to facilitate the prediction process, the mask = ( , 1, 480, 640) is
obtained by an activation function sigmoid whose values are changed to 0~1. If the value of a
point is larger than a fixed threshold, the point is predicted as crack. And in this experiment,
0.5 is chosen as the threshold. According to this mechanism, the criterion of IoU is calculated.

 Fig. 1 The structure of FPN for crack detection
(a) (b)
 Fig. 2 (a) the skip connection; (b) the W operation of FPN

3. Experiments and results
 All experiments are performed on a computing platform including an Intel(R) Xeon(R) E5-
2678 v3 @ 2.50GHz with 64.0GB RAM and an NVIDIA RTX2080TI with 11.0GB RAM.

3.1 Evaluation dataset
 There are a total of 120 raw images provided by the International Project Competition for
SHM (IPC-SHM 2020) ANCRiSST[22]. These raw images include crack information inside a
steel box girder[6]. Representative raw images and labels are shown in Fig. 3. These raw images
are in RGB with a resolution of 3264 × 4928 pixels or 3864 × 5152 pixels, and the labels are in
grayscale with a resolution of 3264 × 4928 pixels or 3864 × 5152 pixels. Before the experiments,
the 120 raw images are randomly divided into two sets: a basic training set with 100 images
and the rest 20 for testing. It is time-consuming and large memory storage required to directly
use images with a high resolution as input. To achieve a trade-off between computation
performance and accuracy, the traditional processing method of shrinking the size of images is
taken the comparing method with the proposed method in the study.
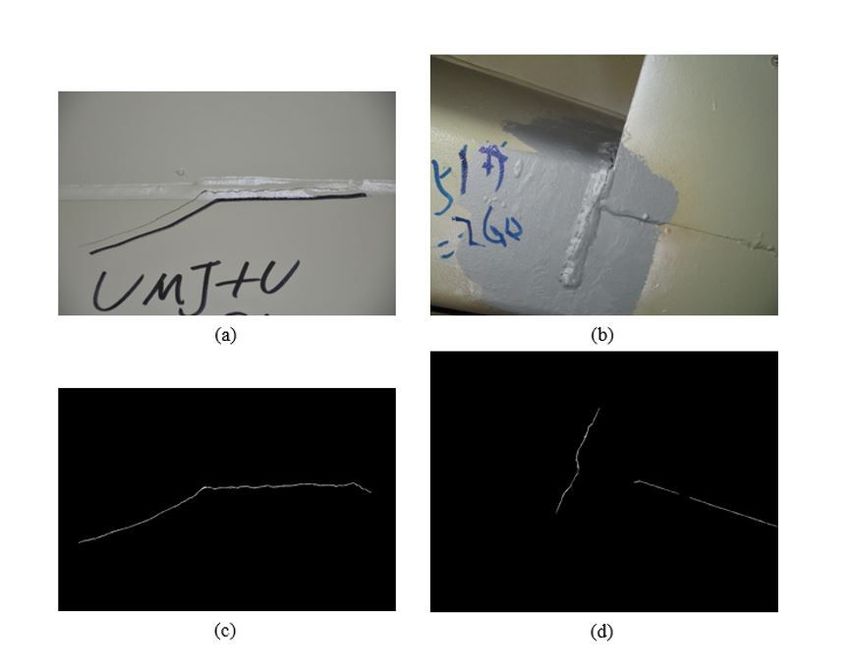
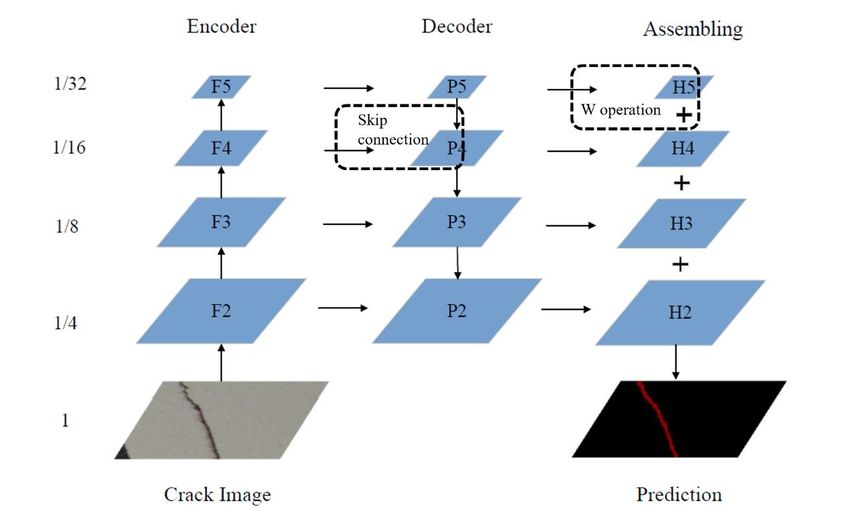
Fig. 3 (a) a raw image of 3264 × 4928 pixels, (b) a raw image of 3864 × 5152 pixels, (c)
 the label of the raw image (a), (d) the label of the raw image (b).
 Images in the basic training set with different resolutions are all resized into 1600 × 2400
pixels or 2112 × 3168 pixels by using a bilinear interpolation method. To examine the influence
on predictions caused by the resizing process, two different size changes (1600 × 2400/2112 ×
3168) as mentioned above are applied to the images of the basic training set. For convenience,
a training set in which images are resized into 1600 × 2400 pixels is named TS1, and a training
set in which images are of 2112 × 3168 pixels is denoted as TS2.
 The sub-images are 480 × 640 pixels. Before splitting the images, images of 3264 ×
4928/3864 × 5152 pixels are first padding into 3360 × 5120/4320 × 5760 with zeros which can
contribute to collecting the edge information of one image. After padding, a stride of 320/320
pixels in rows/columns is applied to the images in the basic training set, getting all 15861 sub-
images and 15861 correspond sub-labels. The processing flow is shown in Error! Reference
source not found..
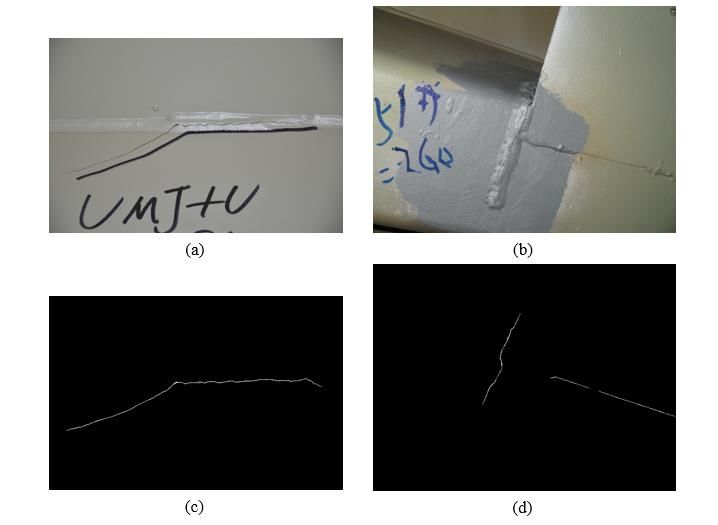
Fig. 4 The splitting process flow in training.

 These sub-images are overlapping and some sub-images contain the padding part. Utilizing
all 15861 sub-images as input requires much training time. Thus, according to the
corresponding sub-labels, 1923 sub-images that contain pixels belonging to crack damage are
automatically selected out. These 1923 sub-images make up a training set, named TS3. The rest
13938 sub-images contain no pixel belonging to crack damage and indicate the background
information. Among the rest 13938 sub-images, 1923 sub-images are chosen randomly. 1923
crack sub-images and 1923 background sub-images construct another training set, named TS4.
When training, image augmentations are often applied to the input images. The illustrations of
all datasets for training are shown in Table 1.
 Table 1 Detail of evaluation datasets

 Name Num of Images Size of Images

 TS1 100 1600 × 2400
 TS2 100 2112 × 3168

 TS3 1923 480 × 640

 TS4 3846 480 × 640

3.3 Evaluation matrix
 To validate the performance of trained models, predictions of a test image from the four
models are respectively compared with the corresponding label of the test image. Here, two
evaluation indexes are used. Dice Loss[23] is a common judgment index of segmentation
results. In a crack segmentation task, X is corresponding labels of images; and Y is predictions
of images. The Dice Loss is defined as
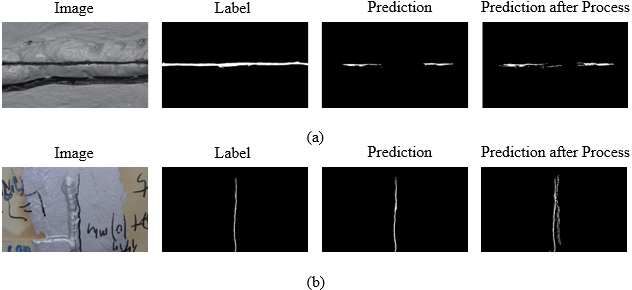
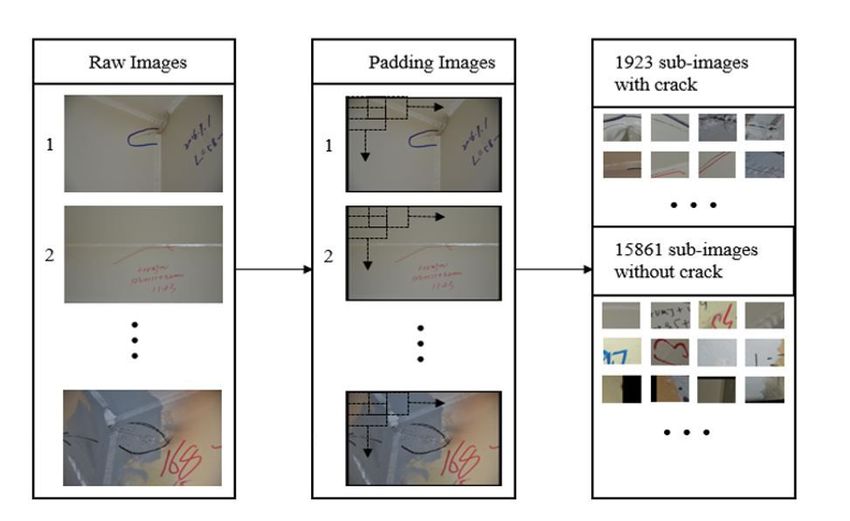
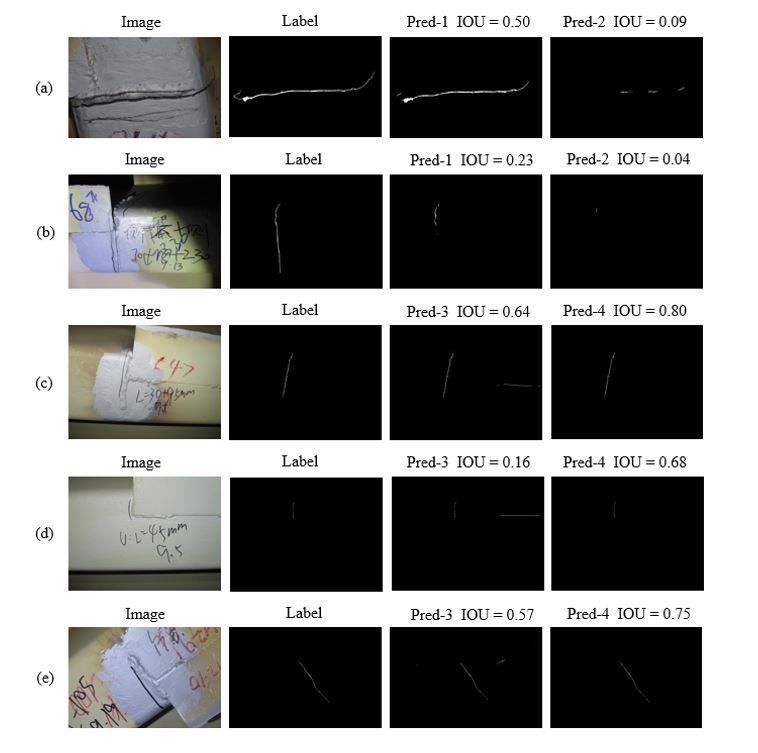
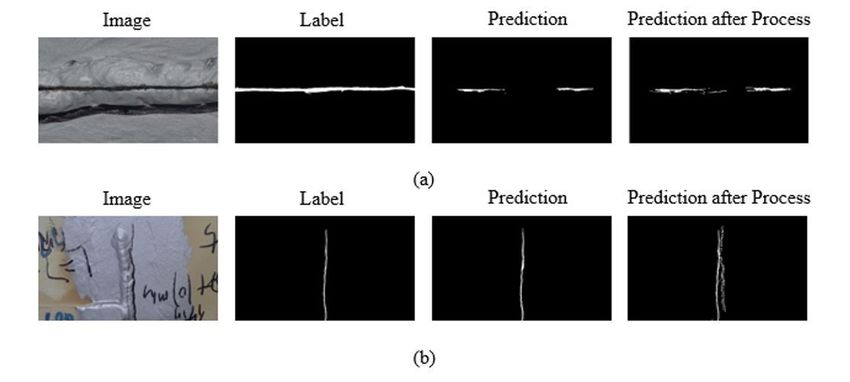
2| ∩ |
 = 1 − (5)
 | | + | |

 Another judgment index is IoU (Intersection over Union). The num of pixels which in both
label and prediction belong to crack damage is I, and the num of pixels which in label or
prediction either are indicating crack damage is U. The IoU is denoted as

 = (6)

3.4 Results and Discussions
 Four models with the same network architecture are trained based on four different training
sets. Using the resizing method, Model1 and Model2 are trained with TS1 and TS2 and in the
way of the splitting method, Model3 and Model4 are trained with TS3 and TS4. The mean IoUs
and mean Dice Losses of 20 predictions from four trained models using 20 test images are
shown in Fig. 5. For convenience, the IoUs of predictions are the main target used to discuss
the performance of four models in the following.

 (a) (b)
 Fig. 5 (a) The IoUs of four trained models; (b) the Dice Losses of four trained models.

 From Fig. 5, Model2 shows a bit better performance than Model1 on the 120 test images in
terms of IoU and Dice Loss. After analyzing the predictions from Model1 and Model2, one
noteworthy phenomenon is observed. As shown in Fig. 6, predictions from Model1 and Model2
both ignore some parts of the cracks in test images, resulting in that the length of cracks in
predictions is shorter than cracks in the labels and that some parts of cracks are lost in the
predictions. One reason for the phenomenon is the bilinear interpolation algorithm used to
resize image shape. The bilinear interpolation considers the closest 2 × 2 neighborhood of
known pixel values surrounding the unknown pixel's computed location. It then takes a
weighted average of these 4 pixels to arrive at its final, interpolated value. Using the resizing
method means that not every pixel in the test image is predicted, but the statistic values of pixels
are predicted. On the one hand, predictions from Model1 and Model2 can’t match the label at
the pixel level. On the other hand, the predictions can still indicate the positions of the cracks.
Based on the positions predicted by Model1 and Model2, some processes can be used to
improve the predictions of crack. Crack length can be extended with dilation and threshold
algorithm. In Fig. 7(a), the crack in the prediction is extended after processing. But this
approach is not suitable for all the predictions. As shown in Fig. 7(b), the black line is
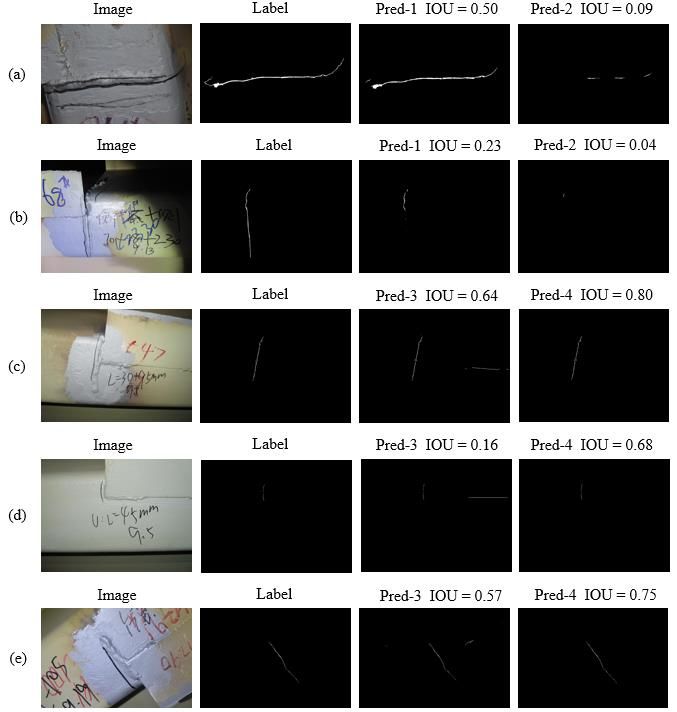
considered as crack damage by the Threshold algorithm. With the researcher’s manual selection,
it may be an acceptable idea to improve the accuracy of Model1 and Model2.

Fig. 6 Some samples of images and predictions (Note that the predictions from Model1 are be
 abbreviated to Pred-1; Other notations follow the same rule).

 From Fig. 5, the IoU of Model1 is just 0.02 less than that of Model2. The size of images in
TS1 is almost one-third of the image size of TS2. It indicates a much bigger size of images can
not improve the predictions too much. However, images of big size as inputs need much
memory storage. When resizing the images to get a new training set, computer efficiency, not
the size of images, is suggested being first considered.
 Without pixels losing, the splitting method achieves improvement on IoUs. The IoUs of
Model3 and Model4 are 0.70 and 0.78. Because Model3 is trained only on the crack sub-images
(TS3), some background information is ignored. In Fig. 6 (c) and (d), it’s shown that Model3
wrongly predicts some pixels on the edge as cracks, and some groove features of the steel box
are also predicted as cracks. Although predictions from Model3 are less accurate than those
from Model4, Model3 provides a safe estimate in structural health monitoring. From Fig. 6(e),
it can be seen that the main crack of the structure is predicted using Model3 and some suspicious
features are also considered as cracks, which guarantees no crack damage is missed. Although
the IoU of Model3 is not the best, the Model has an ideal characteristic in engineering. Trained
with TS4, Model4 becomes more excellent and more accurate than Model3. Model4 learned
both the background information and crack information. In Fig. 7(c), (d), and (e), Model4 has
the best performance. The disturbance of the background and grooves is dealt with very well.
A high degree of accuracy means Model4 can provide precise crack information for the next
research or measurement.
 Model3 and Model4 perform better than Model1 and Model2 for the crack segmentation
task. For images of the basic training set, the splitting method is proved as a better solution than
the resizing method. Crack segmentation task isn’t like the segmentation of cats, dogs, and so
on. A part of crack obtains enough information to be detected. Hence, the splitting method is
an ideal way of the crack segmentation task. Moreover, the splitting method doesn’t have any
requirement for the resolution of images. It’s suitable for both high-resolution and low-
resolution images.

 Fig. 7 Samples of processing predictions using the dilate and threshold algorithm.

4. Summary and conclusions
 To conduct damage detection using high-resolution images containing both complex
backgrounds and cracks inside a steel box girder, an innovative method based on the
convolutional neural network architecture of Feature Pyramid Networks (FPN) for crack
detection is proposed. The performance and accuracy of the proposed framework were
validated. Conclusions from the study are summarized as follows:
1) The proposed framework for crack segmentation using FPN shows powerful capability in
 crack detection for high-resolution crack images. The IoU for testing reaches 0.78 in
 maximum and the Dice loss reaches 0.12 in minimum. The proposed framework
 demonstrates a strong sense of semantic information and the ability to detect target cracks
 of different sizes.

2) Compared with the proposed method, resizing high-resolution images with a bilinear
 interpolation algorithm will cause the loss of information and reduce the accuracy of crack
 segmentation. When resizing high-resolution images, images can shrink much smaller
without decreasing segmentation accuracy much.

3) Parts of crack can provide enough information for identification. In the segmentation task
 of crack, splitting images into small samples is proved as an excellent solution for high-
 resolution images. By splitting images, every pixel in the images is predicted and pixels
 belonging to crack damage are precisely annotated. A high degree of accuracy means this
 method provides a promising solution for crack detection tasks in the future.

Abbreviations
 DCNN: Deep Convolutional Neural Networks; SHM: Structure Health Monitoring; FPN:
Feature Pyramid Network; IoU: Intersection over Union.

Acknowledgment
 The authors would like to gratefully acknowledge the support from the National Key R&D
Program of China (2018YFE0125400) and the National Natural Science Foundation of China
(U1709216), which made the research possible.

Authors’ contributions
 JL and ZJ conducted experiments and JS wrote the article.

Funding
National Key R&D Program of China (2018YFE0125400); National Natural Science
Foundation of China (U1709216)

Availability of data and materials
 The data and code are available upon request

Declarations
 Competing interests: The authors declare that they have no competing interests

Reference:
 1. Gao Y, Mosalam KM (2018) Deep Transfer Learning for Image-Based Structural
Damage Recognition. Computer-Aided Civil and Infrastructure Engineering, 33(9):748–768.
https://doi.org/10.1111/mice.12363
 2. Fujita Y, Mitani Y, Hamamoto Y (2006) A method for crack detection on a concrete
structure. Proceedings - International Conference on Pattern Recognition, 3(1):901–904.
https://doi.org/10.1109/ICPR.2006.98
 3. Oliveira H, Correia PL (2009) Automatic road crack segmentation using entropy and
image dynamic thresholding. European Signal Processing Conference,
 4. Yamaguchi T, Nakamura S, Saegusa R, Hashimoto S (2008) Image-based crack
detection for real concrete surfaces. IEEJ Transactions on Electrical and Electronic
Engineering, https://doi.org/10.1002/tee.20244
 5. Xu Y, Bao Y, Chen J, Zuo W, Li H (2019) Surface fatigue crack identification in steel
box girder of bridges by a deep fusion convolutional neural network based on consumer-grade
camera images. Structural Health Monitoring, 18(3):653–674.
https://doi.org/10.1177/1475921718764873
 6. Xu Y, Li S, Zhang D, Jin Y, Zhang F, Li N, Li H (2018) Identification framework for
cracks on a steel structure surface by a restricted Boltzmann machines algorithm based on
consumer-grade camera images. Structural Control and Health Monitoring, 25(2):1–20.
https://doi.org/10.1002/stc.2075
 7. Liang X (2019) Image-based post-disaster inspection of reinforced concrete bridge
systems using deep learning with Bayesian optimization. Computer-Aided Civil and
Infrastructure Engineering, https://doi.org/10.1111/mice.12425
 8. Duan Y, Chen Q, Zhang H, Yun CB, Wu S, Zhu Q (2019) CNN-based damage
identification method of tied-arch bridge using spatial-spectral information. Smart Structures
and Systems, https://doi.org/10.12989/sss.2019.23.5.507
 9. Tang Z, Chen Z, Bao Y, Li H (2019) Convolutional neural network-based data anomaly
detection method using multiple information for structural health monitoring. Structural
Control and Health Monitoring, https://doi.org/10.1002/stc.2296
 10. Sajedi SO, Liang X (2019) A convolutional cost-sensitive crack localization algorithm
for automated and reliable rc bridge inspection. Risk-based Bridge Engineering - 10th
NewYork City Bridge Conference, 2019, https://doi.org/10.1201/9780367815646-19
 11. Liu Z, Cao Y, Wang Y, Wang W (2019) Computer vision-based concrete crack
detection using U-net fully convolutional networks. Automation in Construction,
https://doi.org/10.1016/j.autcon.2019.04.005
 12. Dung CV, Anh LD (2019) Autonomous concrete crack detection using deep fully
convolutional neural network. Automation in Construction,
https://doi.org/10.1016/j.autcon.2018.11.028
 13. Simonyan K, Zisserman A (2014) VGG-16. arXiv preprint,
https://doi.org/10.1016/j.infsof.2008.09.005
 14. Lin TY, Dollár P, Girshick R, He K, Hariharan B, Belongie S (2017) Feature pyramid
networks for object detection. Proceedings - 30th IEEE Conference on Computer Vision and
Pattern Recognition, CVPR 2017, 2017-Janua:936–944.
https://doi.org/10.1109/CVPR.2017.106
 15. Ghiasi G, Lin TY, Le Q V. (2019) NAS-FPN: Learning scalable feature pyramid
architecture for object detection. Proceedings of the IEEE Computer Society Conference on
Computer Vision and Pattern Recognition, https://doi.org/10.1109/CVPR.2019.00720
 16. Liang Y, Changjian W, Fangzhao L, Yuxing P, Qin L, Yuan Y, Zhen H (2019) TFPN:
Twin feature pyramid networks for object detection. Proceedings - International Conference
on Tools with Artificial Intelligence, ICTAI, https://doi.org/10.1109/ICTAI.2019.00251
 17. Kirillov A, Girshick R, He K, Dollar P (2019) Panoptic feature pyramid networks.
Proceedings of the IEEE Computer Society Conference on Computer Vision and Pattern
Recognition, https://doi.org/10.1109/CVPR.2019.00656
 18. Simonyan K, Zisserman A (2015) Very deep convolutional networks for large-scale
image recognition. 3rd International Conference on Learning Representations, ICLR 2015 -
Conference Track Proceedings, :1–14.
 19. He K, Zhang X, Ren S, Sun J (2016) Deep residual learning for image recognition.
Proceedings of the IEEE Computer Society Conference on Computer Vision and Pattern
Recognition, https://doi.org/10.1109/CVPR.2016.90
 20. Hu J, Shen L, Albanie S, Sun G, Wu E (2020) Squeeze-and-Excitation Networks.
IEEE Transactions on Pattern Analysis and Machine Intelligence, 42(8):2011–2023.
https://doi.org/10.1109/TPAMI.2019.2913372
 21. Xie S, Girshick R, Dollár P, Tu Z, He K (2017) Aggregated residual transformations
for deep neural networks. Proceedings - 30th IEEE Conference on Computer Vision and
Pattern Recognition, CVPR 2017, 2017-Janua:5987–5995.
https://doi.org/10.1109/CVPR.2017.634
 22. Engineering E (2021) Damage analysis and protection suggestion of timber structure
of Tong-Dao Hall in the Imperial Palace. https://doi.org/10.11835/j.issn.2096-6717.2021.056
 23. Milletari F, Navab N, Ahmadi SA (2016) V-Net: Fully convolutional neural networks
for volumetric medical image segmentation. Proceedings - 2016 4th International Conference
on 3D Vision, 3DV 2016, :565–571. https://doi.org/10.1109/3DV.2016.79
Figures

Figure 1

The structure of FPN for crack detection
Figure 2

(a) the skip connection; (b) the W operation of FPN
Figure 3

(a) a raw image of 3264 × 4928 pixels, (b) a raw image of 3864 × 5152 pixels, (c) the label of the raw
image (a), (d) the label of the raw image (b).
Figure 4

The splitting process ow in training.

Figure 5

(a) The IoUs of four trained models; (b) the Dice Losses of four trained models.
Figure 6

Some samples of images and predictions (Note that the predictions from Model1 are be abbreviated to
Pred-1; Other notations follow the same rule).
Figure 7

Samples of processing predictions using the dilate and threshold algorithm.
You can also read