Evaluation of soil fertility status for available sulphur in various location of Myorpur block, district Sonbhadra, Uttar Pradesh, India - JOURNAL ...
←
→
Page content transcription
If your browser does not render page correctly, please read the page content below
Singh et al. (2019) / J. Biosci. Agric. Res. 19(01): 1597-1605                 https://doi.org/10.18801/jbar.190119.194

                                         Published with Open Access at Journal BiNET
                                                   Vol. 19, Issue 01: 1597-1605
                                  Journal of Bioscience and Agriculture Research

                                     Journal Home: www.journalbinet.com/jbar-journal.html

Evaluation of soil fertility status for available sulphur in various
location of Myorpur block, district Sonbhadra, Uttar Pradesh,
India
Shishu Pal Singh1, Jay Prakash Verma2, Shivraj Singh3 and Rajesh Kumar4

1Department   of Agriculture, Unit of Soil Survey, Chandpur, Varanasi, India
2 Banaras Hindu University, Varanasi, Uttar Pradesh, India
3Department of Environment Sciences, P G College Gazipur, Uttar Pradesh, India
4 Sri Babu Singh Daddu Ji Agriculture College, Baghar Fatehgarh, Farrukhabad, India.

✉ For any information: ask.author@journalbinet.com
   Article received: 18.06.18; Revised: 24.12.18; First published online: 25 January 2019.

    ABSTRACT

    Available sulphur status in soils of Myorpur block, district Shonbhadra, Utter Pradesh, India was
    studied to evaluate soil fertility. For this purpose, thirty soil samples (0-15 cm depth) were randomly
    collected from 30 different GPS locations. All the collected soil samples were analyzed for pH,
    Electrical Conductivity, Organic Carbon, available sulphur as per standard procedures. The
    available S content in soils of shonbhadra district varied from 11.60-33.30 kgha-1 with a mean value
    21.39 kgha-1. Results reveal that the 90 percent of the soil samples were found under low category
    (< 22.4 kgha-1) as per nutrients index value. Nutrient Index Value (NIV) of Shonbhadra district was
    below 1.67 due to acidic soil reaction and low content of organic matter in soil and also due to
    continuous removal of sulphur by the crops for intense cultivation without using sulphur
    fertilization. For this reason, enrichment and or modification of soil acidity and organic matter
    content at desired level, as well as frequent application of sulphur fertilizer during crop growing
    seasons is essential for reducing or changing sulphur deficiency or status for agricultural crops. Soils
    would highly need sulphur management through addition of inorganic sulphur, organic manures
    or sulphonated compost and biocomposts or gypsum, sulphur - solubilizing microbes.
     Key Words: Available Sulphur, Nutrient Index Value, nutrient management and soil analysis

Cite Article: Singh, S. P., Verma, J. P., Singh, S. and Kumar, R. (2019). Evaluation of soil fertility status
for available sulphur in various location of Myorepur block, district Sonbhadra, Uttar Pradesh, India.
Journal of Bioscience and Agriculture Research, 19(01), 1597-1605.
Crossref: https://doi.org/10.18801/jbar.190119.194

     Article distributed under terms of a Creative Common Attribution 4.0 International License.

I. Introduction
Cropping systems, application of manures and fertilizers and other activities during cultivation are
responsible for changes in soil fertility. Soil analysis and consequently fertilizer recommendation
(Sultana et al. 2015) is very significant for any cropping system and farm sustainability and this practice
                                                                                                                  1597
Published with open access at journalbinet.com
EISSN: 2312-7945, © 2019 The Authors, Research paper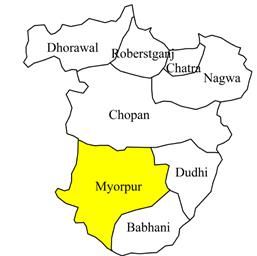
Soil fertility status of Sonbhadra district, Uttar Pradesh, India

should be communicated adequately with the farmers and community. It is expected ideally that every
farm would be sampled and evaluated for soil analysis and evaluated against soil properties such as soil
aggregate stability (Siddique et al. 2017). Any application of chemical fertilizers in cropping system
should be justified based on the requirement of crops (plant nutrients requirements) and soils (for
example pH, OM status, N mineralization, total N and cation exchange capacity of soils) (Siddique, 2015;
Ahmed et al. 2014) Recent agricultural practices with high yielding varieties obviously increase yields
and profitability but these practices are responsible for land degradation, soil acidity, water pollution,
safe water scarcity, pesticide residual in farm produce, atmospheric and water pollution (Khan et al.
2017; Hossain 2015; Siddique et al. 2014; Kamaruzzaman et al. 2014; Halim et al. 2014; Sultana et al.
2014; Nduwumuremyi, 2013). To avoid these land and physical resource degradation it is essential to
evaluate soils characteristics at preferred scales and dimensions such as soil fertility mapping, textural
fractions characterization and management zones identification for land areas to support farm
management decisions (Siddique 2015; Siddique et al. 2014a). For increasing soil fertility, plant
nutrients efficiency and plant nutrients uptake by microorganisms such as arbuscular mycorrhizal fungi
(AMF) soil degradation should be avoided at any cost for arable lands (Sultana et al. 2017; Sultana and
Siddique, 2015). In addition, the actors involve is production system is also require to be identified for
sustainable productivity (Siddique et al. 2015a). Agricultural soils of India do not possess adequate soil
fertility because soil nutrients are being depleted regularly for the intensive agricultural practices over
the many years. Therefore, soil fertility status need to be estimated and determined frequently as there
is prolonged extraction of plant nutrients (macro and micronutrients) by the crops extensively grown
in each crop-growing season.

For the management of soil fertility, level of fertility of arable lands is imperative and level of fertility
based on soil analysis can facility soil management at farm level. However, status of fertility is usually
determined by the presence and or absence of plant nutrients, i.e., macro and micronutrients that are
necessary for plants. Only adequate and or balanced nutrients availability in soils can ensure higher
level of farm profitability and crop yield returns; and helps. Goovaerts (1998) stated that ‘’soil test-based
fertility management is an effective tool for increasing productivity of agricultural soils that have high
degree of spatial variability resulting from the combined effects of physical, chemical or biological
processes”. Nevertheless, the wider adoption of fertilizer recommendation by soil test based approach
is constraints in many ways at farmer level in the developing countries (Sultana et al. 2015). For
developing countries like India and Bangladesh, these constraints include the persistence of stallholder
management systems, absence of skilled human resource, extension activities, lack of infrastructural
facilities such as soil analysis laboratories in district and sub-district level to facilitate extensive soil
testing (Sultana et al. 2015; Sen et al. 2008). There is no doubt that soil test based fertilizer
recommendation is essential in farming systems of Asia and beyond to uphold productivity and
maintain farm soil fertility. In some developing countries, there are soil fertility maps, which are meant
for highlighting/interpreting the nutrient status(s) as well as plant nutrient(s) requirement assumption
decisions. Based on soil fertility status of arable lands, these maps prevails also adverse land conditions,
which require attention of planners for improvement. However, soil test values are used to determine
soil nutrients status critical levels such as low, medium and high level of nutrient (Welch et al. 1987).
The recent technologies like Global Positioning System (GPS) thus have much to offer for preparing soil
fertility maps.

In consideration to Indian agriculture, after nitrogen, phosphorus and zinc, sulphur is considered the
fourth most important plant nutrient. This nutrient element is known for protein synthesis, synthesis of
plant oils, vitamin and flavored compounds. The building blocks of protein, amino acids such as
Methionine (21% S), Cysteine (26% S) and Cysteine (27% S), are the three main constituents of Sulphur.
Plant sulphur in 90% of cases present as these amino acids. In addition, the formation of chlorophyll,
glucosides and glucosinolates (mustard oils), activation of enzymes and sulphydryl (SH-) linkages that
are the source of pungency in onion, oils, etc., sulphur play a significant role. Tondon (1995) mentioned
that in India sulphur deficiency found in about 40% of arable land areas. Until these days, sulphur
deficiency is becoming evident and widespread; and several agricultural and farm management
practices are responsible for this status of sulphur in India. For example, higher level of intensive
cropping patterns/practices in irrigated areas and there in such systems developed a wide gap between
addition and removal of sulphur from soils. On the other hand, some crops such as pulses and oilseeds,
which require more sulphur in per unit of crop area and or produced and the acreage under these crops
have been increased greatly. Nevertheless, these pulse and oilseed growing areas are not usually as
                                                                                                        1598
Singh et al. (2019) / J. Biosci. Agric. Res. 19(01): 1597-1605 https://doi.org/10.18801/jbar.190119.194
fertilized as other crops of the area such as irrigated cereals. Moreover, the fertilizer use pattern that is
underway lacks sulphur fertilizers in most of the cases. While the role and importance of sulphur
fertilizer is gaining interest in India because it contribute in crop production, which is not only for the
pulses, oilseeds, legumes and forages but also for many other cereals that are producing in the country
(Singh et al. 2000). To be more precise, only adequate sulphur in arable lands can ensure the full
potential of crops in terms of yield, grain quality or associated protein content; and also facilitate the
efficient use of applied nitrogen in arable lands (Sahota, 2006). In the arable lands of India, use of
nitrogenous fertilizer is somewhat higher in many areas; this continuous use of nitrogen fertilizer
without supplemental sulphur on low sulphur soils responsible for yield quality such as can reduce flour
quality of wheat(Ruiter and Martin, 2001; Flaete et al., 2005). More specifically, sulphur does not affect
only nitrogen utilisation and grain quality of crops, but it also play significant role in the formation of
protein and the baking quality of winter wheat (Ryant and Hřivna, 2004). Therefore, this study was
undertaken to evaluate soil fertility with special prevalence to soil sulphur in Myorpur block, District
Sonbhadra, Uttar Pradesh, India.
II. Materials and Methods
Experimental site characteristics: The largest district of Uttar Pradesh is Sonbhadra. It has
geographical land area 6788 square kilometer. Sonbhadra average height from sea level is 285 feet. This
district average rainfall 1036.6, temperatures in summer 10-450C and temperature in winter 8-25 0C.
Renukut is located at 24°12' of Northern latitude and 83°02' Eastern latitude. It has an average elevation
of 283 meters (931 feet). Summers peak in May and June. Renukut has the largest integrated Aluminum
plant in Asia. Monsoon generally sets in the First week of June and last up to last week of September.
90-95 percent rainfall is received during June to September. The temperature begins to rise from the
first week February and reaches it maximum by the middle of May or end of June. The location maps of
the study area were shown in Figure 01.
Soil sampling and processing: Surface soil samples (0-15cm) of arable lands from the thirty different
locations were collected using probe anger following grid-based method. The sampling points in each
village of study area were selected on the basis of flat terrain agricultural land and far from major roads
of the area. The locations from where soil samples were collected, recorded by a global positioning
system (GPS). The sampling sites fall within 10 km circle of the Aluminium plant. The collected soil
samples were air - dried at room temperature, ground, sieved using a 2 mm mesh sieve and then bagged
using polyethylene bag in readiness for laboratory soil analysis.
Laboratory analysis: pH and electrical conductivity (EC) was measured following the methods
described by Piper (1967) and Jackson (1973) respectively. Organic matter (OM) and Organic carbon
was determined by following the method, chromic acid rapid titration, described by Walkley and Black
(1934). Organic carbon content was estimated by using the following formulae:
Organic carbon (%) = (X-Y) X0.003/100/2
Where, X = Blank reading and Y = Titrated value
Available sulphur in studied soil was determined by the CaCl 2.H2O (0.15% Solution) by turbid metric
method described by Williams and Steinbergs (1969).
III. Results and Discussion
Descriptions of results obtained after soil analysis (pH, EC, OM and available sulphur) are presented in
Table 02. While limits for the soil test values used for rating the studied soil analysis results are shown
in Table 1. However, soil pH is an important chemical parameter as it helps in ensuring availability of
plant essential nutrients (Deshmukh, 2012). The pH of soil was varied from 5.2 to 8.5 with a mean value
of 6.67 (Table 02). This indicates moderately acidic soil reaction (pH). The pH of soil samples was found
to be 22 % of sample showed moderately acidic, 20 % samples were slightly acidic, 50% samples were
very acidic, while 7% samples were nearly neutral and only 2% samples were slightly alkaline in nature.
1599
Published with open access at journalbinet.com
EISSN: 2312-7945, © 2019 The Authors, Research paperSoil fertility status of Sonbhadra district, Uttar Pradesh, India
The soils are acidic might be as a result of the leaching of basic cation or due to incessant uptake by
crops grown on the field (Brady and Weil, 2002).
Figure 01. Experimental site Myorpur, Uttar Pradesh, India.
Available Sulphur (Kg/ha)
35
30
25
20
15
10
5
0
1 2 3 4 5 6 7 8 9 10 11 12 13 14 15 16 17 18 19 20 21 22 23 24 25 26 27 28 29 30
Figure 02. Available sulphur content in different samples.
1600Singh et al. (2019) / J. Biosci. Agric. Res. 19(01): 1597-1605 https://doi.org/10.18801/jbar.190119.194
Table 01. Limits for the soil test values used for rating the studied soil analysis results.
Classification for pH values
Strongly acid Moderately Slightly acid Neutral Slightly alkaline
5.5 5.5-6.5 6.5-7.5 7.5-8.5 >8.5
Classification for Total Soluble Salt Content (EC as dS m-1)
0.3
Parameters Very Low Low Medium High
Organic carbon (%) 0.25 0.25-0.50 0.50-0.75 >0.75
Available S kg ha-1 Deficient Sufficient High level
35
Available S mg kg -1 Very Low Low Medium High Very High
50
Table 02. Composition of Soils of Myorpur, Sonbhadra district, India
Locations Sampling pH EC Organic Available S Sulphur
location GPS (d Sm-1) Matter (kg ha-1) rating
reading (g kg-1)
Patritola N240 07.156 ' 7.1 1.190 1.40
26.6 Medium
E 830 0.941'
Myorpur N240 07.729 ' 7.2 0.752 2.40
29.0 Medium
E 830 0 .031'
Rajpahari N240 09.271 ' 6.9 0.328 1.80
15.5 Low
E 8303.520'
Labhari N240 12.491' 7.4 0.452 3.96
33.3 Medium
E 8356.966'
Balliary N240 07.080' 5.9 0.521 2.06
23.2 Medium
E 830 04.241'
Balliary N240 07.404' 7.1 0.325 1.94
33.0 Medium
E 83003625'
Patritola N240 07.094 ' 5.4 0.840 2.52
15.4 Low
E 83002.799'
Balliary N240 07.524' 5.7 0.230 1.51
33.1 Medium
E 83003.423'
Myorpur N240 06.923' 6.4 0.880 1.70
21.2 Low
E 83009.555'
Patritola N240 07.118 ' 5.9 0.156 3.0
11.6 Low
E 83002.741'
Navatola N240 06.690 ' 7.3 0.370 2.41
20.3 Low
E 83004.839'
Navatola N240 06.934 ' 5.2 0.440 5.90
19.2 Low
E 83004.996'
Navatola N240 06.729' 7.0 0.136 2.13
23.7 Medium
E 83004.857'
Balliary N240 07.265 ' 8.5 0.284 2.08
22.1 Low
E 83003.849'
Rajpahari N240 08.523' 5.2 0.140 2.28
21.9 Low
E 83004.437'
Kharpatthar N240 14.247' 7.2 0.786 2.28
31.8 Medium
E 830 04.249'
Makara N24012.787 ' 8.3 1.430 5.86
14.5 Low
E 83057.719'
Sidhwa N240 12.796 ' 6.5 0.156 4.03
15.0 Low
E 83045.292'
1601
Published with open access at journalbinet.com
EISSN: 2312-7945, © 2019 The Authors, Research paperSoil fertility status of Sonbhadra district, Uttar Pradesh, India
Sidhwa N240 12.803' 5.7 0.147 3.17
23.9 Medium
E 83056.390'
Bairpan N240 12.817 ' 7.0 0.760 3.48
18.1 Low
E 83053.586'
Hathwnia N240 16.056 ' 6.3 0.220 2.55
17.0 Low
E 83005.785'
Hathwnia N240 06.679 ' 7.1 0.744 2.26
12.7 Low
E 83005 849'
Shaudhi N240 16.257' 6.1 0.282 6.06
17.6 Low
E 83005.932'
Shaudhi N240 16.049 ' 6.8 0.523 3.06
29.4 Medium
E 83005.795'
Dhaulinala N240 14.498' 6.4 0.402 3.86
27.9 Medium
E 83004.486'
Dhaulinala N240 18.909' 6.3 0.361 4.93
12.7 Low
E 83006.813'
Dhaulinala N240 13.418 ' 6.1 0.245 3.89
23.1 Medium
E 83004.347'
Dhaulinala N240 13.022 ' 7.4 0.390 4.44
13.5 Low
E 83004.588'
Hathnia N240 15.086 ' 6.9 0.354 3.97
18.6 Low
E 83004.849'
Hathnia N240 19.196 ' 7.3 0.435 3.30
14.8 Low
E 83009.101'
Range 5.2-8.5 0.125-1.19 1.40-5.9 11.60-33.30
Mean 6.67 8.19 3.0 21.39
S.D. ± 0.84 41.9 2.80 21.32
C.V. 12.73 19.41 63.98 6.7
Organic carbon
The organic matter content varied from 1.40 to 5.90 g/kg with a mean of 3.0 g/kg. The lower contents
of organic carbon might be resulted because of high temperature, which induced rapid rate of organic
matter oxidation and decomposition. While the declining trend towards to accumulation of crop
residues every year is also a reason for decline in organic matter.
Available sulphur
The available sulphur varied from 11.60 to 33.30 kgha-1 with a mean value of 21.39 kgha-1. Out of 30 soil
samples of the district, 18 soil samples were found under low and rest 12 soil samples were found under
medium categories for available sulphur. Available sulphur was low in status (Figure 02 and Table 02).
The high acidity and low content of organic matter in the soil as well as continuous removal of sulphur
by the crops due to intense cultivation without adding sulphur element might be the cause of low
amounts of sulphur. Soils of study area would highly need sulphur management.
Nutrients index (NI) for sulphur
The NI of sulphur level into low, medium and high was calculated following Muhr et al. (1965) by using
the following formulae:
Nutrient index (N. I.) = (NL×1+NM×2+NH×3)/NT
Where, NL = number of samples falling in low, NM = number of samples falling in medium and NH =
number of samples falling in high. NT is total number of samples analyzed for a given area. During the
percentage assessment, a NI less than 1.67 denotes low category and that falling between 1.67 and 2.33
represents the medium fertility class. Value of 2.33 and above (maxi 3.00) signifies a high fertility class
in respect of the particular nutrient (Ghosh and Hasan, 1976).The rating of soil test value for the three
levels was done following Ramamooarhy and Bajaj (1969). NI value of Myorpur, district Shonbhadra
were found below 1.67 indicating low sulphur fertility status of soils.
1602Singh et al. (2019) / J. Biosci. Agric. Res. 19(01): 1597-1605 https://doi.org/10.18801/jbar.190119.194
IV. Conclusion
Lack of knowledge and importance about sulphur among farmers, exhaustive and high yielding cultivars
of crops and avoiding usage of farmyard manures seems to have terminated to a wide occurrence of
sulphur deficiency. It is obvious that the soil available sulphur varied with variation in soil properties of
different locations of Myorpur block. It was observed that the soils of Shonbhadra district have low
status of available sulphur indicating the need to supply sulphur fertilizer to meet sulphur requirement
of crops. Soils would highly need sulphur management through addition of inorganic S, organic manures
or sulphonated compost and biocomposts or gypsum, sulphur - solubilizing microbes.
References
[1]. Ahmed, M. M., Moula, M. S., Moslehuddin, A. Z. M. and Siddique, M. N. A. (2014). Performance of
rock phosphate and triple super phosphate on nutrient dynamics and yield of rice (BRRI
Dhan39) in transplanted aman season in a Piedmont soil of Bangladesh. Journal of Bioscience
and Agriculture Research, 01(01), 17-25. https://doi.org/10.18801/jbar.010114.03
[2]. Brady, N. C. and Weil, R. R. (2002). The nature and properties of soils. 13th edition. Pearson
Education, New Jersey.
[3]. Deshmukh, K. K. (2012). Studies on chemical characteristics and classification of soils from
Sangamner area, Ahmadnagar District, Maharastra. Rasayan Journal of Chemistry, 5(1), 74-85.
[4]. Flaete, N. E. S., Hollung, K., Ruud, L., Sogn, T., Faergestad, E. M., Skarpeid, H. J., Magnus, E. M. and
Uhlen, A. K. (2005). Combined nitrogen and sulphur fertilisation and its effect on wheat quality
and protein composition measured by SE-FPLC and proteomics. Journal of Cereal Science, 41(3),
357–369. https://doi.org/10.1016/j.jcs.2005.01.003
[5]. Ghosh, A. B. and Hasan, R. (1976). Available potassium status of Indian soil. Bull. Indian Soc. of
Soil Sci. 12, 1-18.
[6]. Goovaerts, P. (1998). Geo-statistical tools for characterizing the spatial variability of
microbiological and physic chemical soil properties. Biology and Fertility of Soils, 27(4), 315–
334. https://doi.org/10.1007/s003740050439
[7]. Halim, M. A., Siddique, M. N. A., Sarker, B. C., Islam, M. J., Hossain, M. F. and Kamaruzzaman, M.
(2014). Assessment of nutrient dynamics affected by different levels of lime in a mungbean field
of the Old Himalayan Piedmont soil in Bangladesh. IOSR Journal of Agriculture and Veterinary
Science (IOSR-JAVS), 7(3), 101-112. https://doi.org/10.9790/2380-073101112
[8]. Hossain, M. A. and Siddique, M. N. A. (2015). Water-A limiting resource for sustainable
agriculture in Bangladesh. EC Agriculture, 1(2), 124-137.
[9]. Jackson, M. N. (1973). Soil chemical analysis. Prentice Hall of India Pvt. Ltd., New Delhi, (India).
[10]. Kamaruzzaman, M., Islam, M. N., Siddique, M. N. A., Sarker, B. C., Islam, M. J. and Rasel, S. M.
(2014). Liming effect on changes of soil properties of wheat field: a case of Barind area in
Bangladesh. Online Journal of Biosciences and Informatics, 1(1), 11-30.
[11]. Khan, M. A. S., Waliullah, M., Hossain, M., Mandal, B. H., Habiba, U. and Siddique, M. N. A. (2016).
Safe water access, motivation and community participation at arsenic affected rural areas of
Jessore, Bangladesh: insights and realism. Journal of Science, Technology and Environment
Informatics, 04(01), 260-269. https://doi.org/10.18801/jstei.040116.29
[12]. Muhr, G. R., Datta, N. P., sankarasubramoney, H., Leley, V. K. and Donahue, R. L. (1965). Soil
testing in India. 2nd Ed. USAID Mission to India, New Delhi.
[13]. Nduwumuremyi, A. (2013). Soil acidification and lime quality: sources of soil acidity, effects on
plant nutrients, efficiency of lime and liming requirements. Research & Reviews: Journal of
Agriculture and Allied Sciences, 2(4), 26–34.
[14]. Piper, C. S. (1967). Soil and Plant Analysis. Hans Publisher, Bombay. pp. 85-102.
[15]. Ramamoorthy, B. and Bajaj, J. C. (1969). Available nitrogen, phosphorus and potassium status of
Indian soils. Fert. News, 14, 25-28.
[16]. Ruiter, J. M. de and Martin, R. J. (2001). Management of nitrogen and sulphur fertilizer for
improvement bread wheat (Triticum aestivum) quality. New Zealand Journal of Crop and
Horticultural Science, 29, 287–299. https://doi.org/10.1080/01140671.2001.9514190
1603
Published with open access at journalbinet.com
EISSN: 2312-7945, © 2019 The Authors, Research paperSoil fertility status of Sonbhadra district, Uttar Pradesh, India
[17]. Ryant, P. and Hřivna, L. (2004). The effect of sulphur fertilization on yield and technological
parameters of wheat grain. Annel Universitatis Mariae Curie – Sklodowska, Sec. E. 59(4), 1669-
1678.
[18]. Sahota, T. S. (2006). Importance of Sulphur in crop production, Ontario Farmer, Dec. 13, 2005,
38(42), Page B25 and Northwest Link, September, 2006. pp. 10-12.
[19]. Sen, P., Majumdar, K. and Sulewski, G. (2008). Importance of spatial nutrient variability mapping
to facilitate SSNM in small land holding systems. Indian J. Fert. 4 (11), 43-50.
[20]. Siddique, M. N. A. (2015). Determination of N mineralization, total N and cation exchange
capacity of soil through NIR spectroscopy for decision support in rice farming. International
Journal of Business, Management and Social Research, 01(01), 47-50.
https://doi.org/10.18801/ijbmsr.010115.05
[21]. Siddique, M. N. A., Halim, M. A., Kamaruzzaman, M., Karim, D. and Sultana, J. (2014). Comparative
insights for investigation of soil fertility degradation in a Piedmont area which cover the
Anjamkhor union of Baliadangi Upazila, Thakurgoan, Bangladesh. Journal of Environmental
Science, Toxicology and Food Technology, 8(4), 82-87.
https://doi.org/10.9790/2402-08428287
[22]. Siddique, M. N. A., Islam, M. M., Halim, M. A., Kamaruzzaman, M., Sultana, J., Karim, D. and Islam,
M. N. (2014a). Mapping of site-specific soil spatial variability by geostatistical technique for
textural fractions in a terrace soil of Bangladesh. Journal of Bioscience and Agriculture Research,
1(1), 08-16. https://doi.org/10.18801/jbar.010114.02
[23]. Siddique, M. N. A., Islam, M. M., Sultana, J., Kamaruzzaman, M. and Halim, M. A., (2014a). Potential
of soil sensor EM38 measurements for soil fertility mapping in the Terrace soil of Bangladesh.
Journal of Science, Technology and Environment Informatics, 01(01), 01-15.
[24]. Siddique, M. N. A., Sultana, J. and Abdullah, M. R. (2017). Aggregate stability: an indicator of
quality and resistivity of arable Soil. Asian Journal of Soil Science and Plant Nutrition, 1(2), 1-7.
https://doi.org/10.9734/AJSSPN/2017/34829
[25]. Siddique, M. N. A., Sultana, J., Huda, M. S., Abdullah, M. R. and Chowdury M. A. (2015a). Potato
production and management with preference to seed potato supply chain, certification and
actors involve in Bangladesh. International Journal of Business, Management and Social
Research, 01(01), 01.
[26]. Singh, S. P., Ram, J. and Singh, N. (2000). Forms of sulphur in relation to soil characteristics in
some soil series of Nagaland. J. Maharashtra Agric. Univ. 25(1), 3-8.
[27]. Sultana, J., Siddiuqe, M. N. A., Miao, K. and Abdullah, M. R. (2017). Influence of arbuscular
mycorrhizal fungi (AMF) on plant competition for growth of a legume and a grass plant species.
Journal of Bioscience and Agriculture Research, 01(02), 85-91.
https://doi.org/10.18801/jbar.010214.10
[28]. Sultana, J., Siddique, M. N. A. and Abdullah, M. R. (2015). Fertilizer recommendation for
agriculture: practice, practicalities and adaptation in Bangladesh and Netherlands. International
Journal of Business, Management and Social Research, 1(1), 21-40.
https://doi.org/10.18801/ijbmsr.010115.03
[29]. Sultana, J. and Siddique, M. N. A. (2015). Quantifying the role of arbuscular mycorrhizal
colonization and acid phosphatase activity in grass biomass production. Journal of Molecular
Studies and Medicine Research, 01(01), 01-15. https://doi.org/10.18801/jmsmr.010115.01
[30]. Sultana, J., Siddique, M. N. A., Kamaruzzaman, M. and Halim, M. A. (2014). Conventional to
Ecological: tea plantation soil management in Panchagarh district of Bangladesh. Journal of
Science, Technology and Environment Informatics, 01(01), 27-35.
[31]. Tondon, H. L. S. (1995). Sulphur fertilization for Indian agriculture-A guidebook (2), fertilizer
development and utilization, New Delhi. pp. 101-103.
[32]. Walkley, A. and Black, I. A. (1934). Estimation of soil organic carbon by chromic acid titration
method. Soil Science, 37, 29–38. https://doi.org/10.1097/00010694-193401000-00003
[33]. Welch, C. D., Nelson, R. W. and Beaton, J. D. (1987). Opportunities to improve soil testing
programme. Soil testing and Plant analysis. Revised Publication. Soil Sci. Soc. Ammer, Inc.
Washington, USA. pp. 1-10.
[34]. Williams, C. H. and Steinberg’s, A. (1969). Soil Sulphur fraction as chemical indices of available
sulphur in some Australian soil. Aust. j. Agric. Res. 10, 340-52.
https://doi.org/10.1071/AR9590340
1604Singh et al. (2019) / J. Biosci. Agric. Res. 19(01): 1597-1605 https://doi.org/10.18801/jbar.190119.194
HOW TO CITE THIS ARTICLE?
Crossref: https://doi.org/10.18801/jbar.190119.194
MLA
Singh et al. “Evaluation of soil fertility status for available sulphur in various location of Myorpur block,
district Sonbhadra, Uttar Pradesh, India.” Journal of Bioscience and Agriculture Research 19(01) (2019):
1597-1605.
APA
Singh, S. P., Verma, J. P., Singh, S. and Kumar, R. (2019). Evaluation of soil fertility status for available
sulphur in various location of Myorpur block, district Sonbhadra, Uttar Pradesh, India. Journal of
Bioscience and Agriculture Research, 19(01), 1597-1605.
Chicago
Singh, S. P., Verma, J. P., Singh, S. and Kumar, R. “Evaluation of soil fertility status for available sulphur in
various location of Myorpur block, district Sonbhadra, Uttar Pradesh, India.” Journal of Bioscience and
Agriculture Research 19(01) (2019): 1597-1605.
Harvard
Singh, S. P., Verma, J. P., Singh, S. and Kumar, R. 2019. Evaluation of soil fertility status for available
sulphur in various location of Myorpur block, district Sonbhadra, Uttar Pradesh, India. Journal of
Bioscience and Agriculture Research, 19(01), pp. 1597-1605.
Vancouver
Singh, SP, Verma, JP, Singh, S and Kumar, R. Evaluation of soil fertility status for available sulphur in
various location of Myorpur block, district Sonbhadra, Uttar Pradesh, India. Journal of Bioscience and
Agriculture Research. 2019 January 19(01): 1597-1605.
Access by Smart Phone
Journal BiNET | Scientific Publication
Faster processing & peer review
International editorial board
29 business days publication
Greater audience readership
Indexing & bibliographic integration
Social sharing enabled
Submission or email to submit@journalbinet.com
www.journalbinet.com/article-submission-form.html
1605
Published with open access at journalbinet.com
EISSN: 2312-7945, © 2019 The Authors, Research paperYou can also read