Commodity Market Monitor - April 21, 2020 - MKTYARD.COM
←
→
Page content transcription
If your browser does not render page correctly, please read the page content below
Commodity Market
                                              Monitor
                                             April 21, 2020
                                           Rice & Paddy/Chana/Cotton/Sugar

                                  Weekly Online
                              https://forms.gle/2J
                    Click ongFGowMre4fxDwSA
                                the link above to participate
Participate in our weekly quiz and get a chance to win Amazon gift coupons. Winners will
                              Quizhttps://forms.g
                       be announced in next report and rewarded.
                              le/LJdTxzEURqqTZA
                              6U9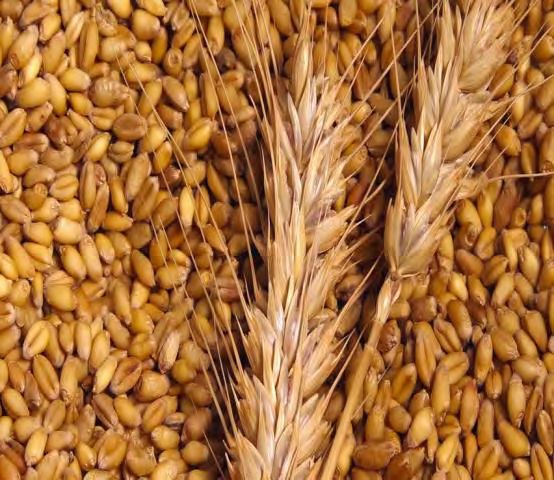
All India Weather Status
Last week all India Rainfall status: 09th April 2020 to 15th April 2020.
Arunachal Pradesh, Karnataka, Kerala, Madhya Pradesh, Maharashtra, Telangana, Uttarakhand and West
Bengal states received the deficit rainfall
Jharkhand, Odisha, Sikkim and Tamil Nadu states received the excess rainfall
Assam, Gujarat, Himachal Pradesh, Jammu & Kashmir, Manipur, Mizoram, Nagaland, Rajasthan, Tripura
and Uttar Pradesh states received the large deficit rainfall
Andhra Pradesh, Bihar and Chhattisgarh state received the large excess rainfall
Goa and Meghalaya states received the normal rainfall
No rainfall has observed in Haryana and Punjab states.
During the week, rainfall was below Long Period Average (LPA) by 41% over the country as a whole.
Seasonal all India Rainfall status: 1st March 2020 to 15th April 2020.
Meghalaya and Tamil Nadu states received the deficit rainfall
Andhra Pradesh, Gujarat, Himachal Pradesh, Karnataka and Telangana states received the excess
rainfall
Arunachal Pradesh, Assam, Goa, Manipur, Mizoram, Nagaland and Tripura states received the
large deficit rainfall
Bihar, Chhattisgarh, Haryana, Jharkhand, Madhya Pradesh, Maharashtra, Odisha, Punjab,
Rajasthan, Uttar Pradesh and Uttarakhand states received the large excess rainfall
Jammu & Kashmir, Kerala, Sikkim and West Bengal states received the normal rainfall
For the country as a whole, cumulative rainfall during 1stMarch 2020 to 15thApril 2020 was above Long Period
Average (LPA) by 16% over the country as a whole.
Weather Forecast:
Maximum temperatures in the range of 40-42°C likely to prevail over parts of Telangana, Rayalaseema and North Interior Karnataka. No
significant change in maximum temperatures over the rest of country during the same period.
Fairly widespread to widespread rain/thundershowers with isolated heavy falls likely over parts of Northeaster India and over West Bengal
& Sikkim.
Isolated to scattered rain/thundershowers are also likely over parts of East & South Peninsular India and Islands
Weather is likely to be dry over rest parts of the country.
% of Departure From Normal Reservoir Storage (16th April, 2020) All India Reservoir Status: as on 16th April 2020.
200
Central Water Commission is monitoring live storage status of 123 reservoirs of
150 the country on weekly basis and is issuing weekly bulletin on every Thursday.
The total live storage capacity of these 123 reservoirs is 171.090 BCM which is
100
about 66.36% of the live storage capacity of 257.812 BCM which is estimated to
50
have been created in the country. As per reservoir storage bulletin dated
16.04.2020, live storage available in these reservoirs is 76.708 BCM, which is 45%
0 of total live storage capacity of these reservoirs. However, last year the live
storage available in these reservoirs for the corresponding period was 47.105
-50 BCM and the average of last 10 years live storage was 48.370 BCM. Thus, the
live storage available in 123 reservoirs as per 16.04.2020 Bulletin is 163% of the
-100
live storage of corresponding period of last year and 159% of storage of average
of last ten years.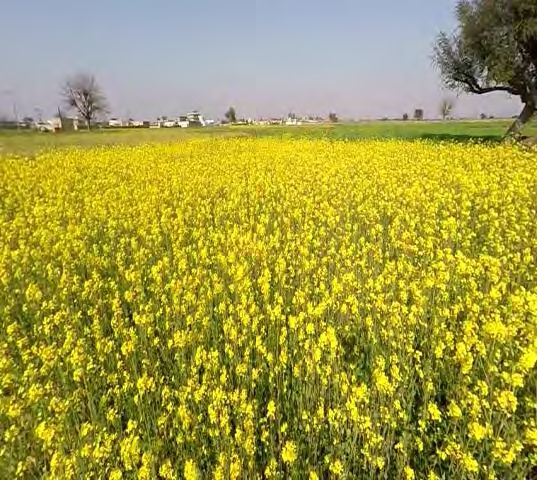
Current Crop Scenario

                                                    Lentil

   Acreage of Lentil in the current week is 16.07 lakh hectares. While, 16.91 lakh hectares areas was
   reported in corresponding week of 2019.

   Crop harvesting has completed. Favourable climatic conditions were beneficial for the crop. Overall
   crop condition is normal and yields are expected to be normal. Acreage in the current season is
   almost similar to 2018.

   Note: As telephonic discussion with farmers, No effect on crop harvesting and threshing has been
   observed due to COVID’ 19.

                                                                                                                   Mustard

                                                               Acreage of Mustard in the current week is 69.51 lakh hectares. While, 69.76 lakh hectares area was
                                                               reported in corresponding week of 2019.

                                                               Crop harvesting has completed. Crop has been adversely affected due to rainfall and hailstorms
                                                               received month of Feb`20 and Mar`20 in certain districts of Rajasthan, Haryana, Uttar Pradesh and
                                                               Madhya Pradesh where crop was is in maturity to harvesting stage or laid down on the field for
                                                               drying after harvest. Crop harvesting been delayed further due to rainfall. Overall in remaining areas
                                                               crop condition is normal and yields are expected to be normal.

                                                               Acreage of Mustard in the current season is almost similar to 2018.

                                       Wheat

Acreage of Wheat in the current week is 336.18 lakh hectares. While, 299.30 lakh hectares area was
reported in corresponding week of 2019.

Crop harvesting is under progress. Rainfall received during winter season was beneficial for the
crop. Favourable climatic conditions good harvests. However, crop has been adversely affected
due to hailstorm and rainfall with wind received during month of Mar-20 in certain districts of
Rajasthan, Haryana, Uttar Pradesh, Punjab and Himachal Pradesh, Chhattisgarh, Bihar and Madhya
Pradesh. Further, crop maturity has delayed due to prolong winter. Overall in remaining areas crop
condition is normal and yield are expected to be normal.

Acreage of Wheat in the current season is higher than 2018.

                                                                                                                Corn

                                                              Acreage of Corn in the current week is 16.98 lakh hectares. While, 14.78 lakh hectares areas was reported in
                                                              corresponding week of 2019.
                                                              Crop harvesting is under progress. Rainfall received during winter season was beneficial for the crop in entire
                                                              major growing states. Due to infestation of sucking pest stem borer, fall army worm crop has been adversely
                                                              affected in certain pockets of Andhra Pradesh, Bihar and Telangana state. Overall in reaming areas crop
                                                              condition is normal and yields are expected to be normal.
                                                              Acreage of Corn in the current week is higher than corresponding week of 2019. Key corn producing states are
                                                              Bihar, Maharashtra, Andhra Pradesh, Telangana and Karnataka.

                                             Gram

 Acreage of Gram in the current week is 107.21 lakh hectares. While, 96.19 lakh hectares area was
 reported in corresponding week of 2019.

 Crop harvesting has completed. Rainfall received during winter season was beneficial for the
 crop. Incidence of sucking pest has been observed in the field and same is under control using
 pesticides. Overall crop condition is normal and yield is expected to be normal.

 Acreage of Gram in the current season is significantly higher than 2018.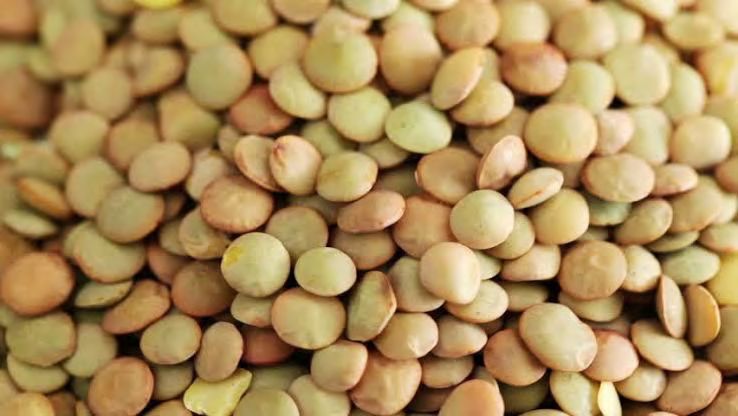
Commodity – Rice & Paddy
Fundamental Summary
Benchmark Location Davanagere
Market Outlook Bearish
Factor Impact
Lockdown in India due to coronavirus (COVID-19) Bearish
Higher Rice stocks availability with Government Bearish
agencies
Market driving factors
Kharif sowing higher as compared to last year Bearish
Lower Rice exports Bearish
Higher Minimum Support Price of Paddy 2019-20 Bullish
season
Fundamental Analysis and Insights
Rice export operations has resumed despite India extending the lockdown until at least
till 03rd May 2020. The demand for Indian rice is huge as it has been offered at steep
discount to rice from other countries but it would take time for exports to return to
normal levels. New contracts are getting signed but at a very low pace due to bottlenecks
in the supply chain. Traders are mainly signing contracts for May and June shipments,
expecting New Delhi to ease restrictions after 03rd May 2020.
As per market sources, about 400,000 tonnes of non-basmati rice and 100,000 tonnes of
basmati rice, meant for March-April delivery, are either stuck at ports or in the pipeline
due to the lockdown.
Basmati exports have surged to most traditional overseas markets in the last quarter as
consumers have gone for additional stocks due to Covid-19. The rise in demand from
Middle East is also buttressed by higher buying for Ramadan.
All-India progressive procurement of Rice as on 06th March 2020 increased at 378.41 lakh
tonnes as compared to 362.28 lakh tonnes in the corresponding period last year. The
procurement target set for 2019-20 (October-September) is 416.00 lakh tonnes. Higher
Rice procurement is done from Punjab (108.76 lakh tonnes), Haryana (43.03 lakh tonnes),
UttaraKhand (6.81 lakh tonnes), Uttar Pradesh (37.17 lakh tonnes), Odisha (32.86 lakh
tonnes), Maharashtra (5.73 lakh tonnes), Madhya Pradesh (15.35 lakh tonnes), Tamil Nadu
(9.61 lakh tonnes) and Kerala (1.56 lakh tonnes).
As on 01st February 2020, the government had 30.4 million tonnes of wheat in its stocks,
27 per cent higher on year. Rice inventory with the government was at 27.4 million tonnes
up 20 per cent on year.
MSP of Paddy (common grade) is Rs. 1815 per quintal for 2019-20 as against Rs. 1750 per
quintal in 2018-19. The grade A variety of Paddy increased to Rs. 1835 per quintal from Rs.
1770 per quintal in 2018-19.
As per APEDA, Basmati Rice exports April-January 2019-20 declined at 32,99,299 tonnes as
compared to 33,65,146 tonnes in April-January 2018-19. Similarly, export of Non-Basmati
Rice April-January 2019-20 also declined to 40,15,477 tonnes as compared to 62,65,512
tonnes during April-January 2018-19.
During January 2020, more than 9.09 lakh tonnes of rice were exported from the country,
including 4,56,586 tonnes of basmati rice and 4,52,544 tonnes of normal or non-basmati
rice Shipment included.
According to IGC, the global rice production in 2020-21 was seen rising to 509 million
tonnes, up from the prior season’s 499 million tonnes.
India was offering the 5 per cent broken parboiled variety at around $375-$380 per tonne
on a free-on-board basis. Thailand was offering the same grade at around $535 per tonne.
Summing up, Rice prices in the country are likely to remain range with bearish tone as higher
stocks availability and lower exports would check any significant on upward prices movements.
Moreover, subdued trading activities in most of the spot markets due to lockdown have kept the
sentiments weak.
Technical Analysis
Paddy prices at Davanagere traded on a flat note and closed at INR 1920.
Prices, staying below the medium term trend line shall continue to remain on a subdued
note.
The weekly RSI (14) setup is
hovering near the midpoint,
suggesting prices to stay on a
mixed to weak note.
Any weakness in the prices shall
find support near the previous
swing bottom near INR 1850 –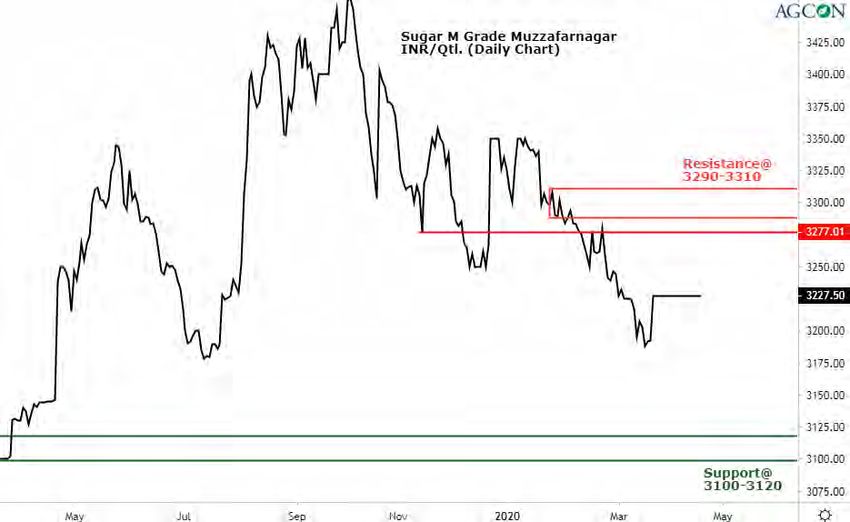
INR 1800 before turning north again towards INR 2050.

Prices are likely to stay on a mixed to weak note and trade towards INR 1850 – 1800, before
turning north, in the coming 2-3 weeks.

                                 Basmati 1121 Price
   Location                 20-04-2020                  13-04-2020               % Change
    Delhi                      3000                        3000                      0
    Karnal                     2900                        2900                      0
   Amritsar                    2900                        2850                     1.8

                                Non-Basmati Common Price
   Location                 20-04-2020                  13-04-2020               % Change
 Davanagere                    1920                        1883                     1.96
    Rewa                       1840                        1840                      0
    Raipur                     1400                        1410                     -0.7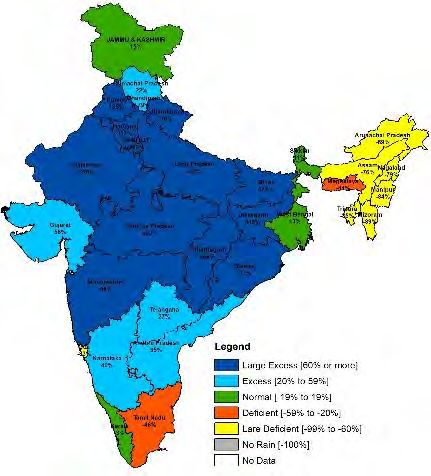
Commodity – Chana
Fundamental Summary
Benchmark Location Delhi
Market Outlook Bearish
Factor Impact
Commence of procurement activities Bullish
Expected higher availability after leniency in
Market driving factors Bearish
lockdown
Clearing of old stock by NAFED Bearish
Lower demand of besan from Snack Industry Bearish
Fundamental Analysis and Insights
Indian chana prices traded range bound to slightly firm last week amidst expectation of
extension in lockdown period in many states, tight supplies in the market, selling of old crop
by NAFED and lower availability of imports.
Government of India has extended the lockdown period till 3rd May 2020 but permitted
milling, procurement, marketing, farming etc of agriculture commodities in districts where
threat of spread of coronavirus is negligible. In such scenario the availability of chana may
increase in the domestic market thus keeping the underlying momentum weak.
Commencement of procurement activities of chana at MSP Rs 4875/qtl. in the major
producing regions may give support to the domestic prices. This year Indian government has
set chana procurement target at 20 lakh MT which is around 18 percent of the total
production. State wise procurement target are Madhya Pradesh 8.76 lakh MT, Telangana
0.476 lakh MT, Andhra Pradesh 0.604 lakh MT, Karnataka 1.43 lakh MT, Uttar Pradesh 2.01 lakh
MT, Rajasthan 6.15 lakh MT and Gujarat 0.57 lakh MT.
Despite having empty pipeline, stockiest are not active in the market as they expect safety
precautions taken in the procurement activity might slow the process and farmers may sell
their produce at lower prices in the market. Further, arrivals are expected to be higher in the
coming days which may pressurize the market.
At the demand front, chana dal demand is now stagnant as government has announced ration
holders to get 1 kg of pulses for the next three months. Further, demand of besan from the
snack industry is also subdued as the lockdown has extended and no major exemption is given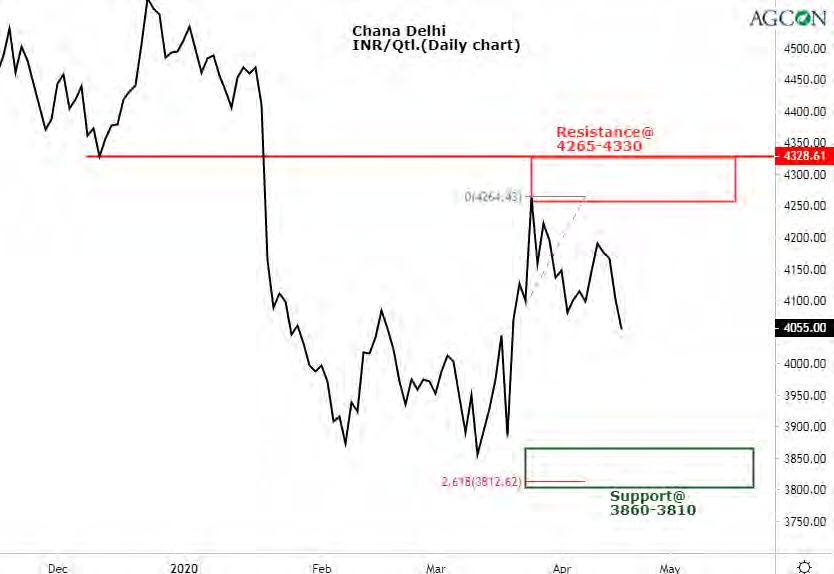
to them.
NAFED continues to sell good amount of chana in the open market to carter the present
demand and to clear old stock of chana to make space for the new procurement season which
may put downward pressure to the prices.
According to the second advance production estimate, chana production in 2019-20 is
estimated at 11.22 million MT which 12.87 percent higher than 2018-19 production estimate of
9.94 million MT. However, market participants are expecting production in the range of 10.3-
10.7 million MT.
Summing up, in the coming week chana prices are expected to show weak movement amidst
expectation of higher arrivals and sluggish demand. However, procurement activity may
continue to give support to the prices.
Price Outlook
Price Direction Bearish
Chana, Delhi ( INR/Ton) INR 38600-41000
Price Range
Technical Analysis
Chana Delhi prices settled at INR 4055 levels lower by INR 50 than the preceding week.
Prices have pulled back aggressively from INR 3820 levels during past months, within
overall sellers’
territory from
higher timeframes.
Broader trend is
considered bearish
as sequence of
lower lows and
lower highs is intact
on daily chart. The
momentum of
pullback is also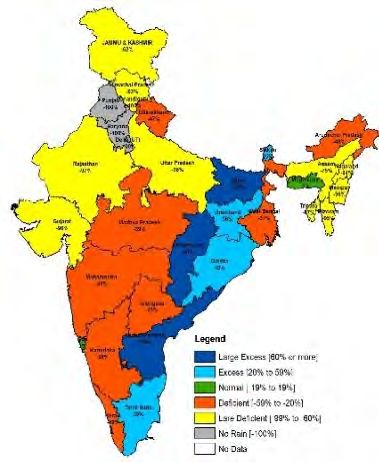
slowing down during recent weeks indicating resumption of bearish trend.
On the higher side, INR 4325-4265 levels (sellers breach area and recent swing high
respectively) likely to act as ceiling for prices.
On the lower side, INR 3976 levels likely to act as interim support while INR 3860-3810 levels likely
to act at immediate price objective.
Location 20-04-2020 13-04-2020 % Change
Mumbai 4200 3875 8.4
Indore 4100 3750 9.3
Rajkot 4000 3750 6.7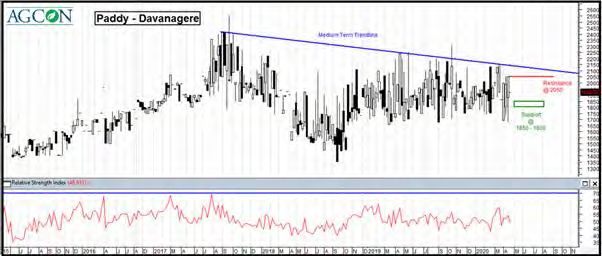
Commodity - Cotton
Fundamental Summary
Benchmark Location Kadi
Market Outlook Bearish
Factor Impact
Higher India production estimate YOY and Higher Bearish
arrivals YOY
Higher global production outlook YOY Bearish
Lower demand due to impact of Coronavirus on Bearish
Market driving factors
global economy
Year over year higher procurement by CCI Neutral
Lower export - Coronavirus lock down Bearish
Higher India production estimate YOY and Higher Bearish
arrivals YOY
Fundamental Analysis and Insights
Majority of cotton markets remained closed over the week, due to country wide
lockdown which is extended till 3rd May to check Coronavirus spread and the cotton
procurement also remain halted. Except one district in Punjab ‘Mansa’ where the
procurement operation was started last week by CCI with restricted farmers inflow by
providing them daily coupons.
CCI will start cotton procurement in Maharashtra in 3 mandis 21st April onwards and will
start in Telangana also. As per CCI 84.5 lakh bales have been procured by agency and
farmers are still left with 25% of unginned raw kapas with them.
Basis CAI spot prices Rajkot (Gujarat) 29 mm cotton traded between Rs 17639 to RS
17734/bale and Andhra Pradesh 29 mm cotton traded between Rs 17784 to Rs 17879/bale
during last week sideways on week over week basis.
MCX April futures traded steady in range at Rs 16490/bale vs Rs 16660/bale last week.
Internationally Cotlook ‘A’ index traded in technical consolidation at 62.95 USc/lb vs last
week 63.45 USc/lb last week, US Cotton May contracts future closed lower at 52.77 USc/lb
vs 54.37 USc/lb last week.
International price of cotton followed economic indicators i.e. strengthening of US equitymarket along with USD and crude price volatility. USDA in its April forecast reduced the cotton consumption forecast due to COvid-19 impact by 6.4% over March update amounting to 7.6 million US bales, which is higher than the market expectation of around 5 million bales. The closing stocks have been increased by 8% over last update. Overall the world cotton balance sheet has become more bearish. As per industry sources some yarn import enquiries have started coming from China, Vietnam and Taiwan although prices are down by 10-12% over last month. As per commerce ministry India cotton yarn/fabric export growth declined in 2019-20 by 10.67% due to world-wide lockdowns because of Covid-19 leading to cancellation of orders. Overall export dropped by 6% and March saw the biggest drop of 32% YOY basis. It is expected that April may saw bigger drop because of Covid-19 lockdown in India as well as other countries and recovery in export demand may depend upon opening up of lockdowns. India started with opening stocks of 44 lakh bales in Oct 2019 with estimated production of 360 lakh bales and estimated import of 25 lakh bales total availability reaches 429 lakh bales. Earlier India was expected to export higher than last year at 45 to 50 lakh bales vs 44 lakh last year, because of lower production estimate in Pakistan and export expectation to China, Bangladesh and Vietnam. But now Coronavirus outbreak has led to suspension of exports for the time being and India may end up with lower exports by up to 5-10 lakh bales. Hence India may end up with higher carry forward stocks and major portion would be with CCI. We expect the prices to trade sideways as the domestic prices were supported only because of CCI buying, and now it is expected that some mandis for cotton procurement may open and farmers may be able to sell remaining stock to CCI at MSP.
Technical Analysis
Cotton Kadi Spot prices after breaching INR 19840 levels are considered within sellers’
territory on the daily chart. Prices have stayed below the breach mostly since last year
portraying bearish sentiments.
Earlier this year, prices pulled back to
INR 19600 levels within the downtrend
and found renewed selling interest
resulting in resumption of lower highs
and lower lows sequence with strong
momentum indicative of sellers
strength.
On the higher side, prices are expected
to find stiff resistance around INR
18800-19000 levels on the daily chart on
any further test.
On the lower side, INR 16900-17100 levels (161.8% Fibonacci based extension levels – initial
major swing down from INR 23000-19840 projected from the second major swing high-
INR 22260 ) likely to act as next price objective.
Concisely, prices are likely to drift lower towards INR 17200 levels and lower with resistance in
place around INR 18500-18800 levels bearing negative bias in forthcoming weeks.
Location 20-04-2020 13-04-2020 % Change
Rajkot(29mm) 36000 36500 -1.4
Indore(24mm) 33000 33500 -1.5
Amritsar(22mm) 36200 36600 -1.1Commodity – Sugar
Fundamental Summary
Benchmark Location Muzaffarnagar
Market Outlook Bearish
Factor Impact
Coronavirus lock down, impacting bulk demand Bearish
Lower volume back to back trades for retail sale Neutral
Lower sugar production YOY Neutral
Market driving factors
Domestic sale quota of 18 lakh mt for Apr 2020 Bearish
Sugar Production higher than Consumption Bearish
Lower than expected exports - Higher opening Bearish
stocks for 2020-21
Fundamental Analysis and Insights
The period for lockdown to check Covid-19 increased to 3rd May during last week. The
offtake was already hit due to absence of bulk buyers, but demand for retail also reduced
as retail buyers had already stocked up due to initial panic buying and now that volume
also reduced. So offtake is just happening basis immediate requirement and
transportation availability.
M grade sugar in Muzaffarnagar and Kolhapur traded in range of Rs 3230 to Rs 3200/qt,
and S grade sugar in Kolhapur traded at Rs 3100/qt during the week, unchanged over the
week.
Delhi price traded in range of Rs 3276 – Rs 3220/qt white Kolkata sugar prices traded at Rs
3342/qt. The prices remain closed weak on weekly basis.
India produced 248 lakh Mt sugar vs 319 lakh mt last year as on 15th April. 139 mills are
working compared to 172 last year. Majority of mills are working in Uttar Pradesh,
Uttaranchal and Haryana and crushing is almost finished in rest of the states. The
crushing is going as per expectation and overall production may reach as expected 265 to
270 lakh Mt.
International raw sugar price remain volatile last week and touched low of Usc 10.05/lb
before pulling back and closing at at USc 10.37/lb vs USc 10.43/lb last week. Raw sugar
price is following macro factors i.e. decline of crude oil which hit 20-year historical low
last week and weakening of Brazilian real. Over that the fundamental factor i.e. expectedhigher production of sugar in Brazil is also pressurizing prices.
Last week saw the white sugar May contract expiry and strength of contract showed
trade flow tightness and scarce availability of deliverable sugar as has already been
reported in earlier reports. About 1.96 lakh mt were delivered form India out of 2.42 lakh
mt total delivery. Aug contract closed at USD 340/Mt vs USD 331.3/Mt.
Indian raw sugar is out of parity, but white sugar is still in parity.
India exported around 30 lakh Mt, but rest of the export is currently delayed or
suspended due to lockdowns and non-availability of labour at ports and 14 days
quarantine period for ships.
On Supply and demand side, India is expected to produce 265-270 lakh Mt in 2019-20 with
record opening stock of 146 lakh Mt lead to record total availability of 411 lakh Mt.
It was estimated that out of target of 60 lakh Mt, India may export 45 to 50 lakh Mt, but
now due to Coronavirus lockdown it may be lower by 5 lakh Mt so now only 40 to 45 lakh
Mt exports is expected.
While on domestic consumption there can be impact of 5 lakh to 10 lakh Mt as due to lock
down bulk buying has gone down as social gathering, restaurants and marriages are
restricted in lot of states. The government may have to extend April domestic sales quota
also.
Overall India carry forward stock will increase and is expected to close 2019-20 with a big
closing stock of 115 to 120 lakh Mt.
Due to lockdown demand has taken a hit and offtake has significantly reduced from mills,
so we expect on short term basis the prices will remain range bound for next 2-3 weeks
due to retail demand with low volume trade. S grade sugar may trade at Rs 3100 to Rs
3150/qt and M grade between Rs 3180 Rs 3250/qt. But on long term basis the
fundamentals are bearish.
Forecast
Price Range Steady to bearish
M Muzaffarnagar 31500 – 32200Technical Analysis
Sugar M prices settled at INR 3227.5 levels mostly unchanged during preceding weeks.
Prices are considered to be in sellers territory on the daily chart since Feb.2020 after the
breach of INR 3280 levels and recently a pullback seems active after a swing low around
INR 3180 levels.
Broader trend is considered bearish as sequence of lower lows and lower highs is intact
on daily chart, after
prices transitioned
from an uptrend to a
downtrend during
Aug-Oct.2019 within
INR 3370-3450 range.
On the higher side,
INR 3290-3310 levels
(supply zone which
caused sharp
imbalance before the breach) likely to act as ceiling for prices going forward.
On the lower side, INR 3120-3100 levels likely to next price objective for the market
considering the down trend.
Concisely, prices are likely to consolidate in the range of INR 3200-3250 ahead of drifting
lower towards INR 3150 levels bearing negative bias in forthcoming weeks.
Location 20-04-2020 13-04-2020 % Change
Kolhapur 3125 3200 -2.3
Raichur 3150 3200 -1.6
Muzaffarnagar 3220 3275 -1.7The Week That Was! PRICE TRACKER
Rice exporters in India seek European
pesticides norms Fortnight Month
Commodity Latest Year ago
Government tweaks guidelines to ago ago
ensure sugar exports meet the target 20-March 20 -April-
India to harvest record wheat 20-April-20 06 April 20
20 19
production of 106.21 MT in 2019-20:
Report
Wheat 1850 1875 1875 1950
Chana 4055 4105 3946 4510
Govt pegs 7 per cent rise in onion
output this yr; sees production fall in Rice/Paddy 2900 2900 2600 2600
major fruits Sugar 32200 32275 32029 31467
NCML releases first estimate of rabi Maize 1800 1800 1807 1856
crop, indicates record food grain
production
MINIMUM SUPPORT PRICE (Rs/Qtl.)
States asked to set up PSFs to combat
price volatility Commodity 2018-19 2019-20
KHARIF **NEW**
To purchase the India Paddy Common 1750 1815
Commodity Year Book 2020, paddy grade A 1770 1835
contact us at Jowar Hybrid 2430 2550
research@ncml.com Jowar Maldandi 2450 2570
Bajra 1950 2000
Ragi 2897 3150
Maize 1700 1760
Tur/Arhar 5675 5800
Moong 6975 7050
Urad 5600 5700
Groundnut 4890 5090
Sunflower seed 5388 5650
Soybean Yellow 3399 3710
Sesame 6249 6485
Niger seed 5877 5940
Cotton (Medium Staple) 5150 5255
Cotton (Long Staple) 5450 5550
RABI**NEW**
Commodity 2018-19 2019-20
Wheat 1840 1925
Barley 1440 1525
Gram 4620 4875
Masoor (Lentil) 4475 4800
Rapeseed/Mustard 4200 4425
Link for commodity-wise and market- Safflower 4945 5215
wise prices and arrivals: *includes bonus of Rs 200 per quintal
# includes bonus of Rs 100 per quintal
http://agmarknet.gov.in/PriceAndArrival Official Production Estimates
s/CommodityWiseDailyReport2.aspx Second Advance Estimates 2019-20 & previous
years’ estimates: Fourth advance estimates 2018-19Crop & PHMF Division
Progress area coverage under Rabi crops as on 31.01.2020
Area : In lakh
hectare
Sl.no Crop Normal Rabi Area Normal of Area sown Difference of 2019-20
(DES) corresponding over
week
2019- 2018- Normal of 2018-
20 19 corresponding 19
week
1 Wheat 305.58 303.69 336.18 299.6 32.49 36.88
2 Rice 42.76 22.7 28.8 25.31 6.1 3.49
3 Pulses 146 151.1 161.17 151.78 10.06 9.39
a Gram 93.53 95.38 107 96.19 11.83 11.02
b Lentil 14.19 16.09 16.07 16.91 -0.02 -0.84
c Field pea 9.45 10.33 9.64 10.46 -0.69 -0.81
d Kulthi 2.04 4.59 5.15 5.43 0.57 -0.28
e Urad bean 8.61 8.4 7.63 7.53 -0.77 0.1
f Moong bean 10.1 6.51 6.19 6.1 -0.31 0.09
g Lathyrus 4.13 3.7 3.31 3.09 -0.4 0.02
h Other pulses 3.94 6.1 5.96 6.07 -0.14 -0.11
4 Coarse Cereals 60.78 55.06 55.69 47.77 0.63 7.92
a Jowar 35.75 31.64 30.22 25.03 -1.42 5.19
b Bajra 0.31 0.21 0.2 0.13 -0.1 0.07
c Ragi 0.46 0.55 0.47 0.62 -0.08 -0.16
d Maize 17.49 15.22 16.98 14.78 1.76 2.2
e Barley 6.77 7.44 7.82 7.2 0.38 0.62
5 Oilseed 78.85 81.36 80.29 80.36 -1.07 -0.07
a Rapeseed & mustard 60.48 67.73 69.51 69.76 1.78 -0.24
b Groundnuts 7.76 5.95 4.76 4.59 -1.2 0.17
c Safflower 1.41 0.85 0.63 0.43 -0.22 0.2
d Sunflower 2.96 2.14 1.04 1.13 -1.1 -0.09
e Sesamum 3.12 0.76 0.56 0.71 -0.21 -0.15
f Linseed 2.99 3.51 3.46 3.44 -0.06 0.02
g Other oilseed 0.14 0.42 0.34 0.3 -0.08 0.04
Total crops 633.98 613.91 662.13 604.52 48.21 57.61You can also read