Genotype environment interaction analysis for fruit yield in okra (Abelmoschus esculentus L.) under alkaline environments
←
→
Page content transcription
If your browser does not render page correctly, please read the page content below
Indian J. Genet., 81(1): (2021)
DOI:

Genotype environment interaction analysis for fruit yield in okra
(Abelmoschus esculentus L.) under alkaline environments

Satish Kumar Sanwal*, Anita Mann, Hari Kesh, Gurpreet Kaur, Raj Kumar and Arvind Kumar Rai

ICAR-Central Soil Salinity Research Institute, Karnal 132 001, Haryana

(Received: September 2020; Revised: January 2021; Accepted: January 2021)

Abstract                                                           The term Abelmoschus is probably derived from
Twenty four Okra genotypes were evaluated for marketable
                                                                   Arabian word “abul-l-mosk” which means “source of
fruit yield and its related traits for genotype environment        musk,” indicating musky smell of seeds (Charrler
interaction during 2015-16 and 2016-17. The genotypes were         1984). Maximum cultivation (99%) of okra is being
exposed to alkaline environment with a pH range of 8.0±0.2,        done in the Asian and African countries but productivity
8.5±0.2, 9.0±0.2 and 9.5±0.2. A significant level of deviation     is very poor in African countries (2.25 MT ha–1) in
in expression of different traits was observed in all the
                                                                   comparison to other okra growing regions. Global
genotypes with increasing pH. Based on Additive Main                                                     -1
Effects and Multiplicative Interaction (AMMI), Genotype and        average yield of okra is 5.26 MT ha from an area of
Genotype Environment Interaction (GGE) biplot, Wrick’s             1.83 M ha with annual productivity of 9.62 MT. 72% of
ecovalence (Wi2), AMMI Stability Value (ASV) and Yield             total world production occurs in India, ranking first with
Stability Index (YSi) stable genotypes with high fruit yield       6.3 million MT productivity in 0.5 million ha area
were identified over the eight environments. The combined
                                                                   (FAOSTAT 2018).
AMMI analysis of variance indicated that genotype main
effect, environment and genotype-by-environment
                                                                          Globally, about 1128 m ha area is affected by
interaction effects showed variation of 19.83%, 63.07% and
17.10%, respectively for fruit yield. On the basis of different    salinity and sodicity stresses (Wicke et al. 2011). In
stability measures, VRO-112, VRO-110, Kashi Kranti, VROB-          India, 6.73 million hectares fall under salt affected area
178, AE-70 and VRO-108 were differentiated as high yielding        and projected to increase to 20 million ha by 2050
and stable genotypes over the tested environments. This            (Sharma 2014). Such salt affected areas have either
study will be helpful for selecting alkali tolerant okra parents   land or crops with very low yields. Crop productivity
for further breeding programme and recommending the
suitable genotypes for alkalinity prone area.
                                                                   including vegetables is limited due to accumulation of
                                                                   salts in arid and semi-arid areas across the world (Rui
Key words:      Yield stability, AMMI, GGE, okra, yield traits     and Ricardo 2017). Salt tolerant genotypes can be the
                                                                   suitable strategy for saline or alkaline areas since it
Introduction
                                                                   will lower down the cost of soil reclamation. Among all
Okra is one of the economically important vegetable                vegetables, okra is considered a semi tolerant or
grown across the world including tropical and                      moderately tolerant crop, yet salinity stress has been
subtropical regions. Most popular terms for okra are               reported to adversely affect the growth and productivity
lady’s finger (England), gumbo (United States of                   (Unlukara et al. 2008; Sanwal et al. 2019). Fifty per
America), guino-gombo (Spanish), guibeiro                          cent reduction in fresh fruit yield of okra has been
                                                                                                      –1
(Portuguese) and bhindi (India). Earlier known as                  reported at salinity of 6.7 dS m (Minhas and Gupta
Hibiscus esculentus, presently okra is accepted as                 1993). Another study showed the reduction in okra
Abelmoschus esculentus, due to presence of                         yield by 30-40% (ECe 6 dS m–1), 10-40% at pH 9.45
distinguished characteristics of the calyx, corolla and            and 80% at pH 9.7 (Annual Report CSSRI 1997).
staminal column which are fused at the base and fall
                                                                          Yield is a complex polygenic trait with significant
together after the anthesis (Dhankhar and Mishra 2004).

*Corresponding author’s e-mail: sksanwal2016@gmail.com
Published by the Indian Society of Genetics & Plant Breeding, A-Block, F2, First Floor, NASC Complex, IARI P.O., Pusa Campus, New
Delhi 110 012; Online management by www.isgpb.org; indianjournals.com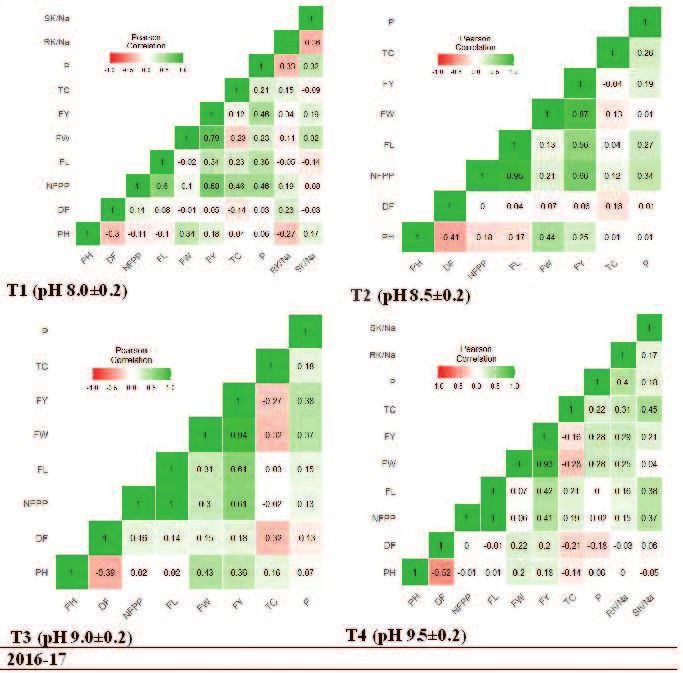
2                                             Satish Kumar Sanwal et al.                                     [Vol. 81, No. 1

variations under different environments and hence            Table 1. List of okra genotypes used in the study
performance of genotypes in single environment
cannot be considered as a criterion for selection and        S.No. Genotypes         Code Type           Origin
identification of variety (Shrestha et al. 2012). Hence,     1        VRO-5          G1    Variety       ICAR-IIVR, India
the best strategy is to evaluate the genotypes in            2        VRO-105        G2    Advance line ICAR-IIVR, India
multiple environments for stable yield and average
                                                             3        Arka Abhay     G3    Variety       ICAR-IIHR, India
performance (Islam et al. 2015). One major effect for
evaluating different performances of vegetable/field         4        No. 315        G4    Advance line ICAR-IIVR, India
crops under different environments has been identified       5        VROB-181       G5    Advance line ICAR-IIVR, India
as the genotype environment interaction (GE). The            6        VRO-102        G6    Advance line ICAR-IIVR, India
study of GE is must, before release of any new variety/      7        VRO-107        G7    Advance line ICAR-IIVR, India
cultivar for high mean performance and stability in
                                                             8        VRO-109        G8    Advance line ICAR-IIVR, India
multi-environment trials (MET).
                                                             9        Parbhani Kranti G9   Variety       MAU, India
      Various conventional analytical methods are            10       Pusa Sawani    G10   Variety       ICAR-IARI, India
being adapted for evaluating genotype × environment
                                                             11       VRO-103        G11   Advance line ICAR-IIVR, India
interactions of traits along with stability. Rank sum
                                                             12       VRO-111        G12   Advance line ICAR-IIVR, India
method was modified by Kang (1993) by giving a single
selection criterion with merging yield and stability as      13       VRO-112        G13   Advance line ICAR-IIVR, India
yield stability static (YSi). Still, the most reliable and   14       VRO-104        G14   Advance line ICAR-IIVR, India
explored analytical methods in use include AMMI,             15       VRO-110        G15   Advance line ICAR-IIVR, India
GGE and genotypes main effects. Through this
                                                             16       Kashi Kranti   G16   Variety       ICAR-IIVR, India
method the genotype environment interaction can be
                                                             17       VROB-178       G17   Advance line ICAR-IIVR, India
quantified in terms of PCA and graphical representation
and hence adopted widely specifically for multi-             18       Arka Anamika   G18   Variety       ICAR-IIHR, India
environment cultivar trials (Kempton 1984; Gauch and         19       Varsha Uphar   G19   Variety       CCS HAU, India
Zobel 1997).                                                 20       VRO-108        G20   Advance line ICAR-IIVR, India

      India has large area under salt stress, thus there     21       VRO-106        G21   Advance line ICAR-IIVR, India
is a need to develop stable genotypes with high yield        22       AE-70          G22   Advance line TNAU, India
which can be recommended for sodic environments.             23       VRO-101        G23   Advance line ICAR-IIVR, India
Therefore, the present experiment is need of the hour        24       VRO-6          G24   Variety       ICAR-IIVR, India
and was planned and executed for identification of
suitable okra genotypes across different alkaline                 Table 2. Description of the environments
environments.
                                                                  S.No.       Code     Environments        Year
Materials and methods
                                                                  1           E1       pH 8.0±0.2          2015-16
The genetically pure seed of 24 diverse okra genotypes
                                                                  2           E2       pH 8.5±0.2
tolerant to yellow vein mosaic virus (YVMV) and okra
                                                                  3           E3       pH 9.0±0.2
enation leaf curl virus (OELCV) were used for this
experiment (Table 1). Seeds were surface sterilized               4           E4       pH 9.5±0.2
in a solution of 2% (0.02 g per ml) hypochlorite for 5            5           E5       pH 8.0±0.2          2016-17
min and rinsed thoroughly with distilled water. Seeds             6           E6       pH 8.5±0.2
were sown in micro-plots (2m × 2 m) having 10 plants/
                                                                  7           E7       pH 9.0±0.2
replication of each genotype in normal (pH 8.0±0.2),
                                                                  8           E8       pH 9.5±0.2
sodic (pH 8.5±0.2), medium sodic (pH 9.0±0.2) and
highly sodic (pH 9.5±0.2) environments during 2015-
16 and 2016-17 (Table 2). Plant to plant distance was
                                                                  soils as per treatments, 3.68 kg, 6.44 kg and 7.83 kg
kept as 40 cm with 50 cm row spacing. Sodic soil was
                                                                  sodium bi-carbonate was added to increase the pHs
prepared by adding sodium bi-carbonate, the quantity
                                                                  from 8.0 (normal soil) to 8.5, 9.0 and 9.5 respectively.
being calculated on the basis of pH and exchangeable
                                                                  The experiment was randomized in triplicate with
sodium percentage (ESP). Thus, for making the sodic
                                                                  complete block design. The data was recorded on plant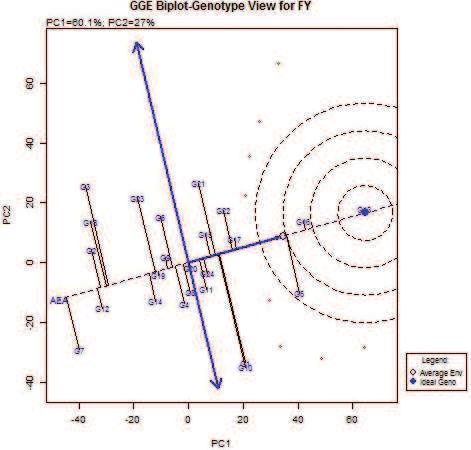
February, 2021]                Genotype environment interaction analysis for fruit yield in okra                            3

height (cm), days to 50% flowering, number of fruits/                 The correlation analysis was done by R Core
plant, fruit length (cm), fruit weight (g), fruit yield/plant     Team (2019).
(g), total chlorophyll (mg/g fw), proline (mg/g fw),
sodium and potassium content of root and shoot.                   Results and discussion

Statistical analysis                                              Mean performance

The genotype × environment interaction for fruit yield            Wide range of variation in mean performance of
was analyzed through additive main effect and                     genotypes throughout the environments was observed
multiplicative interaction (AMMI) and GGE-biplot                  in yield and yield contributing traits (Table 3). The
analysis using software package PB Tools version                  genotypic average for days to 50% flowering which is
1.4 (http://bbi.irri.org/products). AMMI utilize the              a sign of earliness ranged from 38.38 to 47.38 with
ANOVA for calculation of additive part (main effects)             mean 42.32. The average number of fruits per plant
and principal component analysis for non-additive part            ranged from 6.38 to 8.87 with a mean value of 7.57,
(Gauch and Zobel 1989). In addition to AMMI and GGE               while average fruit length varied from 7.38 to 8.50 cm.
biplot, the following stability statistics was also               Fruit weight ranged from 6.25 to 8.69 g with mean
measured.                                                         7.41 g and fruit yield per plant varied from 42.42 to
                                                                  79.99 g with mean of 57.14. Total chlorophyll content
 (1) AMMI stability value                                         which helps in photosynthesis varied from 4.41 to 8.52
                                                                  mg/g with mean 6.76 mg/g, while proline an amino
The method given by Purchase et al. (2000) was used
                                                                  acid, plays a highly beneficial role in plants exposed
for AMMI stability value (ASV) using following formula:
                                                    2             to various stress conditions ranged from 2.30 to 3.90
ASV= [{(SSIPCA1/SSIPCA2) (IPCA1 score)} +
                2 1/2                                             mg/g with mean 3.28 mg/g. Similarly, K/Na ratio ranged
(IPCA2 score) ] Where, SSIPCA1/SSIPCA2 - the
                                                                  from 0.82 to 1.31 with mean 1.00 mg/g in roots while it
weight derived by dividing the sum of squares of IPCA1
                                                                  varied from 2.54 to 4.49 with mean 3.32 mg/g in shoot.
by the sum of squares of IPCA2. The specific
                                                                  Among different genotypes G13 performed better for
adaptability of a genotype to certain environment is
                                                                  fruit yield per plant, number of fruits per plant and total
directly proportional to ASV value in both positive and
                                                                  chlorophyll content. G10 took minimum days for 50%
negative directions. Lower ASV value means a more
                                                                  flowering followed by G8 and G16. G21 had highest
stable genotype across the environments.
                                                                  fruit length and G8 had maximum value for root K/Na.
(2) Yield stability index                                         G18 scored highest value for proline content and G20
                                                                  for shoot K/Na. All the genotypes showed a significant
The yield stability index (YSI) was calculated using
                                                                  reduction in the expression of different traits at pH 9.5
the formula: YSI = RASV + RY where, RASV - rank of
                                                                  in comparison to pH 8.0. High amount of salt in leaf
the AMMI stability value and RY - rank of the mean
                                                                  and deficiency of water results in closing of stomata
grain yield of genotypes.
                                                                  which lead to the reduction in rate of transpiration and
      A low value of yield stability index indicates              concentration of CO2 and ultimately affects the total
desirable genotypes with high mean yield and stability.           chlorophyll content, plant height and yield (Redondo-
                                                                  Gómez et al. 2007; Saleem et al. 2011; Wani et al.
(3) Wricke’s ecovalence (Wi)                                      2013). Under salt stress conditions, plant height, fresh
        Wi = [Yij – Yi. – Y.j –Y..]2                              weight, dry weight and root length, chlorophyll and
                                                                  proline content were significantly reduced in Okra crop
where                                                             as reported by Sanwal et al. (2019), leaf area index
                                                                  and shoot length by Abbas et al. (2013) and germination
        Yij - is the mean performance of ith genotype in
                                                                  percentage and root length by Shahid et al. (2011).
jth   environment
                                                                  Stability analysis based on ASV, YSI and Wi 2
    Yi.and Y.j represents genotype and environment
                                                                  ecovalence
mean deviations,
                                                                  Initially analysis of variance was carried out for
        Y..- overall mean.
                                                                  individual environment and then data was used to
      Genotypes with a smaller value have minimum                 identify generally adapted specifically adapted
deviations from the mean across environments and                  genotypes using PB Tool. Homogeneity of variance
are thus more stable (Wricke 1962).                               was tested using Bartlett’s test. Stable genotypes with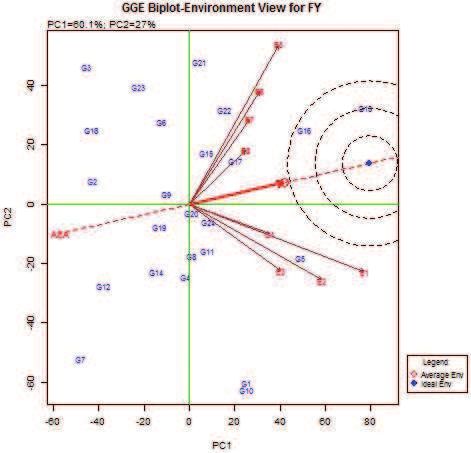
4                                                  Satish Kumar Sanwal et al.                                           [Vol. 81, No. 1

Table 3. Mean performance of Okra genotypes under the study across the environments

Genotypes        PH           DF         NFPP          FL         FW          FY          TC          P         RKN          SKN
G1              61.33       42.88         8.13       8.36        7.37        61.19       7.37        3.28        0.83        3.06
G2              94.38       40.63         6.90       7.38        6.56        45.51       7.41        3.31        0.85        3.64
G3              80.93       43.00         7.02       8.10        6.47        46.52       6.74        3.46        0.91        3.59
G4              59.96       43.63         6.63       7.65        8.13        54.26       6.60        3.05        0.92        3.27
G5              47.68       47.38         8.05       7.86        8.50        69.72       6.98        3.17        1.24        2.78
G6              88.18       41.13         7.53       8.06        7.25        55.23       6.34        3.03        0.99        3.24
G7              78.51       41.25         6.56       7.55        6.55        42.42       7.50        3.12        0.96        2.99
G8              88.01       38.38         8.16       7.97        6.91        57.13       7.67        3.71        1.31        2.98
G9              98.93       43.88         8.06       7.89        6.49        53.67       6.06        3.63        0.82        2.86
G10             84.50       38.38         7.99       8.25        7.33        60.60       6.27        3.72        1.23        3.46
G11             86.41       42.25         8.16       7.55        7.17        58.61       6.16        2.93        0.95        3.98
G12             66.01       46.75         7.25       7.77        6.25        45.02       7.66        2.30        1.15        3.45
G13             86.63       41.63         8.87       8.32        8.20        79.99       8.52        3.83        1.08        4.15
G14             75.16       42.25         6.73       7.58        7.72        52.18       5.60        3.29        0.87        3.31
G15             88.29       40.75         7.42       7.68        8.20        61.45       5.83        3.36        1.00        2.54
G16             87.46       39.38         8.45       8.33        8.32        70.93       7.78        3.45        1.03        2.94
G17             66.13       43.13         7.30       8.00        8.69        64.13       7.07        2.86        0.83        3.79
G18             80.25       41.38         7.10       7.48        6.44        46.65       6.72        3.90        1.00        2.97
G19             94.19       40.13         7.68       8.26        6.94        53.72       6.32        2.53        1.02        3.03
G20             94.33       42.75         7.66       7.55        7.39        57.08       7.16        2.81        1.00        4.49
G21             88.88       43.13         8.06       8.50        7.40        60.74       7.19        3.68        0.87        3.44
G22            104.00       45.00         7.62       8.13        8.12        62.91       4.41        3.26        1.04        2.73
G23             81.95       43.50         6.38       7.67        8.09        52.61       6.35        3.33        1.05        3.72
G24             82.50       43.13         7.95       8.34        7.33        59.20       6.59        3.43        1.15        3.32
Mean            81.86       42.32         7.57       7.93        7.41        57.14       6.76        3.27        1.00        3.32
Min             47.68       38.38         6.38       7.38        6.25        42.42       4.41        2.30        0.82        2.54
Max            104.00       47.38         8.87       8.50        8.69        79.99       8.52        3.90        1.31        4.49
Variance       179.32        4.99         0.42       0.11        0.54        79.19       0.74        0.16        0.02        0.23
SD              13.39        2.23         0.65       0.33        0.74         8.90       0.86        0.40        0.14        0.48
CV              16.36        5.28         8.58       4.23        9.96        15.57      12.71       12.13       13.59       14.33
PH=Plant height (cm), DF=days to 50% flowering, NFPP=number of fruits/plant, FL=fruit length (cm), FW=fruit weight (g), FY=fruit yield/
plant (g), TC=total chlorophyll (mg/g fw), P=proline (mg/g fw), RKN=root potassium sodium ratio, SKN=shoot potassium sodium ratio

high mean yield across different environments were                      (53.67 g) and G17 with mean fruit yield (64.13 g) have
identified using AMMI stability value (ASV), yield                      low ASV value. Yield stability index incorporates both
stability index (YSI) and Wricke’s ecovalence (1962)                    mean yield and stability in a single criterion. Low values
(Table 4). According to ASV method a genotype with                      of both parameters show desirable genotypes with high
low ASV value is considered as stable genotype while                    mean yield and stability (Bose et al. 2014). Genotypes
a high ASV value either in positive or negative direction               with low ASV value are given rank one while in case
indicates specific adaptability of a genotype to                        of mean yield the high yielding genotypes is given
particular environment (Purchase et al. 2000). For fruit                rank one. For fruit yield genotypes, G13, G17, G16
yield, G20 with mean fruit yield (57.08 g), G19 with                    and G20 were observed as stable genotypes with mean
mean fruit yield (53.72 g), G9 with mean fruit yield                    fruit yield 79.99 g, 64.13 g, 70.93 g, and 57.08 g,
February, 2021]            Genotype environment interaction analysis for fruit yield in okra                                5

Table 4. IPCA Score and yield-stability statistics of 24      Table 5. Analysis of variance for fruit yield of 24 okra
         okra genotypes for fruit yield                                genotypes across the environments

Code FY        IPCA1 IPCA2 Wi2            ASV     YSi                                                  Fruit yield
G1     61.19   -3.97   0.23    1456.94 15.17      29          Source                    df           MS        % explain
G2     45.51   1.44    0.62    251.45     5.54    36          Trial                     95         384.71*
G3     46.52   3.67    0.25    1236.02 14.02      42          Genotypes (G)             23         633.48*       19.83
G4     54.26   -1.47   -1.42   535.25     5.79    30          Environments (E)          3          6620.55*      63.07
G5     69.72   -2.19   -0.85   689.22     8.41    20          G×E                       69          78.05*       17.10
G6     55.23   1.88    0.28    398.38     7.19    30          PCA 1                     25         274.17*       62.27
G7     42.42   -1.67   3.31    790.01     7.19    40          PCA 2                     23          76.86*       16.51
G8     57.13   -0.95   1.01    154.38     3.77    21          PCA 3                     21          41.07*           8.17
G9     53.67   0.35    -0.74   197.65     1.53    20          *significance at the 0.01 % levels
G10    60.60   -4.17   -0.37   1587.58 15.93      32
G11    58.61   -1.07   -0.09   215.03     4.09    23
                                                              seasons from 2006 to 2009 using AMMI model by
G12    45.02   -0.67   0.60    178.80     2.63    30          Alake and Ariyo (2012) and reported that 77.2%, 4.6%
G13    79.99   -0.04   -2.51   380.27     2.51    7           and 18.1% of total variation by genotype, environment
G14    52.18   -0.94   0.67    154.73     3.65    27          and GE respectively. Nwangburuka et al. (2011)
G15    61.45   0.95    1.68    278.32     4.00    17          studied GE interaction for 29 accessions of okra in
                                                              four environments and observed that 70.8% of the
G16    70.93   0.03    -3.96   853.85     3.96    12
                                                              total variation was mainly due to environment, 10.2%
G17    64.13   0.42    0.90    367.61     1.84    8           due to genotype and 19% due to GE interaction.
G18    46.65   2.45    0.87    681.25     9.40    38          Choudhary et al. (2019) also reported 72.4-87.0% of
G19    53.72   -0.06   1.10    111.47     1.12    18          the total variation due to environment, 2.5-7.3% due
G20    57.08   -0.20   -0.16   91.40      0.78    14          to genotype and 10.5-24.1% due to GE interaction in
                                                              baby corn over eight locations. Srivastava et al. (2011),
G21    60.74   2.61    -0.46   636.90     9.98    27
                                                              Hamed and Hafiz (2012) and Javia (2014) used
G22    62.91   1.42    -0.94   271.28     5.51    18          Eberhart and Rusell (1966) model to analyse GE
G23    52.61   2.72    -0.23   799.89     10.39   38          interaction and identified stable and high yielding okra
G24    59.20   -0.53   0.19    246.47     2.03    15          genotypes. The first two principal component accounts
                                                              for 78.78% of the total genotype × environment
                                                              interaction for fruit yield. For grain yield of basmati
respectively. Genotypes with low Wi2 value indicates          rice, AMMI analysis revealed that the first two
less deviation from mean value across the                     significant IPCA scores together explained 77.18% of
environments and hence are most stable (Wricke                the total interaction variance (Dwivedi et al. 2020).
1962). G20, G19, G8 and G14 with mean value 57.08             Genotypes, G22, G15 and G17 for fruit yield (Fig. 1)
g, 53.72 g, 57.13 g, 52.18 g, respectively were reported      were found as generally adaptable and high yielding
as stable genotypes for fruit yield.                          genotypes as these genotypes showed IPCA 1 value
                                                              close to zero. These genotypes are less influenced
AMMI 1 biplot analysis                                        by the environments. Among the environments, E1,
The pooled analysis of variance revealed that mean            E2, E5 and E6 were found high yielding environment
squares due to environments, genotypes, and                   for fruit yield. However, these environments have large
genotype environment interaction were significant for         IPCA 1 score so they are suitable for the identification
fruit yield indicating significant variability among          of specifically adapted genotypes.
different environments and genotypes (Table 5).               GGE biplot analysis
Genotypes, environment and genotype environment
interaction (GEI) depicts 19.83%, 63.07% and 17.10%           Discriminating ability and representation of test
of the total variation for fruit yield. Twenty five           environments
genotypes of okra were evaluated for five planting
                                                              The most representative and most discriminating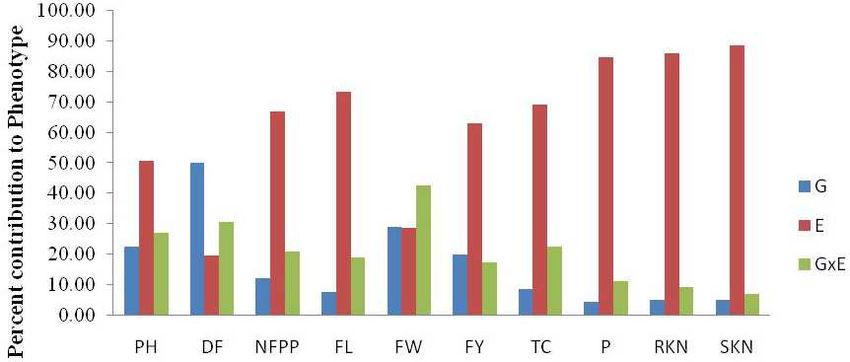
6 Satish Kumar Sanwal et al. [Vol. 81, No. 1
environment is considering as the most ideal environments (Yan et al. 2007). The AEC is the line
environment (Yan 2001). The length of the vector from which goes through the origin of biplot and average
the origin of biplot and angle between vector and environment. Environment E1 and E5 for fruit yield
average environment axis (AEC) measures the (Fig. 2) were identified as most discriminating and
discriminating ability and representativeness of the found suitable for the identification of specifically
test environment (Yan and Kang 2003). The longer adaptable genotypes. The test environments should
vector length means high discriminating ability and have high IPCA 1 value to discriminate among the
smaller angle means more representativeness of the environments and small IPCA 2 value for more
Fig. 1. AMMI-1 biplot for fruit yield of Okra genotypes Fig. 2. Comparison of environments with ideal
across the environments environment for fruit yield
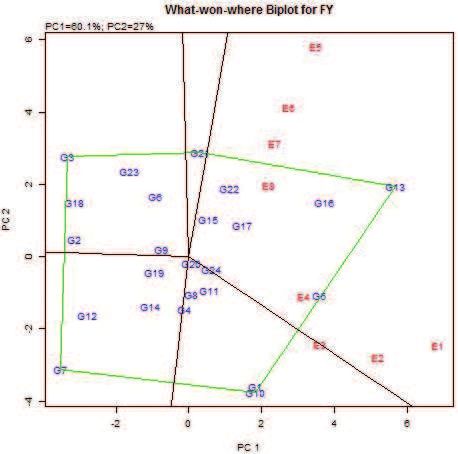
Fig. 4. Polygon view of genotype-environment
Fig. 3. Comparison of genotypes with respect to ideal
interaction across the environments for fruit
genotype for fruit yield
yield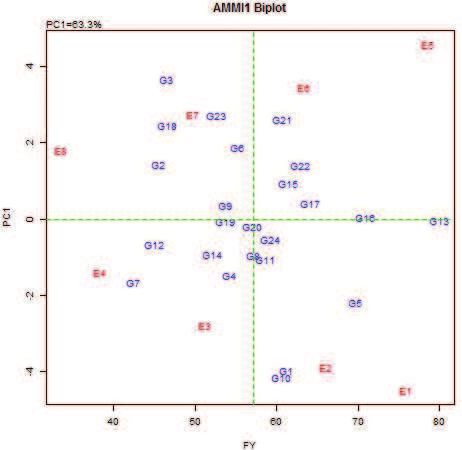
February, 2021]            Genotype environment interaction analysis for fruit yield in okra                          7

                          (A)                                                            (B)
                        Fig. 5. Correlation heat map of yield traits in different environments

                                                              Ranking of genotypes relative to ideal genotype
                                                              An ideal genotype is defined as having high mean
                                                              yield over different environments with stable
                                                              performance (Yan and Rajcan 2002; Yan and Kang
                                                              2003). The ideal genotype has high IPCA 1 (high
                                                              yielding) value and low IPCA 2 value (more stable).
                                                              The open blue circle with an arrow represents the point
                                                              of average environment coordinates (AEC) for
Fig. 6. Per cent contribution of genotype, environment        environments in Fig. 3, and the dark blue dot
        and interaction effects in phenotypic expression      represents the ideal genotype. Those genotypes which
        of each trait across the environments                 are located near the ideal genotype are more desirable
                                                              than others (Kaya et al. 2006; Mitrovic et al. 2012).
                                                              Similarly, genotypes having small length of vector are
representativeness over the locations (Yan and Rajcan         more stable and with longer vector are less stable
2002). The environment E4 and E8 for fruit yield were         (Yan and Kang 2003). Hence, genotypes, G13, G16,
found as most representative environment but are not          G17, G22, G15 and G24 for fruit yield were found most
discriminating. Non-discriminating environments do not        desirable among the all tested genotypes (Fig. 3). G20,
significantly discriminate between genotypes and              G9 and G19 for fruit yield were stable genotypes but
hence not recommended (Yan and Tinker 2006). Alake            are not desirable as they are present away from the
and Ariyo (2012) used Eberhart and Russell (1966),            ideal genotype. Olayiwola and Ariyo (2013) studied
AMMI and GGE biplot techniques for the evaluation             the GE interaction of twelve okra genotypes using GGE
of twenty five West African okra genotypes in five            biplot and YSi technique of stability analysis and
different environments. Among the three techniques            observed that YSi was less effective in the high yielding
AMMI and GGE biplot was found more powerful than              and stable genotypic selection. Both GGE biplot and
Eberhart and Russell (1966) in describing the GE              AMMI model are equally efficient for the identification
interaction whereas GGE biplot is more suitable for           of stable and high yielding genotypes across the
environment and genotypic interactions as compared            environments and stable and ideal environment for
to AMMI model.                                                the genotypic evaluation (Nwangburuka et al. 2011).
8 Satish Kumar Sanwal et al. [Vol. 81, No. 1
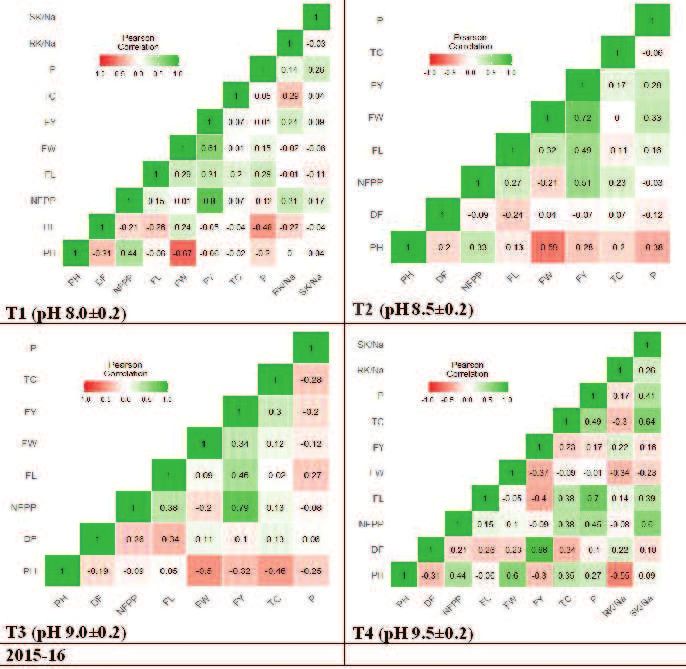
Polygon view for specific adaptation environment was high for all the traits studied except
DF and FW (Fig. 6). The genotypic contribution (50.04
Which-won-where pattern represents the specific
%) in phenotypic expression was high only for days to
genotypic adaptation to a specific environment.
50% flowering (DF) while the contribution of interaction
Starting from the biplot origin perpendicular lines were
effect (42.47 %) was high for fruit weight (FW).
drawn to each side of the polygon (Kaya et al. 2006).
The four lines divide the graph into five sectors (Fig. Results of the present study clearly showed the
4). Genotypes G13, G1, G10, G7, G3 and G21 for differences among the tested environments in
fruit yield were present on the vertices. These determining the fruit yield per plant. Environments E1,
genotypes are either better or poor performing for a E2, E5 and E6 are most suitable for the identification
particular or across the environments due to their of specifically adaptable genotypes while E4 and E8
scattering far away from the origin of biplot (Yan and are most representative environment. On the basis of
Kang 2003). Genotypes, G13, G16, G22, G15, G17 different stability and adaptability measures using
and G5 fell into sector 1 with G13 as vertex genotypes AMMI, GGE biplot and Ysi statistics, we can say that
for fruit yield were the high yielding genotypes for these VRO-112, VRO-110, Kashi Kranti, VROB-178, AE-70
eight environments. Similar findings in okra were also and VRO-108 are high yielding and stable genotypes
reported by Nwangburuka et al. (2011) and Olayiwola over the tested alkaline environments. This study will
and Ariyo (2013). The genotypes present on vertices be helpful for selecting and recommending suitable
were the most sensitive, as they are present far from genotypes for alkalinity prone area and for selecting
the origin (Yan and Tinker 2006). However genotypes the parents for alkalinity tolerance breeding.
present near the origin are less sensitive genotypes.
Partitioning of genotype and environment interaction Authors’ contribution
by GGE biplot showed that IPCA 1 and IPCA 2
Conceptualization of research (SKS, AM); Designing
accounted for 60.10 % and 27.00 % with sum of
of the experiments (SKS, AKR); Contribution of
87.00% for fruit yield of the total variance.
experimental materials (SKS); Execution of field/lab
Correlation analysis experiments and data collection (GK, RK); Analysis
of data and interpretation (SKS, HK); Preparation of
Correlation between yield and its related traits was manuscript (SKS, HK, AM).
analyzed for both years and each environment (Fig.
5). Fruit yield was positively and significantly Declaration
associated with number of fruits per plant, average
The authors declare no conflict of interest.
fruit weight and fruit length across the environments
except the T4 environment of season 2015-16 indicating References
that fruit yield of okra can be increased by direct
selection for these traits. Number of fruit per plant Abbas T., Pervez M. A., Ayyub C. M., Shaheen M. R.,
Tahseen S., Shahid M. A., Bilal R. M. and Manan A.
showed positive correlation with fruit yield and fruit
2013. Evaluation of different okra genotypes for salt
length across the environments except in environment tolerance. Int. J. Plant, Ani. Environ. Sci., 4: 23-30.
T4 of 2015-16. Root and shoot K/Na ratio had a positive
Alake C. O. and Ariyo O. J. 2012. Comparative analysis of
correlation with fruit yield/plant in both the years. genotype x environment interaction techniques in
Positive correlation of fruit yield per plant with number West African Okra, (Abelmoschus caillei, A. Chev
of fruits per plant, fruit weight and fruit girth was also Stevels). J. Agric. Sci., 4: 135-150.
reported by Shivaramegowda et al. (2016), Koundinya Annual Report. 1997. Annual report Central soil salinity
and Dhankhar (2013) and Balakrishnan and research institute. pp 204.
Sreenivasan (2010) in Okra crop.
Balakrishnan D. and Sreenivasan E. 2010. Correlation
and path analysis studies in okra Abelmoschus
Phenotypic expression of each trait across the
esculentus (L.) Moench. Madras Agric. J., 97: 326-
environments was studied by calculating the per cent
328.
contribution of genotype, environment and interaction
Bose L. K., Jambhulkar N. N., Pande K. and Singh O. N.
effects and it was observed that fruit yield was
2014. Use of AMMI and other stability statistics in the
contributed mainly by environment (63.07%), followed simultaneous selection of rice genotypes for yield
by genotype (19.83%) and their interaction (17.10%). and stability under direct-seeded conditions. Chil. J.
The percentage of explanation of phenotype by Agric. Res., 74: 3-9.February, 2021] Genotype environment interaction analysis for fruit yield in okra 9
Charrler A. 1984. Genetic Resources of the Genus variety by environment interactions. J. Agric. Sci., 103:
Abelmoschus Med. (Okra). International board for 123-135. doi: 10.1017/S0021859600043392.
plant genetic resources; IBPGR Secretariat-Rome. Koundinya A. V. V. and Dhankhar S. K. 2013. Correlation
Available online at: http://pdf.usaid.gov/ pdf_docs/ and path analysis of seed yield components in okra
PNAAT275.pdf. Abelmoschus esculentus (L.) Moench. Ann. Hort.,
Choudhary M., Kumar B., Kumar P., Guleria S. K., Singh 6(1): 145-148.
N. K., Khulbe R., Kamboj M. C., Vyas M., Srivastava Minhas, P.S. and Gupta R. K. 1993. Using high salinity
R. K., Puttaramanaik, Swain D, Mahajan V. and and SAR waters for crop production–Some Indian
Rakshit S. 2019. GGE biplot analysis of genotype × experiences. pp: 423-2. In: Leith, H.and Al-Masoom
environment interaction and identification of mega- (eds.). Towards the Rational Use of High Salinity
environment for baby corn hybrids evaluation in India. Tolerant Plants (vol.2). Kluwer Academic Publishers,
Indian J. Genet., 79(4): 658-669. DOI: 10.31742/ Amsterdam, The Netherlands.
IJGPB.79.43.
Mitrovic B., Stanisavljevi D., Treski S., Stojakovic M.,
Dhankhar B. S. and Mishra J. P. 2004. Objectives of okra Ivanovic M., Bekabac G. and Rajkovic M. 2012.
breeding. In: Singh P. K., Dasgupta S. K. and Tripathi Evaluation of experimental maize hybrids tested in
S. K. (eds.) Hybrid Vegetable Development. Haworth multi-location trials using AMMI and GGE biplot
Press, Binghamton, pp 195-209. analysis. Turkish J. Field Crops, 17: 35-40.
Dwivedi A., Basandrai D and Sarial A. K. 2020. AMMI Nwangburuka C. C., Kehinde O. B., Ojo D. K. and Denton
biplot analysis for grain yield of basmati lines (Oryza O. A. 2011. Genotype x environment interaction and
sativa L.) in North Western Himalayan Hill regions. seed yield stability in cultivated okra using the
Indian J. Genet., 80(2): 140-146. DOI: 10.31742/ additive main effect and multiplicative interaction
IJGPB.80.2.3. (AMMI) and genotype and genotype x environment
Eberhart S. A. and Russell W. A. 1966. Stability parameters interaction (GGE). Arch. Appl. Sci. Res., 3: 193-205.
for comparing varieties. Crop Sci., 6: 36-40. Olayiwola M. O. and Ariyo O. J. 2013. Relative
FAOSTAT. 2018. Available online at: http://faostat.fao.org/ discriminatory ability of GGE biplot and YSi in the
(Accessed April 8, 2020). analysis of genotype x Environment interaction in
Gauch H. G. and Zobel R. W. 1997. Identifying mega- okra (Abelmoschus esculentus (L.) Moench). Int. J.
environments and targeting genotypes. Crop Sci., Plant Breed. Genet., 7: 146-158.
37: 311-326. doi: 10.2135/cropsci1997.001118 Purchase J. L., Hatting H. and Deventer C. S. 2000.
3X003700020002x. Genotype × environment interaction of winter wheat
Gauch H. G. and Zobel R. W. 1989. Accuracy and selection (Triticum aestivum L.) in South Africa: Ð. Stability
success in yield trial analyses. Theor. Appl. Genet., analysis of yield performance. S. Afr. J. Plant Soil,
77: 473-481. 17: 101-107.
Hamed H. H. and Hafiz M. R. 2012. Selection of local okra R Core Team. 2019. R: A Language and environment for
(Abelmoschus esculentus L.) genotypes for stability statistical computing. (Version 3.6) [Computer
under saline conditions. Bull. Fac. Agric., 63: 188- software]. Retrieved from https://cran.r-project.org/.
200. Redondo-Gómez S., Mateos-Naranjo E., Davy A. J.,
Islam M. R., Sarke M. R. A., Sharma N., Rahman M. A., Fernández-Muñoz F., Castellanos E. M., Luque T.
Collard B. C. Y. and Gregorio G. B. 2015. Assessment and Figueroa M. E. 2007. Growth and photosynthetic
of adaptability of recently released salt tolerant rice responses to salinity of the salt-marsh shrub Atriplex
varieties in coastal regions of South Bangladesh. portulacoides. Ann. Bot., 100: 555-563.
Field Crops Res., 190: 34-43. doi: 10.1016/j.fcr.2015. Rui M. A. M. and Ricardo P. S. 2017. Soil Salinity: Effect
09.012 on Vegetable crop growth. Management practices
Javia R. M. 2014. Stability analysis for fruit yield and its to prevent and mitigate soil salinization. Hort., 3: 30;
attributing characters in okra [Abelmoschus doi:10.3390/ horticulturae 3020030.
esculentus (L.) Moench]. Int. J. Plant Sci., 9: 35-39. Saleem A., Ashraf M. and Akram N. 2011. Salt (NaCl)-
Kang M. S. 1993. Simultaneous selection for yield and induced modulation in some key physio-biochemical
stability in crop performance trials: consequences attributes in okra (Abelmoschus esculentus L.). J.
for growers. Agron. J., 85: 754-757. doi: 10.2134/ Agron. Crop Sci., 197: 202-213.
agronj1993. 021962008500030042x. Sanwal S. K., Gurpreet Kaur, Anita Mann, Rajkumar and
Kaya Y., Akcura M. and Taner S. 2006. GGE-biplot analysis Rai A. K. 2019. Response of okra (Abelmoschus
of multi-environment yield trials in bread wheat. esculentus L.) genotypes to salinity stress in relation
Turkish J. Agric. For., 30: 325-337. to seedling stage. J. Soil Salin. Water Qual., 11(2):
217-223.
Kempton R. A. 1984. The use of bi-plots in interpreting10 Satish Kumar Sanwal et al. [Vol. 81, No. 1
Shahid M. A., Pervez M. A., Balal R. M., Ahmad R., Ayyub Wani A. S., Ahmad A., Hayat S., Fariduddin Q. 2013. Salt-
C. M., Abbas T. and Akhtar N. 2011. Salt stress effects induced modulation in growth, photosynthesis and
on some morphological and physiological antioxidant system in two varieties of Brassica juncea.
characteristics of okra (Abelmoschus esculentus L.). Saudi J. Biol. Sci., 20: 183-193.
Soil and Environ., 30: 66-73. Wicke B., Edward S., Veronika D., Boris V., Thomas
Sharma D. K. 2014. CSSRI Vision 2050. Central Soil G. Wim T. and André F. 2011. The global technical
Salinity Research Institute, Karnal. and economic potential of bioenergy from salt-
Shivaramegowda K. D., Arya K., Jayaramu Y. K., Kumar affected soils. Energ. Environ. Sci., 4: 2669-2681.
V., Yashoda and Koh H. 2016. Genotypic variation Wricke G. 1962. Übereine Methode zur Erfassung der
among okra (Abelmoschus esculentus (L.) Moench) ökologischen Streubreite in Feldversuchen. Z.
germplasms in South India. Plant Breed. Biotechnol., Pflanzenzücht., 47: 92-96.
4(2): 234-241. Yan W. 2001. GGE biplot - A windows application for
Shrestha S., Asch F., Dusserre J., Ramanantsoanirina A. graphical analysis of multienvironment trial data and
and Brueck H. 2012. Climate effects on yield other types of two-way data. Agron. J., 93: 1111-
components as affected by genotypic responses to 1118.
variable environmental conditions in upland rice Yan W. and Kang M. S. 2003. GGE biplot analysis: A
systems at different altitudes. Field Crops Res., 134: graphical tool for breeders, geneticists and
216-228. doi: 10.1016 /j.fcr. 2012.06.011. agronomists. CRC Press, Boca Raton.
Srivastava K., Aparna J., Singh P. K. and Kumar S. 2011. Yan W. and Rajcan I. 2002. Biplot analysis of test sites
Stability performance of okra hybrids over and trait relations of soybean in Ontario. Crop Sci.,
environments. In: National Seminar on Contemporary 42: 11-20.
Approaches to Crop Improvement. Abstr., 138: 244.
Yan W. and Tinker N. A. 2006. Biplot analysis of
Unlukara A., Kurunc A., Kesmez G. D. and Yurtseven E. multienvironment trial data: Principles and
2008. Growth and evapotranspiration of okra applications. Can. J. Plant Sci., 86: 623-45.
(Abelmoschus esculentus L.) as inûuenced by salinity
of irrigation water. J. Irrig. Drain. E- ASCE, 134: 160- Yan W., Kang M. S., Ma B., Woodss S. and Cornelius P. L.
166. 2007. GGE Biplot vs AMMI analysis of genotype by-
environment data. Crop Sci., 47: 643-653.You can also read