Brazilian Earth Observation Data Cube using AWS for Land Use and Cover Change
←
→
Page content transcription
If your browser does not render page correctly, please read the page content below
Brazilian Earth Observation Data Cube using
   AWS for Land Use and Cover Change

Host institution: National Institute for Space Research (INPE), Brazil

Project leader: Prof. Dr. Karine Reis Ferreira (INPE)
Mailing address and phone: Av. dos Astronautas, 1.758 - 12227-010 -
São José dos Campos, SP - Brazil / +55(12)3208-6523
Email: karine.ferreira@inpe.br

Project members from INPE:
MsC. Alber Sánchez,
Prof. Dr. Claudio Almeida,
Prof. Dr. Gilberto Ribeiro de Queiroz,
Dr. Hugo Bendini,
Prof. Dra. Ieda Sanches,
MsC. Jeferson de Souza Arcanjo,
Prof. Dr. Leila Fonseca,
MsC. Lorena Santos,
Prof. Dr. Lubia Vinhas,
Dr. Michel E. D. Chaves,
Dra. Michelle Picoli,
Eng. Ricardo Cartaxo Modesto de Souza,
Dr. Rodrigo Anzolin Begotti,
MsC. Rolf Simões,
MsC. Vitor Gomes

Collaborators: Dr. Alexandre Coutinho (Brazilian Agricultural Research
Corporation (Embrapa), Embrapa Agricultural Informatics, Brazil)
Dr. João Antunes (Embrapa), Dr. Julio Esquerdo (Embrapa)
1      Executive Summary
The Institute for Space Reseach (INPE) is the main federal research institute in
Brazil in Earth Observation and Space Science areas. Since 1988, INPE has led
projects that produce official and crucial Land Use and Cover Change (LUCC)
information used by the Brazilian government to formulate important public
policies in the environmental area. These data sets are produced within the
projects PRODES1 , DETER2 and TerraClass3 . The Near Real Time Defor-
estation (DETER) project maps deforestation alerts for the Brazilian Amazon
using imagery from low-resolution imagery (MODIS 250 m and CBERS4-WFI
64 meters) since 2004. Although only deforested areas larger than 25 ha can
be detected, the high temporal resolution of these images allows detecting such
areas at the same day of the forest suppression, given cloud-free atmospheric
conditions.
    The system for monitoring the Brazilian Amazon forest by satellite (PRODES)
is an internationally acclaimed project that monitors shallow-cut deforestation
in the Brazilian Amazon since 1988 and in savanna biome (Cerrado) since 2016.
Unlike DETER, which makes early deforestation alerts based on low-resolution
imagery, PRODES is responsible for providing accurate official deforestation
rates provided each year for that region. PRODES uses medium-resolution im-
agery from different satellites, mainly Landsat and CBERS, as a way to reduce
the time interval between observations and mitigate the loss of information due
to cloud coverage.
    The TerraClass project investigates what the deforested areas detected by
PRODES have become, understanding and explaining LUCC processes in the
Brazilian Amazon and Cerrado biome. Based on remote sensing data analysis
and geoinformation techniques, interpreters classify deforested areas into differ-
ent land use and cover classes and evaluate the spatiotemporal and semantic
dynamics of these areas.
    The DETER, PRODES and TerraClass projects use a methodology mainly
based on visual interpretation of remote sensing imagery. In the current era of
big Earth observation data, it is crucial to improve this methodology in order
to actually take advantage of the big amount of remote sensing imagery freely
available nowadays. In recent years, INPE has invested in two projects, called
e-Sensing and Brazilian Earth Observation Data Cube (BEO Data Cube), that
produce technological innovation to improve this methodology. These projects
take advantage of novel big data technologies and machine learning methods to
store, process and analyze big Earth observation data sets for LUCC detection
[4, 2, 5, 15].
    1 http://www.obt.inpe.br/OBT/assuntos/programas/amazonia/prodes
    2 http://www.obt.inpe.br/OBT/assuntos/programas/amazonia/deter
    3 http://www.dpi.inpe.br/tccerrado/

                                          1
1.1    Objective
The general objective of this proposal is to use and evaluate the AWS cloud
computing environment to develop the Brazilian Earth Observation Data Cube
(BEO Data Cube) project. This project aims to create novel data sets, methods
and techniques to advance the LUCC detection in Brazil, mainly supporting the
INPE monitoring programs PRODES, DETER and TerraClass.
    The BEO Data Cube project has four main objectives: (1) Create analysis-
ready data sets from medium-resolution remote sensing images (10 to 30 meters)
for all Brazilian territory, including images from the Earth observation satellites
Landsat, CBERS and Sentinel; (2) Model these analysis-ready data sets as mul-
tidimensional data cubes with three or more dimensions that include space,
time and properties; (3) Use, propose and develop novel methods and big data
technologies to store and process these big data sets and to analyze and extract
information from them using satellite image time series analysis, machine learn-
ing and image processing procedures; (4) Create LUCC information for Brazil
using the data cubes and methods developed in this project.

1.2    The importance of LUCC information in Brazil
Brazil is a forest country with approximately 58% of its territory covered by
natural and planted forests. The country wants to reduce emissions from de-
forestation and land use as a contribution to climate change mitigation and to
conserve its biodiversity. In NDC (Nationally Determined Contribution) pre-
sented at COP-21, Brazil is committed to reducing greenhouse gas emissions
by 20% in 2002 by 37% compared to national emissions in 2005. Brazil also
presented its intention to reduce emissions by 2030 by 43% compared to 2005.
This was the first time that a developing country has made a commitment to
reduce its emissions.
    According to NDC under the 2015 Paris Agreement, Brazil aims to achieve,
in the Brazilian Amazon, zero illegal deforestation and compensating for green-
house gas emissions (GHG) from legal suppression of vegetation by 2030; restor-
ing and reforesting 12 million hectares of forests by 2030; enhancing sustainable
native forest management systems, through georeferencing and tracking sys-
tems applicable to native forest management, with a view to curbing illegal and
unsustainable practices. Similarly, the program Reducing Emissions from De-
forestation and Forest Degradation in Developing Countries (REDD+) focuses
on initiatives to provide developing countries with incentives to reduce emissions
from forested lands or to increase forest areas.
    The reduction of GHG emissions from the land use sector in Brazil can
only be achieved if the country manages to combine production of value from
agriculture with protection of the environment. In order to assess if Brazil is
fulfilling its commitments made in the Paris agreement, a continued monitoring
of land use change is required. This monitoring needs to combine assessment
of loss of natural vegetation in biomes such as Amazonia and Cerrado with the
expansion of large-scale agriculture.

                                        2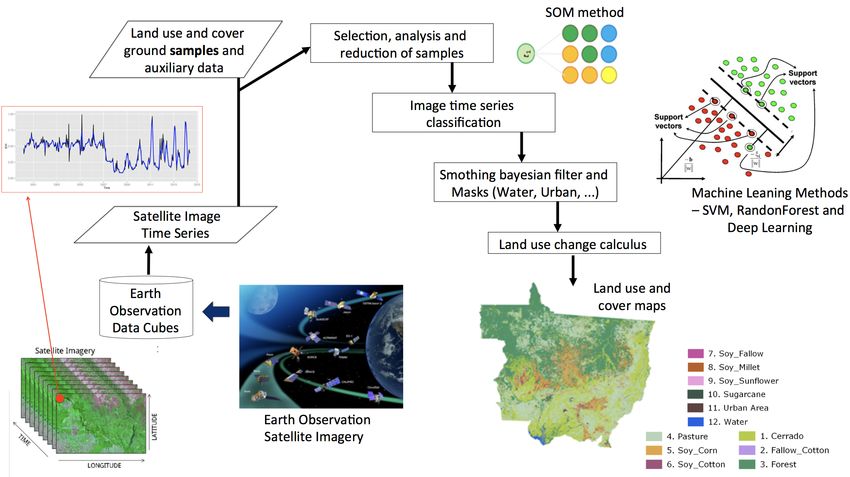
Satellite observations play an essential role in assessing trends in land use
and cover change [13]. These land use and cover maps are useful not only to
calculates the GHG emissions for the implementation of Brazil’s NDCs and
REDD+ activities, but also to provides information about the deforested ar-
eas location and expansion of these areas, agricultural expansion, (mainly the
expansion of raw material for biofuels production), and secondary vegetation
areas.
    Therefore, the intention of the Brazilian Earth Observation Data Cube is to
produce estimates of land use and cover changes in both the forestry and the
agriculture sector. We will use the data available at AWS, and the computing
facilities of AWS to produce detailed maps of land use change.
    The results of the project would allow the government to compare future
scenarios of preservation and production and thus define the most appropriate
public policies to achieve and even surpass the goals presented in the Brazilian
NDC. The project would help Brazil formulate and communicate long-term low
greenhouse gas emission development strategies, in accordance with Article 4,
Paragraph 19 of the Paris Agreement.

2     Work Plan - Methodology
This section presents the study areas and two work packages that will be devel-
oped in this proposal.

2.1    Study areas
In order to achieve the goals of this proposal, we selected three study areas in the
Brazilian Cerrado biome shown in Figure 1. This biome is the richest tropical
savanna vegetation in the world covering over 2 million km2 of the Brazilian
territory (similar area of the Western Europe). The Cerrado has high diversity
of vegetation structure with dense forests along the rivers, woodlands on the
steepest slopes and deep soils, and open scrublands in the plains and sandy soils
[17]. Due to soy moratorium in Amazon, part of demand for new areas for crops
has been transferred to Cerrado, which also has less legal restrictions for the land
coversion [8]. The conversion of Cerrado for agriculture crops and cattle raising
pastures has resulted in loss of 46% of its original cover [18], corresponding
currently to 26% of the greenhouse gas emissions from land conversion [16].
Despite of that worrying treats, less than 25% of Cerrado is under some kind of
legal protection [14].
    The three study areas correspond to different mesoregions defined by IBGE
(Brazilian Institute for Geography and Statistics). The Sul Goiano mesore-
gion (16◦ 16’-19◦ 37’S; 47◦ 12’-53◦ 14’W) is located in Southern Goiás state, in
the transition between Cerrado and Atlantic Forest biomes. It encompasses
the Central-western and Central and Southeastern biogeographical provinces
[3]. The Sudeste Mato-Grossense mesoregion (14◦ 35’-18◦ 04’S;52◦ 16’-55◦ 40’W)
is located in Mato Grosso state from border with Goiás in the East to tran-

                                         3
Figure 1: Brazilian Cerrado biome and the three study areas of BEO Data Cube
in AWS. White lines represent both Brazilian state and national South-America
borders.
sition Cerrado-Pantanal biomes in the West, encompassing Central Western
biogeographical province [3]. The Extremo Oeste Baiano mesoregion (10◦ 04’-
15◦ 16’S;43◦ 23’-46◦ 37’W) is located in Western Bahia state, where there has been
large expansion of soy crops at expenses of native vegetation [8]. It encompasses
the North-eastern biogeographical province [3].
2.2 Work Package 1 - Surface Reflectance and Data Cubes
According to CEOS report [7], Analysis Ready Data (ARD) refers to "satellite
data that have been processed to a minimum set of requirements and organized
into a form that allows immediate analysis without additional user effort". This
work package focuses on creating ARD data for the study areas described in
Section 2.1.
In this package, we will create surface reflectance products from the remote
sensing imagery provided in Digital Number of Landsat 8 (OLI), CBERS-4
(MUX and WFI) and Sentinel-2A/2B (MSI). We propose to generate the surface
reflectance products of the Landsat-8 and Sentinel satellites for the three defined
study areas and of the CBERS-4 for the whole Brazilian territory.
The products derived from the Sentinel-2 and Landsat-8 satellites will be
4generated in the AWS environment using EC2 instances that run specialized
dockers. The Landsat-8 reflectance products will be generated using the software
tool LaSRC4 provided by the USGS. This software will be embedded in a docker
and executed in the cloud environment. For Sentinel-2, the Sen2Cor processor5
performs, in addition to other corrections, the atmospheric correction. Like
LaSRC, Sen2Cor can also be executed in a docker, as the one available in:
https://github.com/lvhengani/sen2cor_docker.
The CBERS-4 surface reflectance data will be generated at INPE and trans-
ferred to S3 bucket at AWS. In the case of CBERS-4, it is important to mention
that MUX surface reflectance products are comparable, in quality, to Landsat
OLI ones, as pointed out by Martins et. al. [12]. The MUX camera collect im-
ages using four spectral bands (Blue, Green, Red and Nir), with 20 m of spatial
resolution and a swath of 120 km of the Earth. Figure 2 shows the CBERS-4
MUX WRS Grid over Brazil.
Figure 2: CBERS-4 WRS Grid for MUX
Table 1 presents an estimate of the number of scenes needed to cover the
three study areas, the size of each scene considering all bands of Sentinel 2A/2B,
Landsat-8 and CBERS-4 satellites, the data volume by year and the data volume
for the period available for each satellites. Table 2 presents the same estimate
for the whole Brazilian territory.
After generating surface reflectance products, we will create two data cubes
for the study areas using specific reference grids:
1. Sentinel-Landsat-MODIS Data Cube: this data cube will be created
4 https://github.com/USGS-EROS/espa-surface-reflectanc
5 http://step.esa.int/main/third-party-plugins-2/sen2cor/
5using reflectance products from Sentinel 2A/2B and Landsat 8 created in
this project and from MOD13Q1 and MYD13Q1 when the cloud cover is
critical in Sentinel 2A/2B and Landsat 8. The period of this data cube
will be from 2017 (the launch of Sentinel 2B) to 2021. It will be created
using a grid at 1:250,000 scale, as shown in Figure 3. This grid divides
the Brazilian territory in 560 tiles of 1 x 1.5 degree (approximately 110 x
165 km on the equator). To cover the study areas, we will create 38 tiles
of this grid. We will use the LongLat projection (EPSG 4326)6 , a spatial
resolution of 10 meters and a temporal resolution of 16 days.
2. CBERS4 Data Cube: this data cube will be created using reflectance
products from CBERS-4 AWFI. The period of this data cube will be from
2015 (the launch of CBERS4) to 2021. This data cube will be created
using a 1:500,000 grid in LongLat projection (EPSG 4326), tile size of 2 x
3 degrees (approximately 220 x 330 km on the equator), so it is necessary
163 tiles to cover Brazil. To cover the study areas, we will create 15 tiles.
We will use a spatial resolution of 64 meters and temporal resolution of 5
days.
Table 1: Data volume for the study areas. NS: Number of Scenes; SS: Scene
Size; DV by Year: Data Volume by Year; DV for the Period: Data Volume
for the Period.
Satellite-Sensor NS SS DV by Year Period DV for the Pe-
riod
CBERS4-MUX 95 300 MB 0.4 TB 2015 to 2021 2.8 TB
CBERS4-AWFI 20 1.8 GB 2.6 TB 2015 to 2021 18.2 TB
Landsat8-OLI 32 1 GB 0.8 TB 2017 to 2021 4 TB
Sentinel 2A/2B-MSI 89 1.3 GB 8.5 TB 2017 to 2021 42.5 TB
Total – – 12.5 TB – 67.5 TB
Table 2: Data volume for the whole Brazilian territory. NS: Number of Scenes;
SS: Scene Size; DV by Year: Data Volume by Year; DV for the Period:
Data Volume for the Period.
Satellite-Sensor NS SS DV by Year Period DV for the Pe-
riod
CBERS4-MUX 927 300 MB 4.1 TB 2015 to 2021 28.7 TB
CBERS4-AWFI - 1.8 GB 5.6 TB 2015 to 2021 39.2 TB
Landsat8-OLI 410 1 GB 9 TB 2017 to 2021 45 TB
Sentinel 2A/2B-MSI 1039 1.3 GB 99 TB 2017 to 2021 495 TB
Total – – 117.7 TB - 607.9 TB
6 http://spatialreference.org/ref/epsg/4326/
6Figure 3: 1:250,000 Grid for Brazil
We will develop Python scripts to generate these data cubes from the sur-
face reflectance products created in this project. The idea is to develop general
scripts that allow users to create data cubes in different reference grids, projec-
tions, spatial and temporal resolutions as well as tile sizes.
All products generated in this Work Package, surface reflectance and data
cubes, will be created in COG (Cloud Optimized GeoTIFF) format7 and will
be described using STAC (SpatioTemporal Asset Catalog)8 and OpenSearch9
specifications.
2.3 Work Package 2 - LUCC Classification
Our approach to generate LUCC maps is presented in Figure 4. We will use the
data cubes built in Work Package 1 from 2017 to 2021. In the first step, the
ground samples time series will be extract from these data cubes.
Our ground truth data set consists of 4611 land use samples recorded over
4000 km field trips throughout both paved and dirt roads in each of the three
pilot areas, as shown in Figure 1. The samples recorded 8 different classes
including natural vegetation types and human land uses such as agricultural
crops and pastures. The definition of the classes aims at representing the most
representative land uses found in Cerrado biome, according to Brazilian Institute
of Geography and Statistics (IBGE) as follow: i) gallery forests; ii) savanna; iii)
pasture; iv) soybean; v) cotton; vi) maize; vii) sorghum; and viii) sunflower. The
ground truth samples will be used for training the classifiers that will generate
the land use and land cover maps, as well as an independent subset will be used
for classification validation. Research groups of the INPE and Embrapa working
7 https://www.cogeo.org/
8 https://github.com/radiantearth/stac-spec
9 https://github.com/dewitt/opensearch
7Figure 4: Diagram LUCC Classification method.
in collaboration with us will continue to provide more ground truth samples to
feed our dataset as soon as there are new field surveys.
The second step will consist on pre-processing of samples. The use of clus-
tering methods as pre-processing are suitable for assisting users to select repre-
sentative land cover change samples from vegetation indexes time series through
metrics that indicate the sample quality and separability. In this step we will ap-
ply one unsupervised neural network, such as the Self-Organizing Maps (SOM)
method, to evaluate these samples.
The structure of SOM is composed by input and output layers. In the input
layer contains all time series samples to be evaluated, also called training data.
The output layer consist of a 2-D grid of neurons. Each neuron has a vector of
weights representing a pattern of the input data [10].
The third step will consist in to use innovative machine learning methods for
classifying satellite image time series. We will classify the dense satellite image
time series, using the methods like: Support Vector Machine (SVM), Deep
Learning (DL), and Random Forest (RF). These advanced statistical learning
methods, is a robust and efficient approach for land cover classification of dense
satellite image time series.
To estimate the classification accuracy, we will run a 5-fold cross-validation
procedure [19]. In this validation, we run five different assessments. For each
assessment, 80% of the samples were used for training and 20% for prediction.
The accuracy of all five classifications is averaged to produce a single estimation.
The 5-fold validation has some advantages compared to other validation meth-
ods. The cross-validation aims to find out how well a given statistical learning
procedure can be expected to perform using independent data [9].
The fourth step will involve a post-processing procedure based on filtering.
8We will use a Bayesian smoothing method to reclassify the pixels based on
machine learning probabilities associated to each class and each pixel. The main
rationale is to change those pixels classes with low certainty (high entropy) to
the neighborhood classes with high certainty (low entropy) using a Bayesian
inference.
In the last step, we will apply a methodology called LUC Calculus to deal
with trajectories in classified maps [11]. LUC Calculus have extended Allen’s
proposal to spatial locations as part of a more general framework for reasoning
about land-use change [1]. Each image can be thought of a set of locations
(pixels) whose values describe the state of the study area at a given time. The
spatial locations correspond to pixels in the images.
This methodology will be applied using the sits - Satellite Image Time Series
Analysis package developed in R. The R package sits, provides a set of different
visualization methods for image time series, different clustering methods, ma-
chine learning methods for time series classification, including SVM, RF, DL,
LDA, QDA, GLM, statistical analysis and other tools that supports analysis of
long-term satellite image time series. The development version resides on the e-
sensing project’s GitHub account (https://github.com/e-sensing/sits) [6].
2.4 Summary
The project will produce three levels of data products: i) intermediary data; ii)
data cubes; and iii) land use and cover change (LUCC) maps. The intermediary
data sets consist in surface reflectance images. The data cubes are produced
from the intermediary data sets with pixels aligned over a specific tile system,
geometrically corrected and harmonised in terms of spectral bands. The LUCC
will be produced from the data cubes using machine learning methods, as a
mean of exploring the entire volume of data available in the cubes, in particular
exploring the image time series in each location. Our experience in previous
work, as well as the recent literature, shows that machine learning algorithms
have been successfully used to map crop and non-crop areas, identifying double
crops systems such as the combination of soybean, maize, cotton, and millet. We
will generate the scripts in AWS to access the data cubes and training samples,
to execute a machine learning method and then to produce the classified LUCC
map. We already have some machine learning models implemented in an R
package called sits that will be integrated in the AWS platform.
This process will not be self-running. We propose to tackle the complete
methodology to obtain the final LUCC map. That includes to explore the
best representative ground truth samples to train the machine learning model
to execute the classification and post processing techniques. This will require
experimentation and evaluation of results and thus refining the methods and
the process along the execution of the project.
93 Work Plan - Tasks, AWS Services, Deliverables
and Timetable
This section describes all tasks that will be performed during the project, which
AWS services we intend to use in each task and what deliverables we will pro-
duce. Each task will produce a deliverable in the end of its timeline shown in
Table 3. The tasks and their deliverables are:
[Task 1] Create surface reflectance products from Sentinel 2A/2B and Landsat
8 (OLI) for the three study areas described in Section 2.1. In this task, we will
use an instance of AWS EC2 to run dockers with the software tools LaSRC and
Sen2Cor. As result, we will generate around 50 TB of data that will be stored
in an AWS S3 service using the COG format. Deliverable: Surface reflectance
products from Sentinel 2A/2B and Landsat 8 (OLI) for the three study areas
presented in Section 2.1
[Task 2] Create surface reflectance products from CBERS-4 (MUX and AWFI)
for the whole Brazilian territory. In this task, we will generate around 70 TB
of data that will be stored in an AWS S3 service using the COG format. As
part of this task, we also intend to put these data sets under the AWS Public
Dataset Program. Deliverable: Surface reflectance products from CBERS-4
(MUX and AWFI) for the whole Brazilian territory.
[Task 3] Describe the surface reflectance products generated in Tasks 1 and
2 using STAC (SpatioTemporal Asset Catalog) and OpenSearch specification.
These metadata files will be stored in an AWS S3 service. Deliverable: STAC
metadata files describing the surface reflectance products generated in Tasks 1
and 2.
[Task 4] Develop scripts in Python to generate the two data cubes described
in Section 2.2 for the three study areas. We intend to use AWS Lambda service
to run these scripts without provisioning or managing servers. Besides that, we
intend to use AWS DynamoDB service for NoSQL databases and AWS RDS
service for relational database systems. These scripts will be available as open
source in the github environment. Deliverable: Scripts in Python to generate
data cubes from surface reflectance products.
[Task 5] Create the two data cubes described in Section 2.2 for the three study
areas using the scripts developed in Task 4. The data sets generated in this task
will be stored in an AWS S3 service using the COG format. As part of this task,
we also intend to put these data sets under the AWS Public Dataset Program.
Deliverable: Data cubes in COG format generated from surface reflectance of
Landsat 8, Sentinel 2A/2B and CBERS4 for the three study areas.
[Task 6] Describe the data cubes generated in Tasks 5 using STAC (SpatioTem-
10poral Asset Catalog) and OpenSearch specification. These metadata files will
be stored in an AWS S3 service. Deliverable: STAC metadata files describing
the data cubes generated in Tasks 5.
[Task 7] Install and configure an Open Data Cube instance using AWS ser-
vices and create scripts for automatically indexing the STAC metadata files of
the surface reflectance and data cubes produced in this project. OpenDataCube
(ODC)10 is an analytical framework comprised of a series of data structures and
tools that facilitate the organization and analysis of Earth observation data. It
allows the cataloging of massive data sets, providing a Python API, and OGC
WMS and WFS services for data access. In addition, a Jupyter Notebook
environment will be prepared to allow researchers to access, process, and an-
alyze previously indexed data using cloud computing resources. This Jupyter
Notebook will also be used for performance evaluation of ODC usage for data
processing in the cloud processing environment. In this task, we intend to use
the AWS EC2 service to run the Jupyter Notebook instance; the AWS RDS
for ODC metadata database and the AWS Lambda to run the scripts for data
indexing. Deliverable: A report that describes how the ODC was used and
possible customization in this source code done during this project.
[Task 8] Extend the sits package to read the STAC metadata files of the surface
reflectance and data cubes produced in this project and to load them as the
coverage data type in R. Deliverable: An extension of the sits package.
[Task 9] Organize the ground truth samples of land use and cover shown in
Figure 1 and their metadata in a relational database using the AWS RDS service.
Besides that, we intend to create a WFS (OGC Web Feature Service) as an
access interface for these samples. Deliverable: A relational database with
land use and cover samples and their metadata.
[Task 10] Create LUCC maps from 2017 to 2021 for the three study areas
described in Section 2.1, by classifying the data cubes generated in Task 5 using
the methodology presented in Section 2.3. In this task, we will use the sits
package running in an instance of the AWS EC2 service. The LUCC maps will
be stored in an AWS S3 service using the COG format. Deliverable: LUCC
maps from 2017 to 2021 for the three study areas.
[Task 11] Evaluate other software tools that provide machine learning methods
to classify the time series extracted from the data cubes produced in Task 5 and
to produce LUCC maps for the three study areas. We will evaluate the eo-
learn11 that is a Earth observation processing framework for machine learning
in Python. It will be integrated with the OpenDataCube platform explored in
Task 7. Besides that, we will investigate the AWS SageMaker service to build,
10 https://github.com/opendatacube
11 https://github.com/sentinel-hub/eo-learn
11train, and deploy machine learning models. Deliverable: A report with an
analysis of these machine learning tools and the results produced in this task.
[Task 12] Write a final report with all results of this project. Deliverable: A
final report that describes all tasks performed and results of this project.
Table 3: Task Schedule
Tasks Month 6 Month 12 Month 18 Month 24 Month 30 Month 36
Task 1 X X X X X
Task 2 X X X X X
Task 3 X X X X X
Task 4 X X X
Task 5 X X X X
Task 6 X X X X
Task 7 X X X X
Task 8 X X
Task 9 X X X
Task 10 X X X
Task 11 X X X
Task 12 X
In general, the tasks 1-9 end at the 30-month mark because we will produce
the data sets (surface reflectance images and data cubes) from September 2017
to August 2021. Our methodology to produce LUCC maps from data cubes
is based on the Brazilian crop season that begins at September and spans to
August of the next year. In this project, we will produce LUCC maps for four
crop seasons: 2017-2018, 2018-2019, 2019-2020 and 2020-2021. Thus, to produce
the last crop season 2020-2021 we will create these data sets until August 2021.
Assuming that the project will start in July 2019, August 2021 will occur at the
26-month mark of the project.
In the last six months of the project (36-month mark), we will focus on
improving/refining the data cubes products and their metadata (task 5 and 6)
and on creating the LUCC maps from these data cubes (task 10 and 11). By the
end of the project we can release more than one version of the same classification
maps as a result of our machine learning models.
4 Final remarks, preliminary work and cost esti-
mate
In this proposal, we will use the following AWS services: EC2, S3, Lambda,
RDS, Athena, DynamoDB and SageMaker. Section 3 describes how each service
will be used. All data sets and software tools used and produced in this project
will be made available under the "Intellectual Property Rights" described in the
12document "Application Form GEO-Amazon Earth Observation Cloud Credits
Programme".
Our team has experience with AWS. In the last two years, in the context of
the e-sensing project (http://www.esensing.org/), we used the AWS EC2 and
S3 services to produce LUCC maps for the state of Mato Grosso, Brazil, from
2011 to 2017 using MODIS image time series at 250-meter spatial resolution.
To do this work, we obtained a grant from AWS under their “Cloud Credits
for Research” program. The data sets produced are published in https://doi.
pangaea.de/10.1594/PANGAEA.899706.
In the e-sensing project, we used low-resolution images (250 meters) from
MODIS sensor. In this document, we are proposing to use medium-resolution
images (10 to 30 meters) from three different satellites, Landsat8, CBERS4 and
Sentinel 2A/2B. In this case, the data volume to be stored and processed is
much larger than the one used in the e-sensing project.
Based on our experience with AWS EC2 and S3 and using the AWS calcu-
lator, we estimated the costs of our project as summarized in Table 4. The cost
to store 50 TB produced in the Task 1 using the AWS S3 service is U$ 1,200 by
month. Thus, it will cost around U$ 43,200 during the three years of project.
Table 4: Cost estimate
AWS Service Task Cost for 3 Description
years (U$)
AWS S3 1 43,200 Storing 50 TB for 3 years
AWS EC2 10 5,500 1,216 hours to process 38 tiles of the
Sentinel-Landsat-MODIS data cube in
the AWS EC2 instance r4.8xlarge located
in Sao Paulo.
AWS EC2 10 4,500 960 hours to run 5 experiments in the
AWS EC2 instance r4.8xlarge located in
Sao Paulo. Each experiment will classify
6 tiles of the Sentinel-Landsat-MODIS
data cube.
AWS EC2 2-9 and 4,800 6,048 hours to run other tasks in the AWS
11 EC2 m4.4xlarge located in West Virginia.
Total – 57,800 –
The costs associated to Task 10 sum around U$ 10,000. To classify the 38
tiles of the Sentinel-Landsat-MODIS data cube described in Section 2.2 using
the sits package, we need to use 1,216 hours (or 50,6 days) of the AWS EC2
instance r4.8xlarge (32 CPU and 240 GB). This machine costs around U$ 110
for 24 hours of processing. Thus, the processing to generate the LUCC maps
of Task 10 will cost around U$ 5,500. Besides that, we need to process some
experiments with different machine learning methods and parameters before
producing the final LUCC map of the Task 10. We intend to run around 5
different experiments by classifying just 6 tiles (a small part of the study areas).
Using the same AWS EC2 instance r4.8xlarge, each experiment will take 192
hours (or 8 days) to run and will cost around U$ 900. Thus, these 5 experiments
will cost around U$ 4,500.
13To perform the other tasks, 2 to 9 and 11, we intend to use an AWS EC2
m4.4xlarge instance running 168 hours (or 1 week) by month during the project.
This machine costs U$ 0.8 by hour. Thus, it will cost U$ 134.4 by month or
around U$ 4,800 during the three years of the project.
We estimate the costs shown in Table 4 based on our previous experience
with AWS. However, in this project, we intend to use other AWS services, such
as Lambda, that will improve the processing performance. We believe that the
costs will decrease when we use all potential of these AWS services.
We understand the importance of making available the data sets and soft-
ware tools produced by the project in a such way that can be easily found and
cited by other researchers. In this trend, our team at INPE has already used
the platforms Pangaea, Zenodo and Nature Scientific Data to publish products
resulting from previous projects:
• https://doi.pangaea.de/10.1594/PANGAEA.899706
• https://doi.org/10.5281/zenodo.1974065
We intend to continue publishing all data products as open source in free
repositories, such as Pangaea and Zenodo, and publish data papers in scientific
journals.
All data sets and software tools produced in the project are free and open
source. We can identify three types of users that can be interested in the
products produced by the project:
1. Partners from other Brazilian institutes. As described in the Exec-
utive Summary, INPE has led projects that produce land use and cover
change information based on remote sensing imagery, such as PRODES,
DETER and TerraClass. Some of these projects are developed jointly
with other Brazilian institutes such as EMBRAPA (Brazilian Agricultural
Research Corporation). Members from EMBRAPA are listed as collabo-
rators of our project. Thus, the data cubes as well as the methods and
algorithms produced in our project will be useful for PRODES, DETER
and TerraClass teams.
2. Researchers. Researchers will be able to use and explore the data cubes
produced by the project and to advance in new methods and algorithms
to extract different kinds of information about Brazil from them.
3. Industry. We will disseminate the software scripts to produce the data
cubes as open source. The industry can use these scripts and customise
them to generate other types of data cubes (for example using other spatial
and temporal resolutions) to meet specific demands of clients and applica-
tions. Besides that, the industry can also use the data cubes produced by
our project for other purposes, meeting demands that we will not address
in this project.
14References
[1] Allen, J. F., 1983. Maintaining knowledge about temporal intervals. Com-
munications of the ACM 26 (11), 832–843.
[2] Assis, L., Queiroz, G., Ferreira, K., Vinhas, L., Llapa, E., Sanchez, A.,
Maus, V., Camara, G., 2017. Big data streaming for remote sensing time
series analytics using MapReduce. In: Proceedings of the XVII Brazilian
Symposium on GeoInformatics. Brazilian Journal of Cartography, Campos
do Jordão, SP, Brazil.
[3] Bridgewater, S., Ratter, J. A., Ribeiro, J. F., 2004. Biogeographic patterns,
b-diversity and dominance in the cerrado biome of brazil. Biodiversity and
Conservation 13, 2295–2318.
[4] Camara, G., Assis, L. F., Ribeiro, G., Ferreira, K. R., Llapa, E., Vinhas,
L., 2016. Big earth observation data analytics: matching requirements to
system architectures. In: Proceedings of the 5th ACM SIGSPATIAL Inter-
national Workshop on Analytics for Big Geospatial Data. ACM, pp. 1–6.
[5] Camara, G., Ribeiro, G., Vinhas, L., Ferreira, K. R., Cartaxo, R., Simões,
R., Llapa, E., Assis, L. F., Sanchez, A., 2017. The e-sensing architecture
for big earth observation data analysis. In: Proc. of the 2017 conference on
Big Data from Space (BiDS’17). pp. 1–4.
[6] Camara, G., Simoes, R., Andrade, P. R., Maus, V., Sánchez, A., de Assis, L.
F. F. G., Santos, L., Carvalho, A. Y., Maciel, A. M., Vinhas, L., de Queiroz,
G. R., Dec. 2018. e-sensing/sits: Version 1.12.5.
URL https://doi.org/10.5281/zenodo.1974065
[7] CEOS, 2016. Ceos future data access analysis architectures study.
[8] Gibbs, H. K., Rausch, L., Munger, J., Schelly, I., Morton, D. C., Noojipady,
P., Soares-Filho, B., Barreto, P., Micol, L., Walker, N., 2014. Brazil’s soy
moratorium. Science 347, 377–378.
[9] James, G., Witten, D., Hastie, T., Tibshirani, R., 2013. An Introduction
to Statistical Learning: with Applications in R. Springer, New York, EUA.
[10] Kohonen, T., 1998. The self-organizing map. Neurocomputing 21 (1-3), 1–6.
[11] Maciel, A. M., Camara, G., Vinhas, L., Picoli, M. C. A., Begotti, R. A.,
de Assis, L. F. F. G., 2018. A spatiotemporal calculus for reasoning about
land-use trajectories. International Journal of Geographical Information
Science 0 (0), 1–17.
[12] Martins, V. S., Soares, J. V., Novo, E. M., Barbosa, C. C., Pinto, C. T.,
Arcanjo, J. S., Kaleita, A., 2018. Continental-scale surface reflectance prod-
uct from cbers-4 mux data: Assessment of atmospheric correction method
using coincident landsat observations. Remote Sensing of Environment 218,
55–68.
15[13] Onoda, M., Young, O. R. (Eds.), 2017. Satellite Earth Observations and
their impact on society and policy. Springer, Singapore.
[14] Overbeck, G. E., Velez-Martin, E., Scarano, F. R., Lewinsohn, T. M., Fon-
seca, C. R., Meyer, S. T., Müller, S. C., Ceotto, P., Dadalt, L., Durigan,
G., Ganade, G., Gossner, M. M., Guadagnin, D. L., Lorenzen, K., Jacobi,
C. M., Weisser, W. W., Pillar, V. D., 2015. Conservation in brazil needs to
include non-forest ecosystems. Diversity and Distributions 21, 1455–1460.
[15] Picoli, M., Camara, G., Sanches, I., Simoes, R., Carvalho, A., Maciel, A.,
Coutinho, A., Esquerdo, J., Antunes, J., Begotti, R., Arvor, D., Almeida,
C., 2018. Big earth observation time series analysis for monitoring brazilian
agriculture. ISPRS Journal of Photogrammetry and Remote Sensing 145,
328 – 339.
[16] Rajão, R., Soares-Filho, B., 2015. Policies undermine brazil’s ghc goals.
Science 350, 519–519.
[17] Silva, J. M. C., Bates, J. M., 2002. Biogeographic patterns and conservation
in the south american cerrado: A tropical savanna hotspot. Bioscience 52,
225–233.
[18] Strassburg, B. B. N., Brooks, T., Feltran-Barbieri, R., Iribarrem, A.,
Crouzeilles, R., Loyola, R., Latawiec, A. E., Oliveira Filho, F. J. B., Scara-
muzza, C. A. M., Scarano, F. R., Soares-Filho, B., Balmford, A., 2017.
Moment of truth for the cerrado hotspot. Nature Ecology Evolution 1,
1–3.
[19] Wiens, T. S., Dale, B. C., Boyce, M. S., Kershaw, G. P., 2008. Three way
k-fold cross-validation of resource selection functions. Ecological Modelling
212 (3), 244–255.
16You can also read