Modeling the spatial distribution of wood volume in a Cerrado Stricto Sensu remnant in Minas Gerais state, Brazil - IPEF
←
→
Page content transcription
If your browser does not render page correctly, please read the page content below
ORIGINAL ARTICLE
Modeling the spatial distribution of wood volume in
a Cerrado Stricto Sensu remnant in Minas Gerais
state, Brazil
Modelagem da distribuição espacial de volume de madeira em um
fragmento de Cerrado Stricto Sensu no estado de Minas Gerais, Brasil
Aliny Aparecida dos Reis1 , Juliana Maria Ferreira de Souza Diniz2 ,
Fausto Weimar Acerbi Júnior1 , José Marcio de Mello1 , Anderson Pedro Bernardina Batista3 ,
Antonio Carlos Ferraz Filho4
1
Universidade Federal de Lavras – UFLA, Lavras, MG, Brasil
2
Instituto Nacional de Pesquisas Espaciais – INPE, São José dos Campos, SP, Brasil
3
Instituto Federal do Amapá – IFAP, Laranjal do Jari, AP, Brasil
4
Universidade Federal do Piauí – UFPI, Bom Jesus, PI, Brasil
How to cite: Reis, A. A., Diniz, J. M. F. S., Acerbi Júnior, F. W., Mello, J. M., Batista, A. P. B., & Ferraz Filho, A. C. (2020).
Modeling the spatial distribution of wood volume in a Cerrado Sensu Stricto remnant in Minas Gerais state, Brazil.
Scientia Forestalis, 48(125), e2844. https://doi.org/10.18671/scifor.v48n125.15
Abstract
The Brazilian Savanna, the second largest biome in the country, has scarce information about its wood
volume production. Since our aim was to contribute to the better wood volume characterization in
Brazilian Savanna vegetation, we conducted a case study in a Cerrado Sensu Stricto remnant in Minas
Gerais state, Brazil, using different approaches and datasets to model the spatial distribution of wood
volume, including forest inventory data, remotely-sensed imagery, and geostatistical models. Wood
volume data were obtained from a forest inventory carried out in the field. Spectral data were collected
from a Landsat 5 TM satellite image, composed of spectral bands and vegetation indices. Ordinary
kriging, multiple linear regression analysis, and regression kriging methods were used for wood volume
estimation. Ordinary kriging resulted in estimates closer to each other in non-sampled areas (less
variability) than the other methods for not considering information from these areas in the
interpolation process. As multiple linear regression and regression kriging take into account the
spectral data from remotely-sensed images, these methods provide higher discrimination potential for
wood volume estimate mapping when vegetation presents high spatial heterogeneity, as in the Cerrado
Sensu Stricto. Integration between field data, remotely-sensed imagery and geostatistical models
provides a potential approach to spatially estimate wood volume in native vegetation.
Keywords: Geostatistical models; Landsat 5 TM imagery; Multiple linear regression; Regression kriging;
Brazilian Savanna.
Resumo
O Cerrado, segundo maior bioma brasileiro, possui escassas informações sobre a sua produção
volumétrica. Assim, visando contribuir com a caracterização volumétrica do Cerrado, esse estudo foi
realizado em um fragmento de Cerrado Sensu Stricto localizado em Minas Gerais, Brasil, usando
diferentes abordagens e fontes de dados na modelagem da distribuição espacial do volume de
madeira, incluindo dados do inventário florestal, imagens de sensoriamento remoto, e modelos
geoestatísticos. Os dados volumétricos foram obtidos a partir do inventário florestal. Os dados
espectrais foram coletados em uma imagem Landsat 5 TM, e compostos por informações de bandas
espectrais e índices de vegetação. Foram utilizados os métodos de krigagem ordinária, regressão linear
Financial support: None.
Conflict of interest: Nothing to declare.
Corresponding author: alinyreis@hotmail.com
Received: 2 April 2018.
Accepted: 7 June 2019.
Editor: Francides Gomes da Silva Júnior.
This is an Open Access article distributed under the terms of the Creative Commons Attribution License, which permits unrestricted use,
distribution, and reproduction in any medium, provided the original work is properly cited.
Scientia Forestalis, 48(125), e2844, 2020 | https://doi.org/10.18671/scifor.v48n125.15 1/13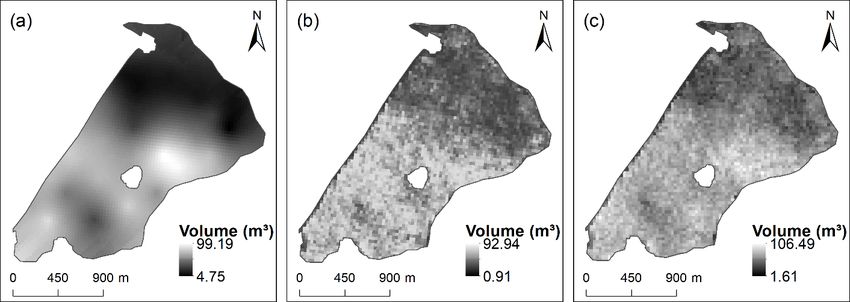
Modeling the spatial distribution of wood volume in a Cerrado Sensu Stricto remnant in Minas Gerais state, Brazil

                                múltipla e krigagem com regressão para a estimativa volumétrica. A krigagem ordinária resultou em
                                estimativas mais próximas umas das outras em áreas não amostradas (menor variabilidade) do que os
                                outros métodos por não considerar informações dessas áreas no processo de interpolação. Por outro
                                lado, a regressão linear múltipla e a krigagem com regressão consideram dados espectrais das imagens
                                de sensoriamento remoto que proporcionam maior potencial de discriminação durante o mapeamento
                                volumétrico em casos onde a vegetação apresenta alta variabilidade espacial, como o Cerrado
                                Sensu Stricto. A integração de dados de campo, imagens de sensoriamento remoto e modelos
                                geoestatísticos fornecem uma abordagem potencial para a estimativa volumétrica em fragmentos de
                                vegetação nativa.
                                Palavras-chave: Modelos geoestatísticos; Imagens Landsat 5 TM; Regressão linear múltipla; Krigagem
                                com regressão; Cerrado.

                                INTRODUCTION
                                     The Brazilian Savanna, the second largest biome in the country, occupies two million
                                square kilometers, which represents 21% of the Brazilian territory. Information about wood
                                volume in Savanna regions are scarce, mainly due to its broad extension, the spatial
                                heterogeneity of this biome and its intense degradation (Rezende et al., 2006; Miguel et al.,
                                2015). Thus, the accurate determination of wood volume is of utmost importance for the
                                definition of strategies for sustainable management of the Savanna biome (Alvarenga et al.,
                                2012; Haddad et al., 2014). In addition, this information is fundamental to define possible
                                preservation area locations and to contribute with environmental policy making in Minas
                                Gerais state and other areas with similar vegetation patterns.
                                     Traditional methods of wood volume assessment based on field measurements are the
                                most accurate; however, field-based forest inventory measurements are expensive, time
                                consuming and labor intensive. In the case of Savanna vegetation, wood volume
                                homogeneity is unlikely, since, added to the natural variability of vegetation from different
                                soil and topography conditions, human actions over the years have created a new
                                heterogeneous structure for this vegetation (Rezende et al., 2006). Hence, it is necessary to
                                seek alternatives to supplement field-based estimates at low additional cost, in order to have
                                good estimates of wood volume in Savanna remnants.
                                     In the past two decades, remotely-sensed imagery has become an alternative for wood
                                volume estimation in natural vegetation. Many studies have used multispectral imagery to fill
                                the information gap left by data collected only in the field with spatially-explicit information
                                of forest attributes (Meng et al., 2009; Viana et al., 2012; Almeida et al., 2014; Ponzoni et al.,
                                2015). Spectral data can be associated with data obtained from the field measurements,
                                allowing the application of methods such as linear regression, nearest neighbour, and neural
                                networks (Palmer et al., 2009; Castillo-Santiago et al., 2010; Gómez et al., 2012; Miguel et al.,
                                2015).
                                     Along with these methods, geostatistical techniques have been used to explore the
                                structure of spatial variation in natural vegetation by mapping areas of environmental concern
                                and developing site-specific forest attribute maps (Sales et al., 2007; Destan et al., 2013). Some
                                studies have combined spatial models with remotely-sensed data to improve geostatistical
                                estimates using spectral indices as secondary variables on techniques such as co-kriging, kriging
                                with external drift and regression kriging (Viana et al., 2012; Castillo-Santiago et al., 2013;
                                Galeana-Pizaña et al., 2014; Scolforo et al., 2015).
                                     Since our aim was to contribute to the better characterization of wood volume in the
                                Brazilian Savanna vegetation, we conducted a case of study in a Cerrado Sensu Stricto
                                remnant in Minas Gerais state, Brazil, using different approaches and datasets to model the
                                spatial distribution of wood volume, including forest inventory data, remotely-sensed
                                imagery, and geostatistical models.

Scientia Forestalis, 48(125), e2844, 2020                                                                                       2/13
Modeling the spatial distribution of wood volume in a Cerrado Sensu Stricto remnant in Minas Gerais state, Brazil
MATERIAL AND METHODS
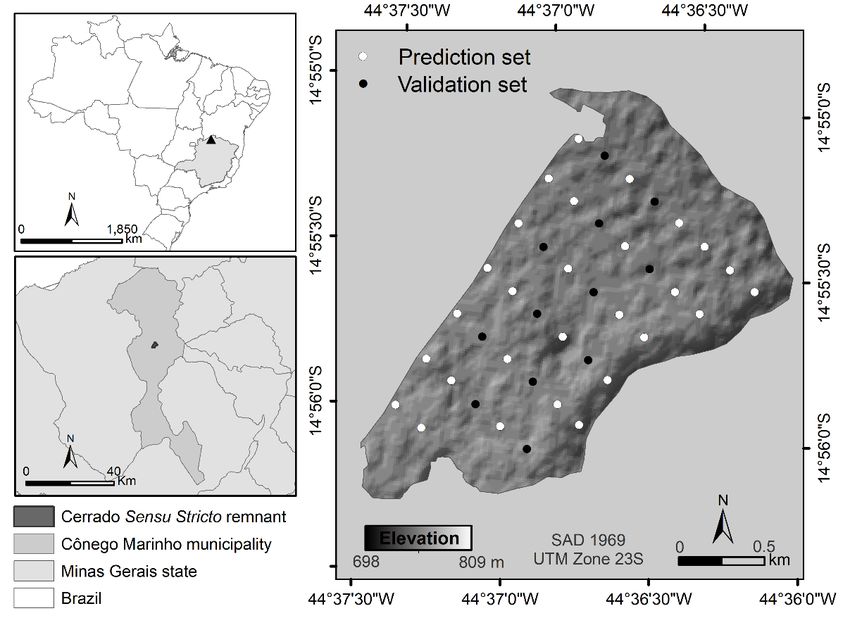
This study was developed in a 293.5 ha remnant of Cerrado Sensu Stricto in Cônego Marinho
municipality, northern Minas Gerais state, Brazil (Figure 1). The Cerrado Sensu Stricto is
characterized by vegetation dominated by trees and shrubs often 3-8 m tall with more than 30%
crown cover but with still a continuous grass layer (Oliveira-Filho & Ratter, 2002).
The region experiences tropical humid climatic conditions with dry winter,
corresponding to Köppen’s climatic type Aw, and an average annual rainfall of
1,022mm. This region is characterized by a strong seasonality with rainfall
concentrated from October to April, whereas in the dry season (May through
September), air humidity is very low and rainfall may be zero in some months. Mean
annual temperature and elevation are around 22.9 ºC and 723 meters above-mean-
sea-level, respectively.
Figure 1. Geographic location of the Cerrado Sensu Stricto remnant in Brazil and sampling grid.
Field data collection was performed in the months of July and August 2005, during
the forest inventory carried out by Scolforo et al. (2008). The forest inventory sampling
design was composed of 40 rectangular plots of 1000 m 2 (10 × 100 m) distributed
systematically and located in the field using survey-grade real time kinetic (RTK) GPS. In
these plots, all trees with the circumference at breast height (1.3 m) larger than 15.7
cm had their circumference measured using a metric tape and total height using a
telescopic pole, and were identified by botanical names (Scolforo et al., 2008).
Descriptive statistics of the variables collected in the field are shown in Table 1.
Estimates of wood volume (m 3 ha-1 ), basal area (m 2 ha-1 ), and mean tree height (m)
were obtained from the information collected in the plots. The total wood volume for
each tree in the plots was estimated applying the Equation 1 developed by Rufini et al.
(2010) for Cerrado Sensu Stricto vegetation.
V= e(-9.7289673246 + 2.4207715832 * ln(DBH) + 0.4608810281 * ln(H)) Eq. 1
R2 = 98.64% and Sxy = 0.12 m3
Scientia Forestalis, 48(125), e2844, 2020 3/13Modeling the spatial distribution of wood volume in a Cerrado Sensu Stricto remnant in Minas Gerais state, Brazil
where V is the wood volume (m 3 ); e is the base of the natural logarithm; ln is the
natural logarithm; DBH is the diameter measured at 1.30 meters above the ground
(cm); and H is the total tree height (m); R2 is the coefficient of determination; S xy is the
residual standard error.
Table 1. Descriptive statistics of the variables collected in the field.
Estimators Volume (m3 ha-1) Basal area (m2 ha-1) Mean tree height (m)
Min 3.26 0.97 3.50
Max 104.33 15.10 6.07
Mean 52.51 8.92 4.81
Standard deviation 28.85 4.10 0.64
Coefficient of variation (%) 54.94 45.95 13.30
Spectral data were obtained from a Landsat 5 TM satellite image, with spatial resolution of
30 m, on the date of passage of 8/10/2005, in the same month of data collection in the field, in
orbit 219, point 070, in bands TM1 (0.45 – 0.52 µm), TM2 (0.52 – 0.60 µm), TM3 (0.63 – 0.69 µm),
TM4 (0.76 – 0.90 µm) and TM5 (1.55 – 1.75 µm). The Landsat 5 TM image was obtained from
the USGS database (United States Geological Survey), already presenting radiometric
calibration and geometric and atmospheric corrections. In addition to the spectral bands, five
multispectral vegetation indices were employed to characterize the Cerrado Sensu Stricto
vegetation, including: NDVI (Normalized Difference Vegetation Index), EVI (Enhanced vegetation
Index), GEMI (Global Environment Monitoring Index), SAVI (Soil-Adjusted Vegetation Index), and
MSAVI (Modified Soil-Adjusted Vegetation Index).
From each plot centroid, a window size of 3 by 3 pixels was applied to extract the mean
values of each Landsat 5 TM spectral band and vegetation index. Thus, we ensured that each
plot matched with the pixel window in order to extract reliable data. Hence, each plot was
associated with the mean value of each spectral band and vegetation index, and the plot
dataset was composed of wood volume (m3 ha-1) data and values of spectral bands and
vegetation indices. The total dataset (40 plots) was divided into two sets: prediction or fitting
set (70% of the database) and validation set (30% of the database). Therefore, 28 plots were
used for wood volume predictions and 12 plots were used for validation of the different
approaches to estimate wood volume in Cerrado Sensu Stricto vegetation.
Pearson correlation analysis was carried out among wood volume, values of spectral
bands and vegetation indices. From these correlations, the relationship between Cerrado
Sensu Stricto wood volume and its spectral response in the Landsat 5 TM image was
explored. The definition of the spectral data that best estimated wood volume was
accomplished through multiple linear regression analysis (MLR). This analysis corresponds to
the first approach to wood volume estimation used in our study. Stepwise variable
elimination method was used in conjunction with the Akaike Information Criterion (AIC) to
select the spectral variables that most contributed to wood volume prediction. The residuals
from regression models were analyzed to assess the existence of trends in the errors.
The Variance Inflation Factor (VIF) test was carried out to examine possible correlations
among explanatory variables (multicolinearity). The VIF cut-off value adopted was 10.
We performed a variographic study in order to verify the structure of spatial variation of
the wood volume data as well as the regression residual data. The variographic study consisted
of three steps: the experimental semivariogram construction, fitting of theoretical functions to
experimental semivariogram models, and selection of the best model for data representation.
Thus, once the spatial dependence was verified in the data, we employed geostatistical
methods for wood volume estimation in the Cerrado Sensu Stricto remnant. Geostatistical
methods employed in our study were ordinary kriging (OK) and regression-kriging (RK), thus
completing the three approaches for wood volume estimation used in the study area.
Scientia Forestalis, 48(125), e2844, 2020 4/13Modeling the spatial distribution of wood volume in a Cerrado Sensu Stricto remnant in Minas Gerais state, Brazil
For ordinary kriging of wood volume and regression residual data, we considered the
stationarity assumptions of the intrinsic hypothesis (Journel & Huijbregts, 1978) by fitting the
theoretical functions to experimental semivariogram models (Equation 2).
1 N(h) 2
γ (h) = ∑ Z ( x i ) - Z ( x i +h ) Eq. 2
2N(h) i=1
where N(h) is the number of experimental observation pairs Z(xi) and Z(xi +h), separated by a
distance vector h; and xi is the spatial position of the Z variable.
Spherical, Exponential, and Gaussian models were fitted to the wood volume
semivariogram and to the regression residual semivariogram using the Weighted Least
Squares method. The performance assessment of each semivariogram model and the
selection of the best models were based on cross-validation (Yamamoto & Landim, 2012),
which estimates the reduced average error (RAE) (Equation 3) and the standard deviation of
the reduced average error (SRE) (Equation 4).
(x )
1 n Z ( x i0 ) - Z i0
RAE= ∑ Eq. 3
n i=1 σ ( x i0 )
2
(x )
1 n Z ( x i0 ) - Z i0
SRE =
∑ Eq. 4
n i=1 σ ( x i0 )
where Z(xi0) is the observed value in point i0; Z ( x i0 ) is the estimated value in the point i0;
and σ(xi0) is the kriging standard deviation in the point i0.
Ordinary Kriging is a geostatistical interpolation that provides values of interpolated
variables at places not measured, without bias, and with minimum and known variance,
taking into account the structure of spatial variation of the data, as described by
Journel & Huijbregts (1978). Ordinary kriging estimator is given by the Equation 5.
n
Ẑx0 =λ
∑ i Zxi Eq. 5
i=1
where Ẑx0 is the value to be interpolated at location x0; n is the number of sampling points in the
kriging neighborhood; λi is the ith weight assigned to each ith observation of the variable of interest
in the position x, Zxi, where these weights were calculated by the kriging system, which in turn is
defined by the fitted theoretical semivariogram (Journel & Huijbregts, 1978).
Regression kriging is a hybrid method that includes the combination of a simple or
multiple linear regression between the main and ancillary variables with ordinary kriging of
the regression residuals (Palmer et al., 2009; Viana et al., 2012). The regression model
captures the average behavior of the main variable, allowing the identification of the general
spatial behavior of the main variable, without detailing more specific areas or regions
(Mello et al., 2013). For details of specific regions, estimates obtained exclusively from the
ancillary variables need to be corrected. Thus, the ordinary kriging of the regression
residuals were used to correct the trends in the wood volume predictions and for detailing of
the spatial behavior of the main variable (Scolforo et al., 2015).
The selected regression model for wood volume estimation from spectral data obtained
from the Landsat 5 TM image in the MLR approach was used to wood volume
Scientia Forestalis, 48(125), e2844, 2020 5/13Modeling the spatial distribution of wood volume in a Cerrado Sensu Stricto remnant in Minas Gerais state, Brazil
characterization (main variable) in the study area. Then ordinary kriging of the regression
residuals was carried out (Eq. 5). The interpolated values of the regression residuals were
then added to the regression model estimates, thereby obtaining the wood volume
predictions by the regression kriging method.
The different approaches to wood volume prediction were evaluated through the
discrepancies between the known data and the predicted data in the prediction and
validation sets. These discrepancies were evaluated using the mean error (ME), the mean
absolute error (MAE), and the root mean square error (RMSE), which measures the accuracy
of predictions, as described in Equations 6-8.
1 N
ME = ∑ (Xi - Xˆ i ) Eq. 6
N i=1
1 N
MAE= ∑ Xi - X̂i Eq. 7
N i=1
1 N
∑ (Xi - Xˆ i )
2
RMSE= Eq. 8
N i=1
where N is the number of values in the dataset; X̂i is the estimated volume; Xi is the
observed value in the prediction and validation sets.
In addition, Pearson correlation analysis was carried out among the maps of predicted
wood volume values. The softwares R (R Core Team, 2018) with the geoR package (Ribeiro
Júnior & Diggle, 2001) and ArcGis version 10.1 (Environmental Systems Research Institute,
2010) with Geostatystical Analyst extension (Environmental Systems Research Institute,
2010) were used for the analysis.
RESULTS AND DISCUSSION
The high coefficient of variation (> 50%) and the difference between minimum and
maximum wood volume values, measured during the field work, indicates that the Cerrado
Sensu Stricto remnant in study displays a high heterogeneity in its wood volume (Table 1).
Alvarenga et al. (2012) studied a Cerrado Sensu Stricto remnant located in São Romão
municipality, MG, and found a coefficient of variation equal to 72.2%. In our study the
coefficient of variation was 54.9%, which confirms the high degree of wood volume variation
of the Cerrado Sensu Stricto vegetation.
The correlation between plot wood volume and the different spectral bands and vegetation
indices (Table 2) ranged from -0.70 (TM4) to 0.17 (NDVI). The TM5 and SAVI and GEMI indices
were also reasonably well correlated with wood volume. Although the spectral data examined
had several significant correlations with the wood volume data (Table 2), they contributed in a
reduced form to the regression models due to multicolinearity problems, which resulted in final
multiple linear regression model (Equation 9) with few significant explanatory variables.
WV =
446.94 − 1842.58 * TM2 − 729.64 * TM5 − 727.98 * EVI Eq. 9
R 2aj = 53.45% and Sxy = 19.31 m3 ha −1
where WV is the wood volume (m3 ha-1); TM2 is the spectral band TM2; TM5 is the spectral
band TM5; and EVI is the Enhanced Vegetation Index.
Scientia Forestalis, 48(125), e2844, 2020 6/13Modeling the spatial distribution of wood volume in a Cerrado Sensu Stricto remnant in Minas Gerais state, Brazil
Table 2. Pearson's correlation coefficient (r) between wood volume of Cerrado Sensu Stricto vegetation
and Landsat 5 TM spectral data.
Variable WV TM1 TM2 TM3 TM4 TM5 NDVI GEMI EVI SAVI MSAVI
WV 1.00
TM1 -0.24ns 1.00
TM2 -0.53* 0.61* 1.00
Table 2. Continued…
TM3 -0.32ns 0.54* 0.91* 1.00
TM4 -0.70* 0.37ns 0.71* 0.52* 1.00
TM5 -0.53* 0.70* 0.77* 0.68* 0.51* 1.00
NDVI 0.17ns -0.50* -0.80* -0.96* -0.29ns -0.62* 1.00
GEMI -0.65* 0.15ns 0.36ns 0.09ns 0.90* 0.25ns 0.15ns 1.00
EVI -0.38* -0.37ns -0.32ns -0.58* 0.39* -0.31ns 0.76* 0.74ns 1.00
SAVI -0.41* -0.15ns -0.15ns -0.44* 0.54* -0.13ns 0.65* 0.85ns 0.97* 1.00
MSAVI -0.16ns -0.34ns -0.49* -0.74* 0.18 ns -0.39* 0.89* 0.59ns 0.96* 0.93* 1.00
Where: WV = wood volume (m3 ha-1); TM= Thematic Mapper; NDVI= Normalized Difference Vegetation Index;
EVI= Enhanced vegetation Index; GEMI= Global Environment Monitoring Index; SAVI= Soil-Adjusted Vegetation Index;
MSAVI = Modified Soil-Adjusted Vegetation Index; ns= not significant at 5% and *significant at 5%.
TM4 band was the spectral variable that showed the best correlation coefficient with
volume (r = -0.70), and therefore, the most likely variable to contribute to the regression model.
However, this variable also showed high correlation coefficients with other spectral variables
(Table 2) and high VIF values in the regression models tested (VIF >20). Multicolinearity
problems in the fitted models may be generated when two or more independent variables are
highly correlated, since one of the regression assumptions is that no linear relationship may
exist between any independent variables (Montgomery et al., 2006). Thus, the best equation
for wood volume estimation was obtained from TM2 and TM5 bands, and EVI index.
The Variance Inflation Factor test showed no occurrence of multicolinearity among the
selected explanatory variables (VIFModeling the spatial distribution of wood volume in a Cerrado Sensu Stricto remnant in Minas Gerais state, Brazil
distortions caused by particulate matter suspended in the air, as well as by the influence of
background data under the vegetation canopy. Thus, the greater the reflectance in TM2 and
TM5 bands, and the greater the EVI index values, the lower the vegetation volume of Cerrado
Sensu Stricto remnant under study.
Almeida et al. (2014) fitted models to wood volume estimation in the Brazilian Caatinga
using Landsat 5 TM images. The best model found by these authors was obtained using
NDVI and SAVI indices and TM3 band. This model showed a similar performance (R2=60%
and Sxy=37.8%) when compared with the best model in our study. Miguel et al. (2015)
estimated the volume of Wooded Savanna using basal area data and vegetation indices (EVI,
NDVI, SAVI, and SR) derived from images of LISS-III sensor with low estimate errors
(Sxy=9.7%). The LISS-III sensor is an optical sensor operating in four spectral bands (green -
0.52 to 0.59 µm, red - 0.62 to 0.68 µm, near infrared - 0.77 to 0.86 µm, and mid-infrared -
1.55 to 1.70 µm), and with a spatial resolution of 23.5 m. The authors reported that the low
estimate errors were related with both the high sampling intensity used (18% of the total
area was sampled) and the spatial and spectral resolution characteristics of the LISS-III
sensor. Additionally, field data (i.e., basal area) were used to compose the wood volume
models, and not only spectral data as in our study.
Figure 2. Scatter plots of the regression residuals and the estimated wood volume (a); and measured
wood volume versus estimated wood volume (b). A 1:1 line (black, dashed) is provided for reference.
The experimental semivariograms, obtained from wood volume and regression residual
data, showed a clear spatial dependence (Figure 3). While volume values presented a strong
spatial dependence (low nugget effect and a lengthy range), the regression residuals showed
a low spatial correlation (Figure 3). The residuals presented a high nugget effect, which in
ideal circumstances should be zero, indicating that there is a significant amount of variation
in the residual data not explained by the semivariogram model (Yamamoto & Landim, 2012).
This may result in inaccuracies in the regression kriging estimation process. The exponential
model showed the best fit to the regression residuals, while the spherical model was the
best fitted model to the wood volume data. The exponential model also showed the best
performance in the regression kriging method, and the smallest errors in the residual
estimates in the studies of Castillo-Santiago et al. (2013), Galeana-Pizaña et al. (2014), and
Scolforo et al. (2015).
Scientia Forestalis, 48(125), e2844, 2020 8/13Modeling the spatial distribution of wood volume in a Cerrado Sensu Stricto remnant in Minas Gerais state, Brazil
Figure 3. Experimental semivariogram for wood volume (a) and regression residuals (b).
The evaluation of spatial prediction methods, based on prediction and validation sets, was
done by comparing the statistics presented in Table 3. Prediction and validation sets were
compared by means of Student's t test, in order to check if they provided unbiased subsets of the
original data (Viana et al., 2012). The average wood volume obtained from the prediction set
(55.67 m3 ha-1) did not statistically differ from average wood volume obtained from the validation
set (51.16 m3 ha-1), considering two tailed Student's t test (t= -0.448; df= 38; p-value= 0.656ns).
The mean error (ME), which should ideally be close to zero if the prediction method is
unbiased, suggests that all predictions generate impartial estimates when evaluated from
the prediction set. Nevertheless, when the ME is obtained from the validation set, the MLR
method showed less tendency of wood volume underestimation. The MAE and RMSE results
obtained from the prediction set indicate that OK had the best performance in predicting
wood volume, whereas MLR resulted in the worst performance. However, MAE and RMSE
results obtained from the validation set demonstrate that there were no significant
differences among the OK, MLR, and RK methods.
Considering the validation set, the best wood volume estimates resulted in a RMSE = 36.2%
of the mean (55.7 m3 ha-1) for OK method, and a very similar result for the MLR method, with a
RMSE = 36.4% of the mean (55.7 m3 ha-1) (Table 3).
Table 3. Wood volume estimation methods evaluated using the prediction and validation sets for the
Shrub Savanna remnant in Minas Gerais state, Brazil.
Error Wood volume estimation error (m3 ha-1)
Method
Statistics Prediction set Validation set
ME 0.025 8.521
Ordinary MAE 0.909 17.611
Kriging RMSE 1.281 20.172
RMSE (%) 2.50 36.23
ME -0.0003 3.071
Multiple
MAE 14.323 17.916
Linear
RMSE 17.885 20.276
Regression
RMSE (%) 34.96 36.42
ME -0.899 5.410
Regression
MAE 5.486 18.191
Kriging
RMSE 7.426 20.980
RMSE (%) 14.51 37.68
Where: ME = mean error; MAE = mean absolute error; RMSE = root mean square error.
Scientia Forestalis, 48(125), e2844, 2020 9/13Modeling the spatial distribution of wood volume in a Cerrado Sensu Stricto remnant in Minas Gerais state, Brazil
The wood volume estimates obtained by different methods (Table 4) had very similar
mean values to each other. This similarity can be observed in the wood volume spatial
distribution maps (Figure 4). All maps showed the same behavior in areas with high and low
volumes, regardless of the prediction method. OK resulted in estimates closer to each other
in non-sampled areas (less variability) than the other methods for not considering
information from these areas in the interpolation process. This method depends only on the
adjacent observations for mapping the target variable, and in situations where the number
of sample plots is sparse OK does not provide detailed information on non-sampled regions
(Palmer et al., 2009).
The MLR and RK methods take into account the spectral data extracted from remotely-sensed
imagery. Consequently, these methods provide better discrimination potential for wood volume
mapping than OK when the native vegetation presents high spatial heterogeneity, as Cerrado Sensu
Stricto vegetation. MLR provides as advantages over OK estimates independent of the distance
between observations, once MLR estimates depend only on the linear correlation between the
dependent and independent variables (Meng et al., 2009). The RK has as advantage the ability to
use both spatial (ordinary kriging of the regression residuals) and no spatial information (regression
model). Thus, the MLR and RK methods can be exploited when field sampling are limited.
Remotely-sensed imagery is the most effective way to obtain information on non-sampled areas
and to provide spatially distributed information of the landscape structure (Ponzoni et al., 2012) of
intermediate areas between field measurements. As a result, MLR and RK methods are a suitable
way to map wood volume in native vegetation using remotely-sensed data as ancillary information.
Table 4. Statistics of wood volume maps estimated by ordinary kriging (OK), multiple linear regression
analysis (MLR), and regression kriging (RK).
Volume
Statistics
OK MLR RK
Mean (m3 ha-1) 48.91 48.87 48.63
Minimum (m3 ha-1) 4.75 0.91 1.61
Maximum (m3 ha-1) 99.19 92.94 106.49
Standard deviation (m3 ha-1) 24.14 17.24 20.48
Total volume (m3) 14134.37 14124.23 14053.21
Where: OK = ordinary kriging; MLR = multiple linear regression analysis; RK = regression kriging.
Figure 4. Spatial distribution of wood volume in a Cerrado Sensu Stricto remnant located in Minas Gerais state,
Brazil, estimated by ordinary kriging (a), multiple linear regression (b), and regression kriging (c).
The average wood volume estimated in our study for the Cerrado Sensu Stricto remnant
is smaller than the ones reported by Alvarenga at el. (2012) and Silva et al. (2014).
Alvarenga et al. (2012) found an average volume of 33.2 m3 ha-1 studying a Cerrado Sensu
Stricto remnant near São Romão municipality, Minas Gerais, Brazil. In another Brazilian
study, Silva et al. (2014) found an average wood volume of 101.3 m3 ha-1 for Cerrado Sensu
Stricto vegetation, higher than the values found in the present study and by Alvarenga et al.
Scientia Forestalis, 48(125), e2844, 2020 10/13Modeling the spatial distribution of wood volume in a Cerrado Sensu Stricto remnant in Minas Gerais state, Brazil
(2012). Scolforo et al. (2008) studied 57 Cerrado Sensu Stricto remnants while performing the
Forest Inventory of Minas Gerais state, and reported that the wood volume of Cerrado Sensu
Stricto vegetation has a high variation within the same remnant and among remnants. These
authors found averages of wood volume ranging from 15.9 m3 ha-1 to 107.2 m3 ha-1. This
variation can be explained by differences in the numbers of trees per hectare occurring in
the Cerrado Sensu Stricto remnants, which can range from 407 to 2316 trees per hectare
(Scolforo et al., 2008).
The high variability of Cerrado Sensu Stricto vegetation reinforces the importance of
using methods that consider the spatial variation of wood volume in the mapping process,
such as MLR and RK. These methods use information obtained from remotely-sensed
imagery as the basis for estimating wood volume and, for that reason, resulted in a better
spatial characterization of wood volume than OK. According to Haddad et al. (2014),
information about spatial variation of wood volume in Cerrado Sensu Stricto remnants is
fundamental in environmental regulation process, and a major challenge for environmental
projects aimed at sustainable exploitation of Savanna regions. Additionally, natural
ecosystems provide a number of benefits to humanity, as providing services, meaning the
goods that can be harvested such as food, timber, fodder, water provision, besides carbon
sequestration and storage (Paletto et al., 2015), where in the last one, wood volume mapping
is essential for generation of carbon credits in the Clean Development Mechanism projects.
Considering the cost of improving accuracy of wood volume estimates by increasing
field measurements in Cerrado Sensu Stricto vegetation, it seems sensible to encourage
further studies that focus on more test sites and a wide range of sensor systems (particularly
high spatial resolution sensors, including RADAR and LiDAR). Further studies could also
investigate whether other prediction methods, such as nonlinear regression, machine
learning algorithms, or Partial least squares regression (PLSR) approaches can improve wood
volume estimation in Cerrado Sensu Stricto vegetation. The integration of additional
predictors (e.g., topographic information or climate variables) would be a further possible
extension of our work. The modeling approaches used in our study provide a framework for
integrating field and multispectral data, highlighting methods that greatly improve the
spatial prediction of wood volume in Cerrado Sensu Stricto remnants. Although the sensor
TM of Landsat satellites is no longer operational, the concepts presented in our study are
expected to be consistent regardless of the sensor. Thus, the approach used in our study can
be more broadly applied to wood volume estimation in Cerrado Sensu Stricto vegetation
using the new optical sensors such as Landsat 8 OLI and Sentinel-2 MSI.
CONCLUSIONS
Integration between forest inventory data, remotely-sensed imagery, and geostatistical
models provides a potential approach to spatially estimate attributes of native vegetation, as
wood volume. Overall OK, MLR, and RK methods had similar performance rankings and
provided similar prediction errors in our study. The OK, MLR, and RK methods generated
similar mean volume estimates (48.91 m3 ha-1, 48.87 m3 ha-1, and 48.63 m3 ha-1, respectively)
for the Cerrado Sensu Stricto remnant located in Minas Gerais state, Brazil.
From a visual perspective, the OK method is reliant on adjacent observations for
mapping and therefore does not always provide local details available with MLR and RK
methods. As a result, OK estimates in regions where field data are sparse and/or distant of
field samples produce maps that do not represent all of the local variation occurring in the
Cerrado Sensu Stricto vegetation. On the other hand, MLR and RK methods are able to
capture high local variation through the underlying surfaces obtained from Landsat images.
However, when native vegetation shows spatial heterogeneity, as in Cerrado Sensu Stricto
vegetation, the differences between spectral characteristics will increase, which will add
noise to the prediction models based on remotely-sensed data. So, one option to reduce
prediction model errors is to use stratification methods.
Scientia Forestalis, 48(125), e2844, 2020 11/13Modeling the spatial distribution of wood volume in a Cerrado Sensu Stricto remnant in Minas Gerais state, Brazil
Regardless of the prediction method applied (OK, MLR or RK), these methods are a
complement to the traditional field inventories, since field measurements are needed to
collect the input data required to model wood volume and to assess the spatial prediction
methods.
ACKNOWLEDGEMENTS
The authors would like to thank CAPES (Finance Code 001) for the fellowships granted
to A. A. dos Reis, J. M. F. S. Diniz, and A. P. B. Batista.
REFERENCES
Almeida, A. Q., Mello, A. A., Dória Neto, A. L., & Ferraz, R. C. (2014). Relações empíricas entre
características dendrométricas da Caatinga brasileira e dados TM Landsat 5. Pesquisa Agropecuária
Brasileira, 49(4), 306-315.
Alvarenga, L. H. V., Mello, J. M., Guedes, I. C. L., & Scolforo, J. R. S. (2012). Desempenho da estratificação
em um fragmento de cerrado stricto sensu utilizando interpolador geoestatístico. Cerne, 18(4), 675-
681.
Castillo-Santiago, M. A., Ghilardi, A., Oyama, K., Hernández-Stefanoni, J. L., Torres, I., Flamenco-Sandoval,
A., Fernández, A., & Mas, J. F. (2013). Estimating the spatial distribution of woody biomass suitable
for charcoal making from remote sensing and geostatistics in central Mexico. Energy for Sustainable
Development, 17(2), 177-188.
Castillo-Santiago, M. A., Ricker, M., & De Jong, B. H. J. (2010). Estimation of tropical forest structure from
SPOT-5 satellite images. International Journal of Remote Sensing, 31(10), 2767-2782.
Destan, S., Yilmaz, O. Y., & Sahin, A. (2013). Making objective forest stand maps of mixed managed
forest with spatial interpolation and multi-criteria decision analysis. IForest, 6, 268-277.
Environmental Systems Research Institute – ESRI. (2010). ArcGIS desktop: release 10.1. Redlands: ESRI.
Galeana-Pizaña, J. M., López-Caloca, A., López-Quiroza, P., Silván-Cárdenasa, J. L., & Couturier, S. (2014).
Modeling the spatial distribution of above-ground carbon in Mexican coniferous forests using
remote sensing and a geostatistical approach. International Journal of Applied Earth Observation and
Geoinformation, 30, 179-189.
Gómez, C., Wulder, M., Montes, F., & Delgado, J. A. (2012). Modeling forest structural parameters in the
Mediterranean pines of Central Spain using QuickBird-2 imagery and Classification and Regression
Tree Analysis (CART). Remote Sensing, 4(1), 135-159.
Haddad, H. M. D., Gomide, L. R., Cruz, B. R., & Silva, S. T. (2014). An integer linear programming
approach applied to the Cerrado (Savanna) management. Floresta, 44(1), 1-10.
Journel, A. G., & Huijbregts, C. J. (1978). Mining geostatistics. London: Academic.
Mello, C. R., Viola, M. R., Beskow, S., & Norton, L. D. (2013). Multivariate models for annual rainfall
erosivity in Brazil. Geoderma, 202-203, 88-102.
Meng, Q., Cieszewski, C., & Madden, M. (2009). Large area forest inventory using Landsat ETM+: a
geostatistical approach. ISPRS Journal of Photogrammetry and Remote Sensing, 64(1), 27-36.
Miguel, E. P., Rezende, A. V., Leal, F. A., Matricardi, E. A. T., Vale, A. T., & Pereira, R. S. (2015). Redes
neurais artificiais para a modelagem do volume de madeira e biomassa do cerradão com dados de
satélite. Pesquisa Agropecuária Brasileira, 50(9), 829-839.
Montgomery, D. C., Peck, E. A., & Vining, G. G. (2006). Introduction to linear regression analysis. New York:
Wiley.
Oliveira-Filho, A. T., & Ratter, J. A. (2002). Vegetation physiognomies and woody flora of the Cerrado
biome. In: P. S. Oliveira, & R. J. Marquis (Eds.), The Cerrados of Brazil: ecology and natural history of a
Neotropical Savanna (pp. 91-120). New York: Columbia University Press.
Paletto, A., Geitner, C., Grilli, G., Hastik, R., Pastorella, F., & Rodrìguez Garcìa, L. (2015). Mapping the
value of ecosystem services: a case study from the Austrian Alps. Annals of Forest Research, 58(1),
157-175.
Palmer, D. J., Höck, B. K., Kimberley, M. O., Watt, M. S., Lowe, D. J., & Payn, T. W. (2009). Comparison of
spatial prediction techniques for developing Pinus radiata productivity surfaces across New
Zealand. Forest Ecology and Management, 258(9), 2046-2055.
Scientia Forestalis, 48(125), e2844, 2020 12/13Modeling the spatial distribution of wood volume in a Cerrado Sensu Stricto remnant in Minas Gerais state, Brazil
Ponzoni, F. J., Pacheco, L. R. F., Santos, S. B., & Andrades Filho, C. O. (2015). Caracterização espectro-
temporal de dosséis de Eucalyptus spp. mediante dados radiométricos TM/Landsat 5. Cerne, 21(2),
267-275.
Ponzoni, F. J., Shimabukuro, Y. E., & Kuplich, T. M. (2012). Sensoriamento remoto no estudo da vegetação
(2. ed.). São Paulo: Oficina de Textos.
R Core Team. (2018). R: a language and environment for statistical computing. Vienna: R Foundation for
Statistical Computing.
Rezende, A. V., Vale, A. T., Sanquetta, C. R., Figueiredo-Filho, A., & Felfili, J. M. (2006). Comparação de
modelos matemáticos para estimativa do volume, biomassa e estoque de carbono da vegetação
lenhosa de um cerrado sensu stricto em Brasília, DF. Scientia Forestalis, 71, 65-76.
Ribeiro Júnior, P. J., & Diggle, P. J. (2001). GeoR: a package for geostatistical analysis. R News, 1, 15-18.
Rufini, A. L., Scolforo, J. R. S., Oliveira, A. D., & Mello, J. M. (2010). Equações volumétricas para o cerrado
sensu stricto em Minas Gerais. Cerne, 16(1), 1-11.
Sales, M. H., Souza Junior, C. M., Kyriakidis, P. C., Roberts, D. A., & Vidal, E. (2007). Improving spatial
distribution estimation of forest biomass with geostatistics: a case study for Rondonia, Brazil.
Ecological Modelling, 205(1-2), 221-230.
Scolforo, H. F., Scolforo, J. R. S., Mello, C. R., Mello, J. M., & Ferraz Filho, A. C. (2015). Spatial distribution of
aboveground carbon stock of the arboreal vegetation in Brazilian biomes of Savanna, Atlantic forest
and Semi-arid Woodland. PLoS One, 10(6), 1-20. PMid:26066508.
Scolforo, J. R. S., Mello, J. M., & Oliveira, A. D. (2008). Inventário florestal de Minas Gerais: Cerrado, florística,
diversidade, similaridade, distribuição diamétrica e de altura, volumetria, tendências de crescimento e
áreas aptas para manejo florestal. Lavras: UFLA.
Silva, S. T., Mello, J. M., Acerbi Júnior, F. W., Reis, A. A., Raimundo, M. R., Silva, I. L. G., & Scolforo, J. R. S.
(2014). Uso de imagens de sensoriamento remoto para estratificação do cerrado em inventários
florestais. Pesquisa Florestal Brasileira, 34(80), 337-343.
Viana, H., Aranha, J., Lopes, D., & Cohen, W. B. (2012). Estimation of crown biomass of Pinus pinaster
stands and shrubland above-ground biomass using forest inventory data, remotely sensed imagery
and spatial prediction models. Ecological Modelling, 226, 22-35.
Yamamoto, J. K., & Landim, P. M. B. (2012). Geoestatística: conceitos e aplicações. São Paulo: Oficina de
Textos.
Author contributions: AAR: conceptualization, formal analysis, methodology, writing; JMFSD and APBB: formal
analysis, writing; FWAJ, JMM and ACFF: conceptualization, methodology, writing, supervision.
Scientia Forestalis, 48(125), e2844, 2020 13/13You can also read