Does Habitat Diversity Modify the Dietary and Reproductive Response to Prey Fluctuations in a Generalist Raptor Predator, the Eurasian Buzzard ...
←
→
Page content transcription
If your browser does not render page correctly, please read the page content below
Article
Does Habitat Diversity Modify the Dietary and Reproductive
Response to Prey Fluctuations in a Generalist Raptor Predator,
the Eurasian Buzzard Buteo buteo?
Marek Panek

                                          Polish Hunting Association, Research Station, Sokolnicza 12, 64-020 Czempiń, Poland; m.panek@pzlow.pl

                                          Simple Summary: Specialist predators mainly hunt one type of prey while generalist predators have
                                          more varied food and change their diet composition depending on the availability of different prey
                                          groups. I tested the prediction that predators can show a shift in their food habits from a specialist to
                                          generalist pattern between simplified and diversified landscapes. The studies were carried out in
                                          western Poland in two structural types of agricultural habitat, i.e., in small and large fields. The diet
                                          of Eurasian Buzzard Buteo buteo nestlings and the number of young raised by these birds, as well as
                                          the abundance of their main prey species (common voles Microtus arvalis), were estimated over ten
                                          years. The abundance of common voles in crop fields changed between years. Consequently, the
                                          frequency of these voles in the diet of Eurasian Buzzard nestlings also changed and increased with
                                          vole abundance, and the frequency of some secondary prey groups (birds, moles, other voles, and
                                          reptiles) decreased in the years of high vole numbers. However, the course of these relationships did
                                          not significantly differ between the diversified habitat of small fields and the simplified habitat of
                                          large fields. Thus, no shift in Eurasian Buzzard food habits was found. Accordingly, the number of
                                Eurasian Buzzard fledglings increased with vole abundance, but there were no differences in this

                                          relationship between the two habitat types.
Citation: Panek, M. Does Habitat
Diversity Modify the Dietary and
                                          Abstract: Predators can modify their diet and demography in response to changes in food availability
Reproductive Response to Prey
                                          and habitat quality. I tested the prediction that some species can change their predation pattern,
Fluctuations in a Generalist Raptor
                                          between specialist type and generalist type, depending on the complexity of habitat structure. It was
Predator, the Eurasian Buzzard Buteo
buteo? Birds 2021, 2, 114–126.
                                          hypothesized that their dietary response is stronger in diversified habitats than in simplified ones,
https://doi.org/10.3390/birds2010008      but the opposite tendency occurs in the case of reproductive response. The nestling diet and breeding
                                          success of the Eurasian Buzzard Buteo buteo, the abundance of its main prey (the common vole
Academic Editor: Jukka Jokimäki           Microtus arvalis), and that of the most important alternative prey group (passerines) were estimated
                                          over ten years in two types of agricultural habitat in western Poland, i.e., in the diversified habitat
Received: 12 December 2020                of small fields and the simplified habitat of large fields. The vole abundance was higher in large
Accepted: 20 February 2021                fields, but the abundance of passerines was greater in small fields. The frequency of voles in the
Published: 1 March 2021                   Eurasian Buzzard nestling diet was higher in large fields than in small fields and increased with the
                                          abundance of this prey in crop fields. However, no difference in the relationship between the vole
Publisher’s Note: MDPI stays neutral
                                          frequency in the diet of Eurasian Buzzards and the abundance of voles was found between the two
with regard to jurisdictional claims in
                                          habitat types. The breeding success of Eurasian Buzzards was dependent on the vole abundance, but
published maps and institutional affil-
                                          this relationship did not differ between the two field types. It seems that the pattern of dietary and
iations.
                                          reproductive response of Eurasian Buzzards depends on the actual availability of individual prey
                                          species, which can be modified by habitat quality, rather than on relative prey abundance.

                                          Keywords: Eurasian Buzzard; common vole; functional response; habitat diversity; population
Copyright: © 2021 by the author.
                                          fluctuations; reproductive parameters; temperate latitude
Licensee MDPI, Basel, Switzerland.
This article is an open access article
distributed under the terms and
conditions of the Creative Commons
Attribution (CC BY) license (https://
                                          1. Introduction
creativecommons.org/licenses/by/              Birds of prey can change their diet and demography as a result of fluctuations in the
4.0/).                                    abundance of prey species [1–6]. However, the pattern of these responses differs between

Birds 2021, 2, 114–126. https://doi.org/10.3390/birds2010008                                                  https://www.mdpi.com/journal/birds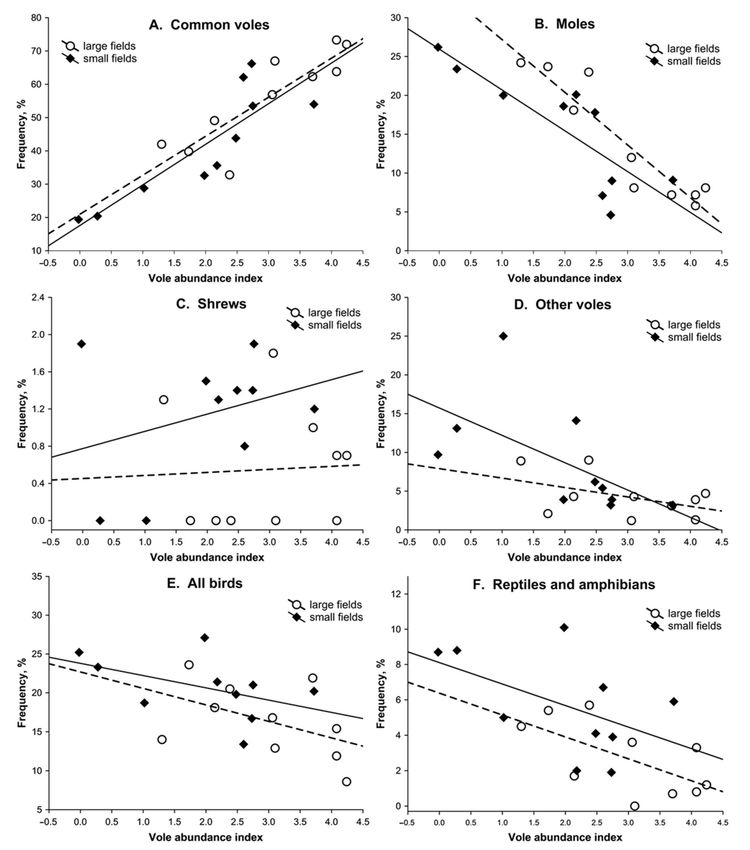
Birds 2021, 2                                                                                                  115

                species and taking this into account, the two basic types of predators are distinguished,
                i.e., specialists and generalists [7–9]. Specialist predators, like Gyrfalcons Falco rusticolus [3]
                or Snowy Owls Bubo scandiacus [6] mainly hunt one type of prey, regardless of changes
                in its abundance. Generalist predators, for example Hen Harriers Circus cyaneus and
                Peregrine Falcons Falco peregrinus, switch to alternative prey if their main prey becomes
                less numerous [4]. Therefore, the impact of predators on alternative prey depends more on
                the abundance of main prey than on the number of this alternative prey [10,11].
                       The foraging efficiency of specialist predators is relatively high when their main prey
                is abundant, but decreases when this prey becomes scarce, whereas the hunting success of
                generalist predators is not too high, but remains relatively stable irrespective of main prey
                abundance, as has been show in the case of the Pallid Harrier Circus macrourus and the
                Montagu’s Harrier Circus pygargus [12]. Consequently, the reproductive performance and
                numbers of specialist predators clearly change in response to fluctuations in their main
                prey abundance, while such a marked numerical response is typically not observed in
                generalists [7–9]. Responses consistent with these rules have been found, for example, in
                the species listed above, i.e., Gyrfalcons showed a delayed numerical response to changes
                in the density of Rock Ptarmigans Lagopus muta in north-east Iceland [3], but the breeding
                numbers of Peregrine Falcons did not significantly change with the abundance of Red
                Grouses Lagopus lagopus scotica in Scottish moors [4]. A specific group are specialist monadic
                avian predators that move to areas periodically abundant in their prey, so show rapid
                numerical responses without time lags [1,2].
                       The division of predators into the two classes mentioned above is not precise, be-
                cause they tend to form a specialist–generalist continuum. Moreover, some predators
                can change their habits from a specialist to generalist pattern depending on seasonal or
                regional conditions [13]. Such changes have been observed in some mammalian and avian
                predators. For example, the stoat Mustela erminea, being a specialist in the boreal zone of
                Fennoscandia and therefore responding mainly numerically to changes in the abundance
                of small rodents, in southern Finland behaves like a semi-generalist, i.e., during the years of
                the crash phase in its main prey this predator switches to alternative prey species [14]. Fur-
                thermore, the populations of red foxes Vulpes vulpes in northern Finland showed stronger
                responses to small rodent fluctuations than in the more southern part of this country [15].
                The Tengmalm’s Owl Aegolius funereus, being a nomadic microtine specialist in northern
                Fennoscandia, was found to be a resident generalist predator in central Europe [16]. The
                existence of these changes in the pattern of predation seems to be related to higher habitat
                diversity and richer resources of alternative prey species in the southern regions than in
                the boreal zone [9,17–20]. Hence, a hypothesis can be formulated that the described shift in
                the specialist–generalist predation continuum occurs not only on a geographical scale, but
                also on a local scale; for example, between simplified and diversified agricultural habitats
                in the temperate zone of Europe.
                       I tested this hypothesis on the example of a generalist raptor predator, the Eurasian
                Buzzard Buteo buteo. These raptors catch mostly Microtus voles, mainly common voles
                Microtus arvalis in the agricultural areas of central Europe and field voles Microtus agrestis
                in some other regions, but they also hunt a number of other prey groups, such as birds,
                moles, forest rodents, and reptiles, and in the periods of limited vole availability these
                predators switch to alternative prey, primarily to birds [21–26]. The common vole shows
                clear multiannual fluctuations in some areas in the temperate zone of Europe, and such
                fluctuations are observed on wide expanses of large scale farming rather than in diversified
                agricultural landscapes [27–30]. A clear numerical response of Eurasian Buzzards was
                found in western Finland, where both their nesting rate and young production rate were
                positively correlated with the abundance of voles [31]. However, in the temperate parts
                of Europe only changes in the reproductive success of these raptors were usually found,
                while the size of their breeding populations remained constant or at most changed slightly
                with fluctuations in food abundance [32].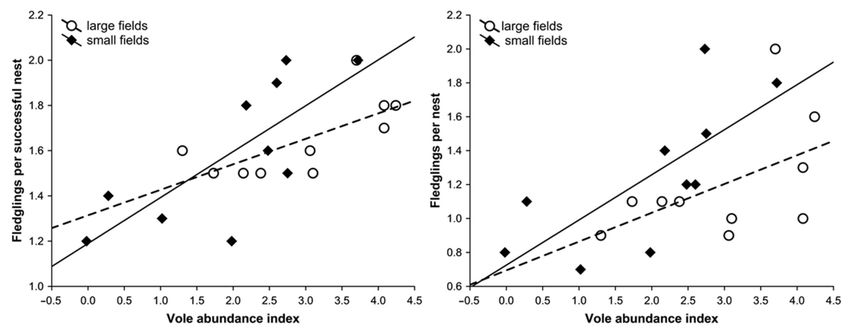
Birds 2021, 2 116
The following predictions were tested: (1) the alternative prey species (mainly small
passerine birds) are more numerous in the diverse agricultural habitat than in the simplified
agricultural habitat; (2) Eurasian Buzzards nesting in the diverse agricultural habitat show
a stronger dietary response to fluctuations in vole abundance than pairs nesting in the
simplified habitat; (3) the breeding success of Eurasian Buzzard pairs occurring in the
diverse agricultural habitat changes with vole fluctuations to a lesser extent than in the
case of pairs living in the simplified habitat.
2. Materials and Methods
2.1. Study Area
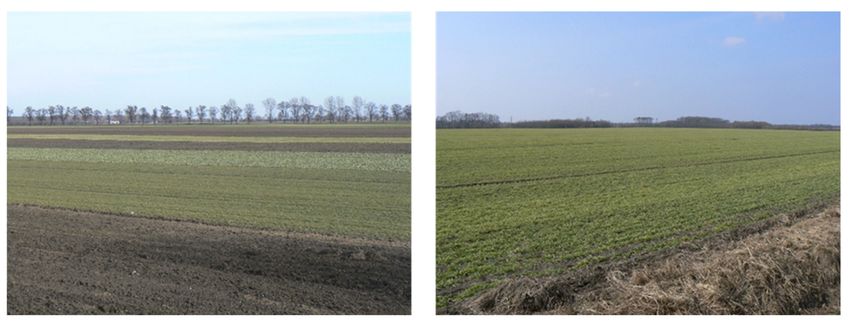
The study was carried out in an area of 75 km2 located in the vicinity of Czempiń
(52◦ 09’ N, 16◦ 45’ E), south of Poznań, in western Poland. This area contained mainly
agricultural land (85%), but with a dual character. There were two types of agricultural
landscapes, which differed in the size of crop fields—the landscape of small fields (typically
fromBirds 2021, 2 117
inspected once every half-month from late April/beginning of May to mid-July. During
observations carried out with binoculars from a distance of several dozen meters, initially
adult birds staying at the nests were watched (April–May), followed by the presence of
their offspring (mainly June). It was assumed that in a given nest a breeding attempt took
place if an adult Eurasian Buzzard sitting on the nest (i.e., probably incubating) was seen
at least once. A given breeding attempt was recognized as successful if at least one fully
feathered young Eurasian Buzzard was detected on the nest before the anticipated fledging
time. The number of fledglings was also determined at this stage of offspring development.
The breeding success was calculated as both the average number of fledglings per breeding
attempt and the average number of fledglings per successful breeding attempt. Only
nests with a single type of crop fields in their surroundings were taken into account
(more precisely, in a circle of 2.5 km2 , because this was the approximate area per one
nest calculated from the average density of Eurasian Buzzard breeding pairs in the study
area—see above). Therefore, several nests located near the border between the two habitat
types were excluded. Finally, I controlled 9–15 breeding attempts annually in small fields
and 10–17 attempts annually among large fields, and 256 in total.
During the visits to active Eurasian Buzzard nests conducted from the turn of May
and June to mid-July, pellets and prey remains found on the ground under the nests were
collected. This material was analyzed according to the generally accepted methodology
(e.g., [37]). The pellets were fragmented to separate the specific remains of eaten animals.
Taxonomic membership and the number of individuals were assessed on the basis of
distinctive hairs, feathers, teeth, bones, skin pieces, claws, and bills. However, it was not
necessary to determine accurately the species of all the prey items, because they were
classified into nine prey categories. They included: (1) moles, (2) shrews, (3) common voles,
(4) other voles (e.g., water voles and bank voles), (5) mice, (6) other mammals, (7) small
birds (passerines), (8) medium and large birds (e.g., pigeons and poultry), (9) reptiles and
amphibians. Small mammals were mainly distinguished on the basis of their skulls and
teeth [38]. The prey remains, which were not identified to the degree needed for direct
classification into one of the mentioned prey categories, were distributed to these categories
using the frequencies found for the adequately recognized prey items. For example, small
mammals described only as rodents were divided into the groups of voles and mice (in a
ratio of 16:1, because this was the proportion of identified voles and mice), and next voles
were in a similar way divided into common voles and other voles. The prey items identified
among the food remains collected under nests were added to the prey list if the same species
were not found in pellets from the same period. Insects were omitted during the analysis
of Eurasian Buzzard food, as they constitute a marginal part of biomass consumed by
these raptors [23,26]. The diet composition was presented as the percentage frequencies of
particular prey categories in relation to all prey individuals. In total, 1917 prey items were
identified in small fields and 1979 items in large fields.
The number of entrances to the burrows of common voles was used to describe the
abundance of this main Eurasian Buzzard prey [32]. Such a burrow index was found
to be correlated with the number of common voles in crop fields [39]. Every year, the
counts of entrances were carried out in March, after snow melting (if snow had fallen) and
soil thawing but before the start of crop vegetation and intensive agricultural works, on
permanent transect routes evenly distributed throughout the agricultural land. Six routes
of 4–7 km were established in each field type, totaling 31 km in small fields and 35 km
in large fields. Only the entrances with clear and fresh signs of use (digging, droppings,
pieces of food) located within 3 m of both sides of the transect routes (i.e., in a strip 6 m
wide) were recorded. The density of burrow entrances per hectare was calculated for each
transect route.
The abundance of small passerine birds (so, excluding corvids) was estimated using
the point census method [40], but slightly modified on the basis of preliminary research.
The counting points were located in the intersections of the topographic grid (1 × 1 km)
visible on the map of my study area, excluding those situated within villages, farms,Birds 2021, 2 118
and inaccessible places, e.g., in fenced areas. Thus, the distance between the counting
points was at least 1 km. Birds were counted every year in the second half of May from
22 permanent points in small fields and 23 such points in large fields. During morning
observations lasting 15 minutes, all the birds seen within a radius of 100 m were recorded
(usually flying or sitting above ground). Singing and other voices were used only as an
aid to the visual localization that usually followed. Efforts were made to avoid repeated
counting of the same individuals, i.e., they were watched all the time, if possible. However,
such repeated counting undoubtedly often happened, because each appearing bird was
registered separately when circumstances did not clearly indicate that this individual had
been seen previously. Each of these counts was performed by the same person who applied
the same census rules every year.
2.3. Data Analysis
Data analysis consisted of a comparison of the composition and variation of Eurasian
Buzzard diet as well as the breeding success of this raptor between the two habitat types.
Differences in the abundance of main and alternative prey of Eurasian Buzzards between
field types and years were analyzed using two-way ANOVA, while differences in the
breeding parameters between field types by one-way ANOVA. The frequencies of common
voles in the diet were compared by the chi-squared test. The diversity of Eurasian Buzzard
diet was characterized using the Shannon index (H’, ln) for the nine prey categories.
When analyzing the influence of changes in the abundance of main prey on the diet and
breeding performance of Eurasian Buzzards, in order to obtain linear relationships, the
logarithmic values of the mean densities of burrow entrances were used as indices of vole
abundance. The analyses were performed using general linear models (GLM, Statistica
software, version 7.1, StatSoft. Inc., Tulsa, OK, USA) with the frequencies of individual
prey categories or the parameters of breeding success as dependent variables and the vole
abundance index (continuous) and the field type (category) as explanatory variables. If a
significant relationship between a given dependent variable and the vole index was found,
the partial regression coefficient (rp ) for this relationship was calculated. When the GLM
showed significant differences in a given dependent variable between the two field types,
adjusted means were generated for both field types, i.e., the values predicted by the model
for the average index of vole abundance. Moreover, to test differences in the course of
relationships between the frequencies of individual prey categories or the parameters of
breeding success and the index of vole abundance in the two field types (i.e., differences
between the slopes of regressions describing these relationships), separate GLMs were
calculated with interaction between the vole index and field type.
3. Results
3.1. Prey Abundance
The annual average numbers of vole burrow entrances per hectare ranged from 1.0 to
41.4 in small fields and from 3.7 to 69.7 in large fields, as shown in Figure 2. The density
of entrances differed between years (F9,100 = 5.20, P < 0.001) and field types (F1,100 = 13.68,
P < 0.001) with insignificant year–field type interaction (F9,100 = 1.16, P > 0.05). The multi-
annual averages (n = 10) amounted to 11.9 (SD = 11.8) entrances per hectare in small fields
and 30.0 (SD = 25.0) in large fields. Thus, the mean density of vole burrow entrances was
2.5 times higher in large fields than in small ones.
The annual average numbers of birds observed per census point varied from 6.5 to 9.5
in small fields and from 3.9 to 5.1 in large fields, as shown in Figure 3. The number of ob-
served birds did not significantly differ between years (F9,430 = 0.38, P > 0.05), but differed
between field types (F1,430 = 83.25, P < 0.001), and year–field type interaction was insignifi-
cant (F9,430 = 1.01, P > 0.05). The multiannual average (n = 10) of the number of birds per
point was 7.8 (SD = 0.8) in small fields and 4.6 (SD = 0.4) in large fields, i.e., 1.7 times more
birds were found in small fields than in large ones. The most frequently observed birds
were Eurasian Sky Larks Alauda arvensis (36%) and Yellow Wagtails Motacilla flava (12%).Birds 2021, 2 119
Figure 2. The density of entrances to common vole burrows in the two types of agricultural habitat
in western Poland in the years 2005–2014 (mean values and ± standard errors SE are shown).
Figure 3. The index of passerine bird abundance in the two types of agricultural habitat in western
Poland in the years 2005–2014 (mean values and ±SE are shown).
3.2. Dietary Response
The most frequent item in the diet of Eurasian Buzzards in both types of agricultural
habitat was the common vole, followed by small birds and moles, as shown in Table 1. The
proportion of common voles in the diet was lower in small fields compared to large fields
(χ2 = 72.46, P < 0.001). Consequently, the Shannon index of diet diversity was higher in
small fields than in large ones, as shown in Table 1.
The GLM analysis showed a positive effect of the vole index on the frequency of
common voles in the diet of Eurasian Buzzards (rp = 0.863), but the field type effect
and field type–vole index interaction were insignificant, as shown in Table 2. Thus, no
differences were found between the two field types in either the proportion of main prey
or in the course of Eurasian Buzzard functional responses, as shown in Figure 4A. The
frequency of moles was higher in large fields than in small fields (adjusted means: 17.2Birds 2021, 2 120
and 12.9, respectively) and decreased (rp = –0.878) with the index of vole abundance, as
shown in Table 2 and Figure 4B. The frequency of shrews was marginally higher in small
fields than in large ones (adjusted means: 1.2 and 0.5, respectively), and the effect of vole
index was not significant, as shown in Table 2 and Figure 4C. A negative relationship was
also found between the vole index and the frequency of other voles (rp = –0.531), as well as
reptiles and amphibians (rp = −0.550), but in both these cases the effect of field type was
insignificant, as shown in Table 2 and Figure 4D,F. The frequencies of mice, other mammals,
small birds, and medium/large birds did not significantly change in relation to the field
type and the vole index, as shown in Table 2. However, when the data for the two bird
categories were pooled, as shown in Figure 4E, the frequency of all birds decreased with the
index of vole abundance (rp = −0.466, F1,17 = 4.70, P = 0.045), but still no significance was
found for the effect of field type (F1,17 = 1.58, P > 0.05) and field type–vole index interaction
(F1,16 = 0.10, P > 0.05). The interaction between the field type and the vole index was also
not significant for all other secondary prey categories, as shown in Table 2.
The frequency of small birds in the diet of Eurasian Buzzards was not significantly
related to the index of passerine bird abundance (F1,17 = 0.27, P > 0.05) and the type of fields
(F1,17 = 1.11, P > 0.05). The bird abundance index showed no significant effect on the small
bird frequency also after insertion of the vole abundance index into the GLM (bird index:
F1,16 = 0.04, P > 0.05; vole index: F1,16 = 2.04, P > 0.05; field type: F1,16 = 0.24, P > 0.05).
Table 1. The diet composition of Eurasian Buzzard nestlings in the two types of agricultural habitat
in western Poland (n—total number of prey items; H’—Shannon index of diet diversity calculated
with the use of natural logarithms).
Small Fields Large Fields Total
Prey Category (n = 1917) (n = 1979) (n = 3896)
Frequency, %
Moles 12.9 11.5 12.2
Shrews 1.2 0.5 0.8
Common voles 46.0 59.7 53.1
Other voles 8.0 5.0 6.4
Mice 3.4 3.8 3.6
Other mammals 3.1 2.2 2.6
Small birds (passerines) 16.8 13.4 15.1
Medium and large birds 3.2 1.8 2.5
Reptiles and amphibians 5.4 2.1 3.7
H’ 1.67 1.36 1.52
Table 2. Results of general linear models (GLM) for the frequencies of individual prey categories in
relation to the type of agricultural habitat (small and large fields) and the index of vole abundance
(logarithmic values of mean burrow entrance numbers per hectare). Interactions between the two
explanatory variables were calculated in separate GLM to test differences in the slopes of regressions
between a given prey frequency and the vole index in the two habitat types.
Field Type Vole Index Interaction
Prey Category
(df = 1, 17) (df = 1, 17) (df = 1, 16)
Moles F = 4.97, P = 0.040 F = 57.10, P < 0.001 F = 0.92, P > 0.05
Shrews F = 4.51, P = 0.049 F = 0.69, P > 0.05 F = 0.28, P > 0.05
Common voles F = 0.30, P > 0.05 F = 49.78, P < 0.001 F = 0.02, P > 0.05
Other voles F = 0.73, P > 0.05 F = 6.66, P = 0.019 F = 1.44, P > 0.05
Mice F = 1.08, P > 0.05 F = 0.37, P > 0.05 F = 0.002, P > 0.05
Other mammals F = 0.39, P > 0.05 F = 0.99, P > 0.05 F = 0.38, P > 0.05
Small birds (passerines) F = 0.72, P > 0.05 F = 2.43, P > 0.05 F = 0.08, P > 0.05
Medium and large birds F = 1.89, P > 0.05 F = 4.21, P > 0.05 F = 0.02, P > 0.05
Reptiles and amphibians F = 2.84, P > 0.05 F = 7.38, P = 0.015 F = 0.001, P > 0.05Birds 2021, 2 121
Figure 4. The frequencies of selected prey categories in the diet of Eurasian Buzzard nestlings in relation to the index of
vole abundance (the logarithmic value of the mean number of burrow entrances per hectare) in the two types of agricultural
habitat in western Poland.
3.3. Reproductive Response
The average number of fledglings per successful Eurasian Buzzard nest during the
study period amounted to 1.58 (n = 88, SD = 0.60) in small fields (annual averages 1.2–2.0)
and 1.63 (n = 99, SD = 0.68) in large ones (1.5–2.0), whereas the average number of fledglings
per nesting attempt was 1.18 (n = 118, SD = 0.86) in small fields (annual averages 0.7–2.0)
and 1.17 (n = 138, SD = 0.93) in large ones (0.9–2.0). No significant differences between small
and large fields were found in these multiannual averages for either the first (F1,185 = 0.25,
P > 0.05) or the second reproductive parameter (F1,254 = 0.01, P > 0.05). When the repro-
ductive parameters were related to the abundance of voles and field types, as shown inBirds 2021, 2 122
Figure 5, the annual average number of fledglings per successful nest increased with the
index of vole abundance (rp = 0.716, F1,17 = 17.92, P < 0.001), but no significance was
found in the case of the field type effect (F1,17 = 1.32, P > 0.05) and the interaction between
field type and vole index (F1,16 = 1.39, P > 0.05). Similarly, the annual average number
of fledglings per nesting attempt increased with the vole index (rp = 0.637, F1,17 = 11.60,
P = 0.003), the difference between the field types was marginally insignificant (F1,17 = 3.17,
P = 0.093), and the interaction was not significant (F1,16 = 0.52, P > 0.05). The index of
passerine bird abundance did not give any significant effects after insertion into the above
GLMs, both in the case of the number of fledglings per successful nest (F1,16 = 0.0001,
P > 0.05) and per nesting attempt (F1,16 = 0.01, P > 0.05).
Figure 5. The reproductive parameters of Eurasian Buzzards in relation to the index of vole abundance (the logarithmic
value of the mean number of burrow entrances per hectare) in the two types of agricultural habitat in western Poland.
4. Discussion
The abundance of main Eurasian Buzzard prey, i.e., the common vole, was found to be
higher in the simplified habitat of large fields than in the diversified habitat of small fields
in western Poland and showed considerable annual differences. By contrast, the abundance
of the prey group considered as the most important alternative food, i.e., small passerine
birds, did not significantly differ between years, but was substantially greater in small fields
than in large fields, as predicted. The last result is consistent with European knowledge
indicating generally higher species richness and abundance of birds in more heterogeneous
agricultural landscapes, i.e., characterized by the fragmentation of crop fields or dense field
borders and the numerous presence of non-agricultural habitats, including the clumps and
strips of trees [41–45].
The common vole was the main ingredient of Eurasian Buzzard food in both types
of agricultural habitats; however, the frequency of this prey was higher in large fields,
in accordance with the observed difference in the abundance of this prey species. Birds
were the most important secondary prey of Eurasian Buzzards, taking into account their
frequency in the diet. However, the functional response of Eurasian Buzzards to birds
in the years of low vole abundance was relatively weak. A clearer response was found
in the case of moles, other voles, and reptiles, as Eurasian Buzzards markedly switched
to these animals when the abundance of voles decreased. Therefore, these prey groups
turned out to be the main alternative food (as defined in [10]). A considerable and relatively
stable occurrence of birds in the diet of Eurasian Buzzards undoubtedly resulted from their
common and equal availability.
One of the predictions tested in this paper was the thesis that in the less diversified
agricultural landscape, Eurasian Buzzards should show a weaker functional response,
i.e., the frequency of main prey in their diet should not decrease considerably with aBirds 2021, 2 123
reduction in the abundance of this prey or such a decrease should be smaller than in the
more diversified landscape. However, the course of the relationship between the frequency
of common voles in the Eurasian Buzzard diet and their abundance in crop fields did not
differ between the two types of agricultural habitat. Therefore, the higher frequency of
common voles found in Eurasian Buzzards’ nesting among large fields resulted only from
the higher average abundance of voles in this habitat, and at the same values of vole index,
the frequencies of this prey in the diet were similar in both types of farmland. Moreover,
no significant differences between the two habitats were detected in the course of changes
in the frequency of any secondary prey category with the changing abundance of main
prey. Thus, the hypothesis about the shift of Eurasian Buzzards within the specialist–
generalist continuum depending on habitat heterogeneity determining alternative prey
abundance has not been confirmed. This may result from some differences in predator–prey
interactions that seem to occur between the two types of agricultural habitat.
Firstly, the high crop vegetation present during late spring and early summer un-
doubtedly limits the availability of common voles to Eurasian Buzzards, just like the snow
cover in the winter season protects small rodents from generalist predators in northern
Europe [17,18]. It seems that this hindered access to voles by high vegetation in western
Poland could be more important in large fields, where the “umbrellas” of homogeneous
crops over the colonies of voles had an area of several tens of hectares, than in small fields,
where the tall winter and permanent crops (e.g., oil-seed rape or alfalfa) with high vole
densities created a mosaic with later growing spring crops. Such limitation of availability
for avian predators by tall vegetation may, however, not apply to some other prey groups,
especially birds, which often remain above the surface of the ground. Secondly, it is con-
sidered that the structure of the agricultural landscape affects the predation risk of many
birds and mammals, e.g., by determining the availability of shelters and safe foraging
places [46–48]. For example, such an effect was found in the same region of western Poland
in the Grey Partridge Perdix perdix [49]. This gallinaceous bird prefers the edges of crop
fields during the breeding season. In the landscape of fragmented fields, i.e., with dense
borders between different crops, partridges occupied practically the entire surface, and
such behavior promotes the avoidance of predation. In the landscape of large fields, where
the field borders were relatively sparse, these birds stayed and nested on a small part of
the area, which led to high predation risk. Generally, habitat structural complexity has
been suggested as a factor reducing the foraging success of predators and predation risk
to prey [50,51]. Therefore, even if the abundance of some secondary prey groups was
considerably higher in small fields in western Poland (which was showed in the case of
small passerine birds), their actual availability could differ to a lesser extent between the
two types of farmland.
The effect of food abundance on the reproductive success was sometimes demon-
strated in the Eurasian Buzzard in the temperate regions of Europe [23,52–54]. In my study
area, the number of fledglings raised by Eurasian Buzzards in a given year was clearly
dependent on the abundance of common voles. However, contrary to the predictions
formulated, this relationship did not show any significant differences between small and
large fields. On the other hand, this finding was in accordance with the described lack of
differences in the dietary response between the two field types. Moreover, although the
average index of main prey abundance was higher in large fields than in small ones, the
multiannual means of both reproductive parameters did not differ significantly between
the farmland types. This seems to confirm the conclusion formulated in the previous
paragraph that despite the differences in the abundance of main prey and the most impor-
tant secondary prey, the two types of agricultural habitat were probably characterized by
similar availability of food resources for Eurasian Buzzards.
The abundance of common voles in the study area considerably changed also before
the current research period [55] and after this period (M. Panek, unpublished data), so
their local population showed irregular multiannual fluctuations. More regular changes in
vole populations occur in another region of Europe, i.e., in the boreal part of Fennoscandia,Birds 2021, 2 124
where the abundance of small rodents undergoes high-amplitude 3–5 year cycles [8,9,13].
However, such cyclicity gradually disappears with decreasing latitude, and in the south
of Fennoscandia, often only seasonal changes in the abundance of small rodents are
observed [8,9,18]. The existence of this geographical gradient in small rodent fluctuations
has been explained by the stabilizing impact of generalist predators, which are more
abundant in the southern regions, as the diverse habitats occurring there maintain richer
resources of alternative prey for these predators than in the boreal zone [8,9,17–20]. A
similar phenomenon could be expected in the gradient of simplified–diversified habitats in
temperate regions, and one of the possible mechanisms seems to be the potential shift in
the specialist–generalist predation continuum between areas that differ in habitat diversity.
However, the existence of such a shift has not been identified during this research on
Eurasian Buzzards.
This study confirmed that the Eurasian Buzzard can be classified as a moderately
generalist predator during the nesting period in western Poland. Although this raptor
hunts mainly one prey species, i.e., the common vole, it switches to alternative prey when
the main one becomes less abundant. The food resources and diet composition of Eurasian
Buzzard nestlings differed between the simplified habitat of large fields and the diversified
habitat of small fields. Despite this, the prediction about changes in the pattern of dietary
and reproductive responses between these two habitat types has not been confirmed.
It cannot be excluded, however, that some shifts in the specialist–generalist spectrum
between simplified and diversified habitats occur in other predator species that have
different flexibility in their feeding habits to the Eurasian Buzzard.
Funding: This research received no external funding.
Acknowledgments: I am grateful to my colleagues from the Research Station PHA in Czempiń for
their help in data collection and for their valuable comments to the manuscript. I also thank Ian
Hatcher for language improvements.
Conflicts of Interest: The author declares no conflict of interest.
References
1. Korpimäki, E.; Norrdahl, K. Predation of Tengmalm’s owls: Numerical responses, functional responses and dampening impact
on population fluctuations of microtines. Oikos 1989, 54, 154–164. [CrossRef]
2. Korpimäki, E.; Norrdahl, K. Numerical and functional responses of kestrels, short-eared owls, and long-eared owls to vole
densities. Ecology 1991, 72, 814–826. [CrossRef]
3. Nielsen, Ó.K. Gyrfalcon predation on ptarmigan: Numerical and functional responses. J. Anim. Ecol. 1999, 68, 1034–1050.
[CrossRef]
4. Redpath, S.M.; Thirgood, S.J. Numerical and functional responses in generalist predators: Hen harriers and peregrines on Scottish
grouse moors. J. Anim. Ecol. 1999, 68, 879–892. [CrossRef]
5. Salamolard, M.; Butet, A.; Leroux, A.; Bretagnolle, V. Responses of an avian predator to variation in prey density at a temperate
latitude. Ecology 2000, 81, 2428–2441. [CrossRef]
6. Gilg, O.; Sittler, B.; Sabard, B.; Hurstel, A.; Sané, R.; Delattre, P.; Hanski, I. Functional and numerical responses of four lemming
predators in high arctic Greenland. Oikos 2006, 113, 193–216. [CrossRef]
7. Andersson, M.; Erlinge, S. Influence of predation on rodent populations. Oikos 1977, 29, 591–597. [CrossRef]
8. Hanski, I.; Hansson, L.; Henttonen, H. Specialist predators, generalist predators, and the microtine rodent cycle. J. Anim. Ecol.
1991, 60, 353–367. [CrossRef]
9. Hanski, I.; Henttonen, H.; Korpimäki, E.; Oksanen, L.; Turchin, P. Small-rodent dynamics and predation. Ecology 2001, 82,
1505–1520. [CrossRef]
10. Angelstam, P.; Lindström, E.; Widén, P. Role of predation in short-term population fluctuations of some birds and mammals in
Fennoscandia. Oecologia 1984, 62, 199–208. [CrossRef] [PubMed]
11. Norrdahl, K.; Korpimäki, E. Do predators limit the abundance of alternative prey? Experiments with vole-eating avian and
mammalian predators. Oikos 2000, 91, 528–540. [CrossRef]
12. Terraube, J.; Arroyo, B.; Madders, M.; Mougeot, F. Diet specialization and foraging efficiency under fluctuating vole abundance:
A comparison between generalist and specialist avian predators. Oikos 2011, 120, 234–244. [CrossRef]
13. Korpimäki, E.; Krebs, C.J. Predation and population cycles of small mammals. BioScience 1996, 46, 754–764.
14. Korpimäki, E.; Norrdahl, K.; Rinta-Jaskari, T. Responses of stoat and least weasels to fluctuating food abundances: Is the low
phase of the vole cycle due to mustelid predation? Oecologia 1991, 88, 552–561. [CrossRef]Birds 2021, 2 125
15. Korpela, K.; Helle, P.; Henttonen, H.; Korpimäki, E.; Koskela, E.; Ovaskainen, O.; Pietiäinen, H.; Sundell, J.; Valkama, J.; Huitu, O.
Predator-vole interactions in northern Europe: The role of small mustelids. Proc. R. Soc. B 2014, 281, 20142119. [CrossRef]
[PubMed]
16. Korpimäki, E. Gradients in population fluctuations of Tengmalm’s owl Aegolius funereus in Europe. Oecologia 1986, 69, 195–201.
[CrossRef] [PubMed]
17. Erlinge, S.; Göransson, G.; Hansson, L.; Högstedt, G.; Liberg, O.; Nilsson, I.N.; Nilsson, T.; von Schantz, T.; Sylvén, M. Predation
as a regulating factor on small rodent populations in southern Sweden. Oikos 1983, 40, 36–52. [CrossRef]
18. Hansson, L.; Henttonen, H. Gradient in density variation of small rodents: The importance of latitude and snow cover. Oecologia
1985, 67, 394–402. [CrossRef]
19. Erlinge, S. Predation and noncyclicity in a microtine population in southern Sweden. Oikos 1987, 50, 347–352. [CrossRef]
20. Klemola, T.; Tanhuanpää, M.; Korpimäki, E.; Ruohomäki, K. Specialist and generalist natural enemies as an explanation for
geographical gradients in population cycles of northern herbivores. Oikos 2002, 99, 83–94. [CrossRef]
21. Mebs, T. Zur Biologie und Populationsdynamik des Mäusebussards (Buteo buteo). J. Ornith. 1964, 105, 247–306. [CrossRef]
22. Goszczyński, J.; Piłatowski, T. Diet of common buzzards (Buteo buteo L.) and goshawks (Accipiter gentilis L.) in the nesting period.
Ekologia Polska 1986, 34, 655–667.
23. J˛edrzejewski, W.; Szymura, A.; J˛edrzejewska, B. Reproduction and food of the buzzard Buteo buteo in relation to the abundance of
rodents and birds in Białowieża National Park, Poland. Ethol. Ecol. Evol. 1994, 6, 179–190. [CrossRef]
24. Reif, V.; Tornberg, R.; Jungell, S.; Korpimäki, E. Diet variation of common buzzards in Finland supports the alternative prey
hypothesis. Ecography 2001, 24, 267–274. [CrossRef]
25. Šotnár, K.; Obuch, J. Feeding ecology of a nesting population of the common buzzard (Buteo buteo) in the Upper Nitra Region,
Central Slovakia. Slovak Raptor J. 2009, 3, 13–20. [CrossRef]
26. Sidorovich, A.A.; Ivanovskij, V.; Sidorovich, V.E.; Solovej, I.A. Landscape-related variation in the diet composition of the common
buzzard (Buteo buteo) in Belarus. Slovak Raptor J. 2016, 10, 65–74. [CrossRef]
27. Ryszkowski, L.; Goszczyński, J.; Truszkowski, J. Trophic relationships of the common vole in cultivated fields. Acta Theriol. 1973,
18, 125–165. [CrossRef]
28. Mackin-Rogalska, R.; Nabagło, L. Geographical variation in cyclic periodicity and synchrony in the common vole, Microtus arvalis.
Oikos 1990, 59, 343–348. [CrossRef]
29. Delattre, P.; De Sousa, B.; Fichet-Calvet, E.; Quéré, J.P.; Giraudoux, P. Vole outbreaks in a landscape context: Evidence from a six
year study of Microtus arvalis. Lands. Ecol. 1999, 14, 401–412. [CrossRef]
30. Tkadlec, E.; Stenseth, N.C. A new geographical gradient in vole population dynamics. Proc. R. Soc. B 2001, 268, 1547–1552. [CrossRef]
[PubMed]
31. Reif, V.; Jungell, S.; Korpimäki, E.; Tornberg, R.; Mykrä, S. Numerical response of common buzzards and predation rate of main
and alternative prey under fluctuating food conditions. Ann. Zool. Fenn. 2004, 41, 599–697.
32. Panek, M. Numerical responses of an avian predator to prey fluctuations in a temperate latitude: Breeders vs. entire population.
Popul. Ecol. 2016, 58, 549–555. [CrossRef]
33. Wuczyński, A. Habitat use and hunting behaviour of Common Buzzards Buteo buteo wintering in south-western Poland.
Acta Ornithol. 2005, 40, 147–154. [CrossRef]
34. Ryszkowski, L. Structure and function of the mammal community in an agricultural landscape. Acta Zool. Fenn. 1982, 169, 45–59.
35. Panek, M.; Hušek, J. The effect of oilseed rape occurrence on main prey abundance and breeding success of the common buzzard
Buteo buteo. Bird Study 2014, 61, 457–464. [CrossRef]
36. Newton, I. Population Ecology of Raptors; Poyser: Berkhamsted, UK, 1979.
37. J˛edrzejewska, B.; J˛edrzejewski, W. Predation in Vertebrate Communities. The Białowieża Forest as a Case Study; Springer: Berlin,
Germany, 1998.
38. Pucek, Z. Keys to Vertebrates of Poland. Mammals; PWN: Warszawa, Poland, 1981.
39. Mackin-Rogalska, R.; Adamczewska-Andrzejewska, K.; Nabagło, L. Common vole numbers in relation to the utilization of
burrow systems. Acta Theriol. 1986, 31, 17–44. [CrossRef]
40. Bibby, C.J.; Burgess, N.D.; Hill, D.A.; Mustoe, S.H. Bird Census Techniques, 2nd ed.; Academic Press: London, UK, 2000.
41. Fuller, R.J.; Hinsley, S.A.; Swetnam, R.D. The relevance of non-farmland habitats, uncropped areas and habitat diversity to the
conservation of farmland birds. Ibis 2004, 146, 22–31. [CrossRef]
42. Sanderson, F.J.; Kloch, A.; Sachanowicz, K.; Donald, P.F. Predicting the effects of agricultural change on farmland bird populations
in Poland. Agric. Ecosyst. Environ. 2009, 129, 37–42. [CrossRef]
43. Siriwardena, G.M.; Cooke, I.R.; Sutherland, W.J. Landscape, cropping and field boundary influences on bird abundance. Ecography
2012, 35, 162–173. [CrossRef]
44. Fahrig, L.; Girard, J.; Duro, D.; Pasher, J.; Smith, A.; Javorek, S.; King, D.; Lindsay, K.F.; Mitchell, S.; Tischendorf, L. Farmlands
with smaller crops fields have higher within-field biodiversity. Agric. Ecosyst. Environ. 2015, 200, 219–234. [CrossRef]
45. Wuczyński, A. Farmland bird diversity in contrasting agricultural landscapes of southwestern Poland. Landsc. Urban Plan. 2016,
148, 108–119. [CrossRef]
46. Evans, K.L. The potential for interactions between predation and habitat change to cause population declines of farmland birds.
Ibis 2004, 146, 1–13. [CrossRef]Birds 2021, 2 126
47. Whittingham, M.J.; Evans, K.L. The effects of habitat structure on predation risk of birds in agricultural landscapes. Ibis 2004, 146,
210–220. [CrossRef]
48. Gorini, L.; Linnell, J.D.; May, R.; Panzacchi, M.; Boitani, L.; Odden, M.; Nilsen, E.B. Habitat heterogeneity and mammalian
predator-prey interactions. Mammal Rev. 2012, 42, 55–77. [CrossRef]
49. Panek, M. Landscape structure, predation of red foxes on grey partridges, and their spatial relations. Cent. Eur. J. Biol. 2013, 8,
1119–1126. [CrossRef]
50. Warfe, D.M.; Barmuta, L.A. Habitat structural complexity mediates the foraging success of multiple predator species. Oecologia
2004, 141, 171–178. [CrossRef]
51. Chalfoun, A.D.; Martin, T.E. Habitat structure mediates predation risk for sedentary prey: Experiments tests of alternative
hypotheses. J. Anim. Ecol. 2009, 78, 497–503. [CrossRef]
52. Goszczyński, J. Density and productivity of common buzzard Buteo buteo and goshawk Accipiter gentilis populations in Rogów,
Central Poland. Acta Ornithol. 1997, 32, 149–155.
53. Selås, V. Breeding density and brood size of common buzzard Buteo buteo in relation to snow cover in spring. Ardea 2001, 89,
471–479.
54. Sim, I.M.W.; Cross, A.V.; Lamacraft, D.L.; Pain, D.J. Correlates of common buzzard Buteo buteo density and breeding success in
the West Midlands. Bird Study 2001, 48, 317–329. [CrossRef]
55. Panek, M.; Kamieniarz, R. Vole fluctuations, red fox responses, predation on fawns, and roe deer dynamics in a temperate latitude.
Mamm. Res. 2017, 62, 341–349. [CrossRef]You can also read