Comparison of Hippocampal Subfield Segmentation Agreement between 2 Automated Protocols across the Adult Life Span
←
→
Page content transcription
If your browser does not render page correctly, please read the page content below
Published August 5, 2021 as 10.3174/ajnr.A7244

                                                                                                                                        ORIGINAL RESEARCH
                                                                                                                                                 ADULT BRAIN

                Comparison of Hippocampal Subfield Segmentation
              Agreement between 2 Automated Protocols across the
                                                 Adult Life Span
                                                                                                            A. Samara,     C.A. Raji,    Z. Li, and    T. Hershey

      ABSTRACT
      BACKGROUND AND PURPOSE: The hippocampus is a frequent focus of quantitative neuroimaging research, and structural hippo-
      campal alterations are related to multiple neurocognitive disorders. An increasing number of neuroimaging studies are focusing on
      hippocampal subfield regional involvement in these disorders using various automated segmentation approaches. Direct compari-
      sons among these approaches are limited. The purpose of this study was to compare the agreement between two automated hip-
      pocampal segmentation algorithms in an adult population.

      MATERIALS AND METHODS: We compared the results of 2 automated segmentation algorithms for hippocampal subfields (FreeSurfer
      v6.0 and volBrain) within a single imaging data set from adults (n ¼ 176, 89 women) across a wide age range (20–79 years). Brain MR imag-
      ing was acquired on a single 3T scanner as part of the IXI Brain Development Dataset and included T1- and T2-weighted MR images. We
      also examined subfield volumetric differences related to age and sex and the impact of different intracranial volume and total hippo-
      campal volume normalization methods.

      RESULTS: Estimated intracranial volume and total hippocampal volume of both protocols were strongly correlated (r ¼ 0.93 and 0.9,
      respectively; both P , .001). Hippocampal subfield volumes were correlated (ranging from r ¼ 0.42 for the subiculum to r ¼ 0.78 for the
      cornu ammonis [CA]1, all P , .001). However, absolute volumes were significantly different between protocols. volBrain produced larger
      CA1 and CA4-dentate gyrus and smaller CA2-CA3 and subiculum volumes compared with FreeSurfer v6.0. Regional age- and sex-related
      differences in subfield volumes were qualitatively and quantitatively different depending on segmentation protocol and intracranial vol-
      ume/total hippocampal volume normalization method.

      CONCLUSIONS: The hippocampal subfield volume relationship to demographic factors and disease states should undergo nuanced
      interpretation, especially when considering different segmentation protocols.

      ABBREVIATIONS: CA ¼ cornu ammonis; DG ¼ dentate gyrus; HPSF ¼ hippocampal subfield; ICV ¼ intracranial volume; SR-SL-SM ¼ strata radiatum-lacuno-
      sum-moleculare; THV ¼ total hippocampal volume

T    he hippocampus is a major component of the limbic system,
     and it is affected in several neurocognitive and neuropsychiatric
                                                                                            disorders from Alzheimer disease to major depressive disorder.1,2
                                                                                            Located in the mesial temporal lobes, the hippocampus functions as
                                                                                            a computational hub through its extensive afferent and efferent con-
Received February 22, 2021; accepted after revision May 14.                                 nections with cortical and subcortical structures.3 The hippocampus
From the Department of Psychiatry (A.S., Z.L., T.H.), Mallinckrodt Institute of Radiology   and hippocampal-related structures sustain a range of cognitive
(C.A.R., T.H.), Departments of Neurology (C.A.R., T.H.), and Psychological and Brain
Sciences (Z.L.), Washington University School of Medicine, St. Louis, Missouri.             functions in the context of episodic and semantic memory, spatial
A. Samara and C.A. Raji contributed equally to this work.                                   navigation, planning, and learning.4 The hippocampus is addition-
A. Samara was supported by National Institute on Drug Abuse (grant No.                      ally divided into distinct cytoarchitectonic regions called subfields,
5T32DA007261-29). C.A.R. was supported by Washington University in St. Louis,
National Institutes of Health KL2 Grant (KL2 TR000450, Institute of Clinical and
                                                                                            most prominently the dentate gyrus (DG), cornu ammonis (CA)
Translational Sciences Multidisciplinary Clinical Research Career Development               subfields 1–4, and the subiculum.5 Distinctive cognitive functions
Program), and the Radiological Society of North America Research Scholar Grant.
                                                                                            are supported by different subfields,6 and subfields are differentially
Please address correspondence Cyrus A. Raji, MD, PhD, Mallinckrodt Institute of
Radiology, Washington University School of Medicine, 4525 Scott Ave, St. Louis,             affected in various neuropsychiatric disorders.2,7
MO 63110; e-mail: craji@wustl.edu; @cyrusraji                                                   An increasing number of in vivo neuroimaging studies have
      Indicates open access to non-subscribers at www.ajnr.org                              focused on hippocampal subfield (HPSF) involvement in neuro-
     Indicates article with online supplemental data.                                       logic and psychiatric conditions.8,9 The ability to differentiate
http://dx.doi.org/10.3174/ajnr.A7244                                                        subfields in vivo provides a unique opportunity to identify
                                                                                                          AJNR Am J Neuroradiol :      2021   www.ajnr.org     1

                                         Copyright 2021 by American Society of Neuroradiology.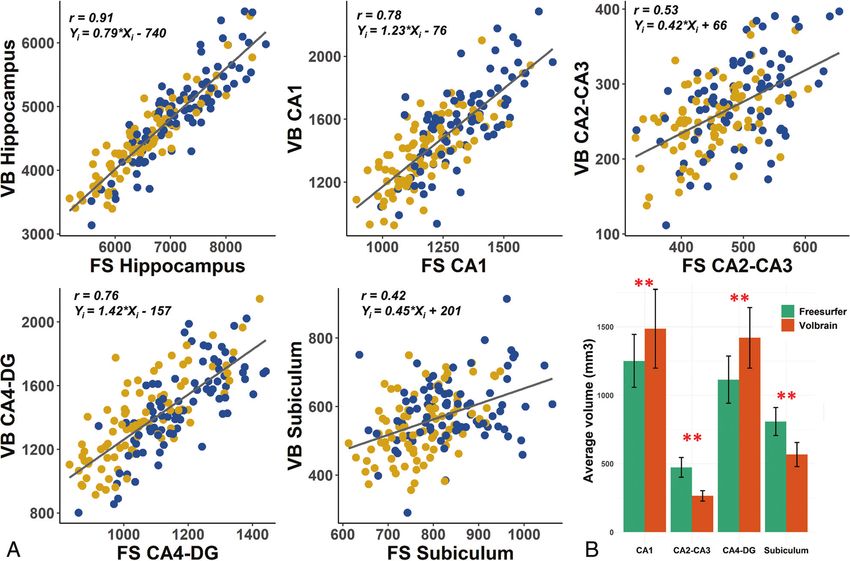
biomarkers for brain diseases like Alzheimer disease.9 For example,    acquisition matrix ¼ 192  187, flip angle ¼ 90.0°, voxel reso-
studies have shown that the HPSFs can be impacted by aging and         lution ¼ 0.9  0.9  1.2 mm.
Alzheimer disease in a regional-specific pattern and can be used as
an in vivo biomarker with diagnostic and prognostic significance.10    FreeSurfer and volBrain Segmentation
Manual segmentation has limited clinical throughput due to the         FreeSurfer v6.0 software is one of the most widely used pipelines
time requirement and the necessity of trained operators. Thus,         to obtain HPSF volumes. The FreeSurfer HPSF segmentation
automated approaches are needed to industrialize the clinical          module generates a fully automated segmentation based on a
throughput across millions of potential brain MR imaging scans.        probabilistic atlas.11 For each scan, we used the output volume
    Two segmentation protocols that are commonly used are              from the standard FreeSurfer processing of T1 MR imaging after
FreeSurfer (http://surfer.nmr.mgh.harvard.edu) and volBrain            correcting for motion, intensity normalization, and skull strip-
(https://volbrain.upv.es/index.php).11,12 Between 2013 and 2019,       ping. The FreeSurfer algorithm detects local variations in MR
.160 studies applying the FreeSurfer HPSF segmentation proto-          imaging contrast using a Bayesian inference algorithm and relies
col in normal development and various neuropsychiatric condi-          on a hippocampus atlas generated by combining manual labels
tions were published.13 Although FreeSurfer is the most widely         from ex vivo and in vivo whole-brain scans.11,18 FreeSurfer uses
used software, some concerns about segmentation accuracy in            both T1 and T2 MR imaging to obtain a more reliable segmenta-
earlier versions of FreeSurfer (v5.1, v5.2, and v5.3) have been pre-   tion.19 We used both T1 and T2 MR imaging in the hippocampus
viously raised,14,15 leading to several improvements in the more       subfield segmentation stage to improve tissue contrast and assist
recent versions of FreeSurfer using ex vivo and ultra-high-resolu-     in identifying landmarks of the internal hippocampal structure.
tion MR imaging.11 An increasing number of studies are using           FreeSurfer generates 12 subfields: parasubiculum, presubiculum,
the volBrain protocol as an alternative.16,17 The main advantage       subiculum, CA1, CA3, CA4, granule cell and molecular layer of
that volBrain provides over FreeSurfer is its considerably shorter     the dentate gyrus, molecular layer, hippocampus-amygdala tran-
processing time because the segmentation results are produced in       sition area, fimbria, hippocampal tail, and hippocampal fissure
approximately 15 minutes compared with several hours for               (definitions of subfield boundaries are detailed in Iglesias et al11).
FreeSurfer. The agreement of HPSF volumes from both protocols          CA2 is always included in the CA3 label, as CA2-CA3. We com-
has never been directly compared in a single study. Such compar-       bined CA4 and the granule cell and molecular layer of the dentate
ison is critical to allow optimal interpretation of results reported   gyri CA4-DG in subsequent analyses.
by different research groups.                                              The volBrain hippocampal subfield segmentation protocol is a
    The goal of the current work was to compare the output of          new method that consists of a fast multiatlas nonlocal patch-
the 2 HPSF segmentation protocols, FreeSurfer v6.0 and                 based label fusion.12 This pipeline is publicly available on a web-
volBrain, in a large cohort of adults based on T1- and T2-             based platform.20 volBrain provides the option to use multimodal
weighted MR imaging. We selected these 2 protocols because             images (T1 and T2 MR imaging) for improved accuracy of seg-
FreeSurfer is the most popular software for hippocampal sub-           mentation, which we used in our analysis. The original algorithm
field segmentation and volBrain is an increasingly popular alter-      is based on the Winterburn atlas,21 which produces 5 subfield
ative due to its considerably shorter processing time. We              labels: CA1, CA2/3, CA4/DG, stratum radiatum/stratum lacuno-
evaluated the agreement between the 2 protocols in volumetric          sum/stratum moleculare (SR-SL-SM), and subiculum. The proc-
assessment and investigated the presence of estimation bias in         essing time is about 15 minutes per scan. An example of both
measurements. We also examined qualitative and quantitative            HPSF segmentations is shown in Fig 1. Due to the large number
subfield differences related to age and sex and the impact of var-     of scans included, we did not review each scan by visual inspec-
ious intracranial volume (ICV) and total hippocampal volume            tion after completion, and we did not perform any manual cor-
(THV) normalization methods.                                           rections. However, as a quality control measure, we excluded
                                                                       individuals with .1 subfield volume as an outlying value (outlier
MATERIALS AND METHODS                                                  defined as . 3 SDs).
Participants and MR Imaging Acquisition
We used the publicly available IXI Brain Development Dataset           ICV Normalization Methods
(http://brain-development.org/ixi-dataset/). This data base includes   We examined the effect of different ICV normalization methods
T1- and T2-weighted brain MR imaging scans of healthy adults           on the HPSF volumetric analysis. Total ICV estimation from
with a wide age range. For the current analyses, we included scans     each protocol was used to correct for the subfields derived by the
that were acquired using the 3T scanner (Philips Healthcare) at        same protocol. We performed 3 distinct approaches to account
Hammersmith Hospital to assess the within-subject agreement of         for variations in total ICV. These methods were the following: 1)
HPSF volumes between protocols. T1-weighted imaging pa-                the proportion method (calculated by multiplying each individual
rameters were the following: TR ¼ 9.6 ms, TE ¼ 4.6 ms, num-            subfield-to-ICV ratio with the average ICV for the entire cohort);
ber of phase encoding steps ¼ 208, echo-train length ¼ 208,            2) the residual method (regressing out the effect of ICV before
reconstruction diameter ¼ 240.0, acquisition matrix ¼ 208             conducting further analysis); and 3) the covariate method (in
208, flip angle ¼ 8.0°, voxel resolution ¼ 0.9  0.9  1.2 mm.         which we included estimated ICV as a covariate in the regression
The T2-weighted parameters were the following: TR ¼ 5725.79            analyses as described below). In addition, to evaluate regional dif-
ms, TE ¼ 100.0 ms, number of phase encoding steps ¼ 187,               ferences in HPSF, we performed similar correction methods to
echo-train length ¼ 16, reconstruction diameter ¼ 240.0 mm,            account for variation in THV.22
2    Samara    2021   www.ajnr.org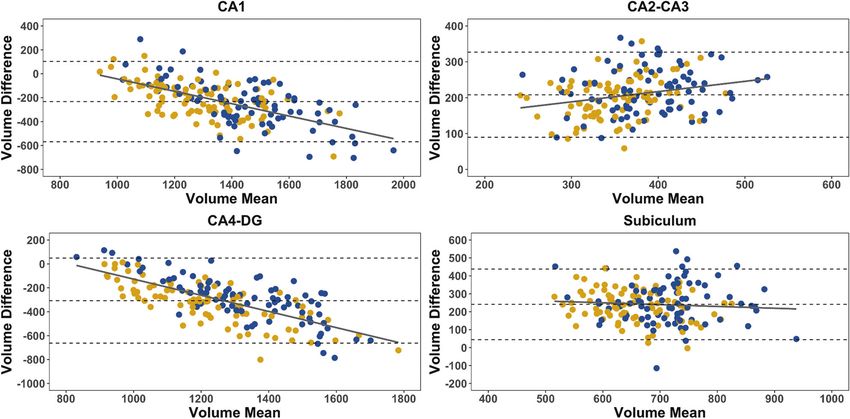
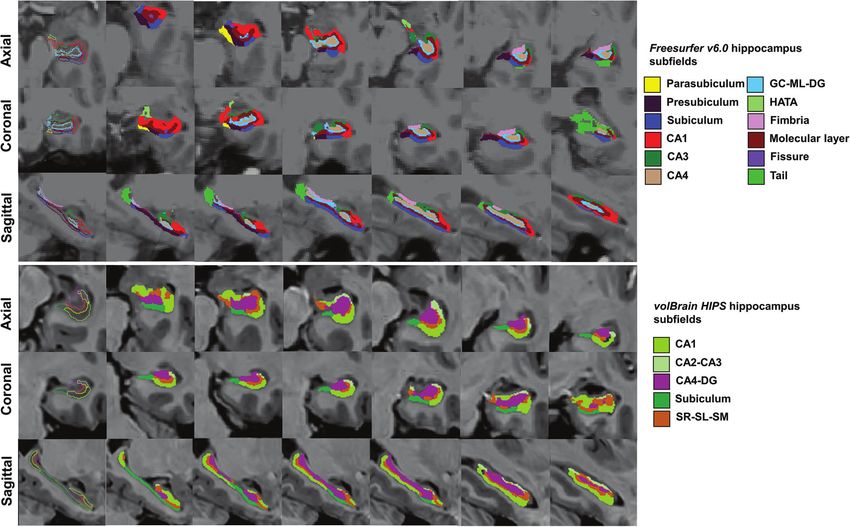
FIG 1. An example of hippocampal subfield segmentation by FreeSurfer (upper row) and volBrain (lower row) shown in axial, coronal, and sagit-
tal sections. GC-ML-DG indicates granule cell and molecular layers of the dentate gyrus; HATA, hippocampus-amygdala transition area.

Statistical Analysis                                                    and 2 volBrain). After exclusion, our analyzed sample included
We conducted all statistical analyses and illustrations using R sta-    83 men with an age range of 20–79 years (mean ¼ 45 [SD,
tistical and computing software (Version 3.6.3; http://www.             16] years) and 89 women with an age range of 21–82 years
r-project.org/). We combined the right and left hemispheric vol-        (mean ¼ 50 [SD, 17] years). A few participants had a single out-
umes for each subfield. The THV for each protocol was calcu-            lier across all subfields (FreeSurfer: CA2-CA3, 1; parasubiculum,
lated by combining all subfields (excluding the hippocampal             1; hippocampus-amygdala transition area, 1; fimbria, 1; fissure, 2;
fissure in FreeSurfer segmentation because it represents CSF).          volBrain: CA1, 1; CA2-CA3, 2; SR-SL-SM, 1; subiculum, 1). We
We used Pearson r correlations to relate HPSFs between the 2            excluded these outliers, but not the entire scans, from subsequent
protocols and paired t-tests to compare the mean differences            analyses.
between the 2 groups. To compare the effects of different ICV
normalization methods on the relationship between HPSF and
                                                                        Hippocampal Subfield Volumes
age and sex variables, we conducted multiple linear regression          The HPSF volumes produced by both FreeSurfer and volBrain
analyses and reported the dependent variable estimates for each         are detailed in the Table. Further correlation analyses were
ICV/THV normalization method. Additionally, we calculated the           applied only to subfields shared by both FreeSurfer and volBrain
effect size of the difference in HPSFs between men and women            segmentations (ie, CA1, CA2-CA3, CA4-DG, and the subicu-
using the Cohen’s D. In regression analyses, the Bonferroni cor-        lum). We observed significant correlations between the CA1,
rection for multiple comparisons was used as P , .0045 (P ¼ .05/        CA2-CA3, CA4-DG, and subiculum volumes segmented by both
11 subfields) for the FreeSurfer analyses, and P , .01 (P ¼ .05/5       FreeSurfer and volBrain (Fig 2; P , .001 for all correlations).
subfields) for the volBrain analyses. Finally, Bland-Altman plots       Correlation was strongest for CA1 (r ¼ 0.78) and weakest for the
were produced to visualize the disagreement between FreeSurfer          subiculum volume (r ¼ 0.42). However, the 2 protocols produced
and volBrain in terms of absolute, uncorrected hippocampal sub-         different average volumes. volBrain yielded larger average CA1
field volumes.                                                          and CA4-DG than FreeSurfer, while FreeSurfer conversely
                                                                        yielded larger CA2-CA3 and subiculum volumes than volBrain
RESULTS                                                                 (P , .001 for all subfields; Fig 2 and Table). The Bland-Altman
Participants                                                            plots confirmed that for almost every scan, FreeSurfer generated
A total of 176 eligible brain MR imaging scans underwent HPSF           smaller volumes for CA1 and CA4-DG and larger volumes for
segmentation. We subsequently excluded 4 scans because they             CA2-CA3 and the subiculum compared with volBrain (Fig 3).
yielded outlying volumetric values in .1 subfield (2 FreeSurfer         Furthermore, Bland-Altman plots demonstrated that the size of
                                                                                     AJNR Am J Neuroradiol :    2021   www.ajnr.org     3
Uncorrected hippocampal subfield, total hippocampal, and intracranial volumes measured by FreeSurfer and volBrain protocolsa
Total (n = 172) Male (n = 83) Female (n = 89)
Mean SD Mean SD Mean SD Cohen’s D
FreeSurfer v6.0
CA1 1251 193 1321 169 1184 159 0.83
CA2-CA3 472 71 497 51 449 54 0.91
CA4-DG 1113 171 1173 141 1057 135 0.84
Subiculum 807 102 841 101 775 87 0.7
Parasubiculum 121 21 126 16 117 21 0.48
Presubiculum 553 72 581 75 527 59 0.8
Molecular layer 1205 168 1241 136 1172 150 0.48
HATA 136 31 142 19 130 23 0.57
Fimbria 178 67 188 62 168 48 0.36
Tail 999 160 1049 155 952 118 0.7
Fissureb 269 71 276 49 262 70 0.23
THV 6839 957 7163 846 6537 758 0.78
eICV 1,563,261 146,983 1,677,235 158,967 1,456,885 231,310 1.11
volBrain, HIPS segmentation protocol
CA1 1486 286 1574 267 1405 234 0.67
CA2-CA3 264 37 276 43 253 32 0.61
CA4-DG 1420 221 1462 207 1382 260 0.34
SR-SL-SM 938 158 988 173 892 145 0.6
Subiculum 566 87 593 86 541 93 0.58
THV 4689 771 4908 776 4484 665 0.59
eICV 1,374,768 133,467 1,462,729 139,905 1,292,671 126,129 1.28
Note:—HATA indicates hippocampus-amygdala transition area; eICV, estimated intracranial volume; HIPS, hippocampal subfield segmentation protocol.
a
Uuits are cubic millimeters.
b
Not significantly different. Men had significantly larger values than females in all volumes, except hippocampus fissure (P , .05, Student t test). The average values of
total and subfield volumes reported here are the sum of right and left hemispheres combined.
FIG 2. A, Comparison of uncorrected total hippocampus, CA1, CA2-CA3, CA4-DG, and subiculum volumes (cubic millimeters) between
FreeSurfer and volBrain (yellow, women; blue, men). Regression lines relating volBrain to FreeSurfer volumes are shown for each subfield. The av-
erage values of subfield volumes reported here are the sum of right and left hemisphere volumes combined. All Pearson r correlations are signif-
icant (P , .001). B, Bar graphs show means (SDs). Double asterisks indicate statistical significance (P , .001); FS, FreeSurfer; VB, volBrain.
4 Samara 2021 www.ajnr.orgFIG 3. Bland-Altman plots for uncorrected subfield volumes (CA1, CA2-CA3, CA4-DG, and subiculum volumes [cubic millimeters]) generated by
FreeSurfer and volBrain (yellow, women; blue, men). Intrasubject volume difference (y-axis) is defined as (FreeSurfer volume) – (volBrain volume).
Mean volume is represented on the x-axis. The mean (SD, 1.96) volume difference and 95% confidence intervals are plotted as dashed horizontal
lines. Except for the subiculum, all Pearson r correlations are significant (P , .001).
the disagreement between the 2 protocols increased for larger hippocampal fissure and negatively correlated with the fimbria
volume estimates of CA1 (r ¼ 0.61; 95% CI, 0.70 to 0.51), and hippocampal tail. HPSF volumes were consistently higher in
CA2-CA3 (r ¼ 0.25; 95% CI, 0.110.39), and CA4-DG (r ¼ women than in men only when the ICV proportion method was
0.71; 95% CI, 0.78 to 0.63). No such relationship was found used. In volBrain, CA4-DG volume negatively correlated with
for the subiculum (r ¼ 0.08; 95% CI, 0.230.07; P ¼ .30). age across all ICV/THV normalization methods. CA1 and the
THV and total ICV estimations were strongly correlated subiculum negatively correlated with age only when ICV normal-
between FreeSurfer and volBrain (r ¼ 0.91 and r ¼ 0.93, respec- ization methods were applied. The SR-SL-SM subfield positively
tively; P ,.001). Compared to volBrain, FreeSurfer produced correlated with age when THV methods were used. CA4-DG vol-
higher THV and ICV volumes (P ,.001 for both) (Table). Both umes were significantly higher in women using all normalization
FreeSurfer and volBrain produced larger uncorrected HPSF vol- methods, except for the ICV covariate method.
umes in men compared with women, except for the hippocampal Moreover, some contradictory findings emerged when com-
fissure (Table). paring the results between the 2 segmentation protocols. Most
strikingly, in CA2-CA3, significant regression estimates for age
ICV and THV Normalization Methods had negative findings in FreeSurfer but positive findings in
For each HPSF segmented by either FreeSurfer or volBrain, vol- volBrain. In the subiculum, the estimates were positive in
ume values were normalized for both ICV and THV derived by FreeSurfer but negative in volBrain. Additionally, by means of
the same protocol using the covariate, proportion, and residual the ICV proportion method, CA2-CA3 and subiculum volumes
methods. These normalized volumes were then entered, sepa- were significantly larger in women than in men for FreeSurfer
rated by normalization method, into multiple linear regression but not for volBrain, which showed no significant sex effect.
models with participant age and sex as covariates (Online
Supplemental Data).
Both age and sex showed different associations with HPSF DISCUSSION
volumes depending on the segmentation protocol and normaliza- Our study is the first to directly compare the results of 2 com-
tion method. Marked inconsistency in the statistical significance monly used HPSF segmentation protocols, providing new insight
and magnitude of the regression estimates could be observed in to help compare results across different neuroimaging studies.
multiple HPSFs. Specifically, in FreeSurfer, CA1, CA2-CA3, Although the HPSF volumes produced using the 2 protocols
CA4-DG, and the presubiculum showed significant negative cor- were well-correlated, significant differences were observed in
relations with age only per ICV covariate and residual methods. absolute volumes. Specifically, volBrain produced larger CA1 and
However, for the molecular layer and subiculum, the significant CA4-DG volumes, while FreeSurfer produced larger CA2-CA3
positive correlation with age could only be established with THV and subiculum volumes. We also observed systematic biases in
normalization, but not ICV normalization. Regardless of the the HPSF estimations because the absolute volume difference
ICV/THV normalization method, age positively correlated with between the 2 protocols increased for larger volume estimates for
AJNR Am J Neuroradiol : 2021 www.ajnr.org 5CA1, CA2-CA3, and CA4-DG. Finally, we found that different When the volBrain protocol was compared with manual seg-
segmentation protocols and ICV/THV normalization methods mentation from the Winterburn data base at a standard resolu-
could lead to inconsistent and sometimes contradictory conclu- tion (0.9 mm isotropic), the average Dice similarity score was
sions regarding the regional effects of age and sex on HPSF 0.66 (ranging between 0.52 for CA2-CA3 and 0.76 for CA4-
volumes. DG).12 These findings highlight the inherent limitations of the
While absolute volumetric differences exist across the 2 proto- volBrain protocol. On the other hand, Iglesias et al11 performed a
cols, their results being correlated indicates that they may be qualitative assessment of the multimodal FreeSurfer segmenta-
interchangeably used for correlational analyses. Some of the tion on the Winterburn atlas data base. The authors suggested
inconsistencies between protocols are likely due to differences in that direct spatial overlap evaluation (eg, using Dice similarity
the number of HPSF labels (FreeSurfer, n ¼ 12; volBrain, n ¼ 5) scores) between the Winterburn manual and FreeSurfer auto-
and how the 2 protocols define the HPSF anatomic boundaries. mated segmentations is not possible due to labeling protocol
For example, FreeSurfer produces specific labels for the hippo- differences. Although the agreement between both segmenta-
campal tail, fimbria, hippocampus-amygdala transition area, par- tions was fair in general, prominent differences were observed
asubiculum, and presubiculum, while these subfield labels do not in areas poorly supported by the MR imaging contrast (eg, the
exist in volBrain. Yushkevich et al23 compared the results of 21 medial digitation) and regions where the definitions of HPSF
HPSF labeling protocols (which did not include volBrain) and boundaries were not similar (eg, the inferior parts). For
concluded that the greatest disagreement was along the CA1/sub- example, the FreeSurfer subiculum was mostly part of the
iculum anatomic boundary and anterior hippocampus. This ob- Winterburn atlas CA1 subfield, while the presubiculum and
servation could potentially explain the larger CA1 and smaller parasubiculum approximately corresponded to the Winterburn
subiculum produced by volBrain compared with FreeSurfer.23 atlas subiculum.11
Finally, the correlation between the 2 protocols was more robust ICV normalization is a commonly used procedure in neuroi-
for THV than for any HPSF, suggesting greater agreement in the maging research, and it is an important step to account for sex
outer hippocampal boundaries than in HPSF labels. differences and intersubject variations in head size. This step is
Differences in the age range and acquisition parameters in necessary because relative, rather than absolute, differences in
each algorithm training data set might have also contributed to volumes better described the structure-function relationships.
the observed differences. The generative model for the FreeSurfer Several ICV normalization methods had been described in the lit-
protocol was based on 15 ex vivo postmortem brain hemispheres erature, including the covariate, proportion, and residual meth-
obtained from individuals 60–91 years of age, with some individ- ods. In addition, van Eijk et al22 reported sex-dependent regional
uals who had mild Alzheimer disease or mild cognitive impair- differences in HPSF volumes after adjusting for THV. They sug-
ment.11 The brain tissue was scanned using 7T MR imaging at gested that the THV normalization could provide additional
0.13-mm isotropic resolution on average. On the other hand, the value over ICV normalization alone.22 When we applied different
volBrain segmentation protocol relied on the Winterburn atlas ICV/THV normalization methods in our study, the most noticea-
data base obtained from 5 healthy individuals 29–57 years of age ble finding was the marked impact of the choice of normalization
and acquired at 0.6-mm isotropic resolution.12 On the basis of method on both the direction and magnitude of estimates of age
the age range differences included in each dataset, it is reasonable and sex-related differences. Previous studies have demonstrated
to suggest that volBrain might provide more accurate segmenta- marked effects of ICV normalization methods on volumetric
tions when applied in younger age groups. In fact, when assessment of cortical and subcortical structures.25,26 For exam-
FreeSurfer segmentation is applied to standard resolution MR ple, different ICV normalization methods produce contradictory
imaging (1 mm isotropic), the molecular layer would not be results regarding the presence of sex-related volumetric differen-
clearly visible and atlas deformation is unlikely to be influenced ces.25 Some of these studies have also suggested that the residual
by this anatomic feature. In this case, fitting of the atlas to inter- method generally provides greater advantages over the propor-
nal structure relies on prior encoded information alone.11,24 tion and covariate methods,25-27 and these recommended resid-
This issue will introduce bias in a way that underestimates CA1 ual ICV normalization for volumetric studies of neuroanatomic
and CA4-DG volumes in younger individuals because these 2 sub- structures.25 We also noticed a clear trend of larger HPSF vol-
fields are susceptible to age-related changes.15 The Bland-Altman umes in women compared with men when the ICV proportion
plots support this explanation and show that between-protocol dif- method was used. This finding is consistent with those in prior
ferences in CA1 and CA4-DG volumes increased with higher studies showing that women have proportionately larger gray
mean volumes (ie, in younger individuals), while the differences matter regions than men,26,28 and these differences are potentially
decreased with lower mean volumes (ie, in older individuals). due to ICV differences rather than sex.25
Iglesias et al11 explicitly stated in their original article that the The main limitations of this study include a focus on quantita-
FreeSurfer atlas might include hippocampal atrophy because it was tive values for the HPSF volumes without looking at spatial overlap
built using delineations in elderly individuals, which could com- metrics and comparing label segmentations on a voxel-by-voxel
promise its applicability in younger populations. Nevertheless, we basis. Also, we could not directly compare the reliability of HPSF
acknowledge the possibility that the differences observed in the segmentations across different scanners, voxel resolutions, and
Bland-Altman plots could also be attributed to differing segmenta- field strengths (1.5T versus 3T). How this would affect the compar-
tion boundaries between the 2 protocols or higher error variances ison across protocols remains to be determined. However, prior
in one segmentation method than in the other. work had shown that understanding the performance of HPSF
6 Samara 2021 www.ajnr.orgsegmentation software at this field strength carries potentially 11. Iglesias JE, Augustinack JC, Nguyen K, et al. Alzheimer's Disease
greater clinical significance.29 Additionally, future studies should Neuroimaging Initiative. A computational atlas of the hippocampal
compare the segmentation results in pathologic conditions like formation using ex vivo, ultra-high resolution MRI: application to
adaptive segmentation of in vivo MRI. Neuroimage 2015;115:117–
Alzheimer disease. The performance of both protocols could dras- 37 CrossRef Medline
tically change if applied to MR imaging of patients, when tissue 12. Romero JE, Coupé P, Manjón JV. HIPS: a new hippocampus sub-
damage could reduce the contrast between the tissues and, conse- field segmentation method. Neuroimage 2017;163:286–95 CrossRef
quently, lead to greater variability in segmentation. Medline
13. Sämann PG, Inglesias JE, Gutman B, et al. FreeSurfer-based segmen-
tation of hippocampal subfields: a review of methods and applica-
CONCLUSIONS tions, with a novel quality control procedure for ENIGMA studies
Although automatic segmentation of HPSFs has enabled large-scale and other collaborative efforts. Hum Brain Mapp 2020 Dec 27.
in vivo analysis and has increased in popularity in recent years, it is [Epub ahead of print] CrossRef Medline
important to interpret the results of these studies with caution. 14. Wisse LE, Biessels GJ, Geerlings MI. A critical appraisal of the hip-
pocampal subfield segmentation package in FreeSurfer. Front
Although volumetric assessment of HPSF derived from FreeSurfer Aging Neurosci 2014;6:261 CrossRef Medline
and volBrain are well-correlated, we showed significant differences 15. de Flores R, La Joie R, Landeau B, et al. Effects of age and Alzheimer’s
between the 2 protocols in terms of absolute volumes and estima- disease on hippocampal subfields: comparison between manual and
tion bias. These differences could lead to different conclusions FreeSurfer volumetry. Hum Brain Mapp 2015;36: 463–74 CrossRef
about HPSF changes across the adult life span. We also showed that Medline
16. Moghaddam HS, Aarabi MH, Mehvari-Habibabadi J, et al. Distinct
the specific ICV normalization method used could influence the
patterns of hippocampal subfield volume loss in left and right
conclusions. Researchers should also be very careful when combin- mesial temporal lobe epilepsy. Neurol Sci 2021;42:1411–21 CrossRef
ing data across different protocols in any meta-analyses. Finally, the Medline
findings of our study highlight the need for a standard unified 17. Kim S, Greene DJ, D’Andrea CB, et al. Hippocampal volume in pro-
approach for HPSFs in neuroimaging studies. visional tic disorder predicts tic severity at 12-month follow-up. J
Clin Med 2020;9:1715 CrossRef Medline
18. Van Leemput K, Bakkour A, Benner T, et al. Automated segmenta-
Disclosures: Amjad Samara—RELATED: Grant: National Institutes on Drug Abuse,
tion of hippocampal subfields from ultra-high resolution in vivo
Comments: Amjad Samara was supported by National Institute on Drug Abuse
MRI. Hippocampus 2009;19:549–57 CrossRef Medline
(grant No. 5T32DA007261-29). Cyrus A. Raji—UNRELATED: Board Membership:
Brainreader ApS; Consultancy: Apollo Health; Expert Testimony: Neurevolution 19. Despotović I, Goossens B, Philips W. MRI segmentation of the
Medical; Grants/Grants Pending: National Institutes of Health KL2, Radiological human brain: challenges, methods, and applications. Comput Math
Society of North American Research & Education Foundation Scholar Grant.* Methods Med 2015;2015:450341 CrossRef Medline
Tamara Hershey—RELATED: Grant: National Institutes of Health*; UNRELATED: 20. Manjón JV, Coupé P. volBrain: an online MRI brain volumetry sys-
Employment: Washington University School of Medicine; Grants/Grants tem. Front Neuroinform 2016;10:30 CrossRef Medline
Pending: National Institutes of Health.* *Money paid to the institution. 21. Winterburn JL, Pruessner JC, Chavez S, et al. A novel in vivo atlas of
human hippocampal subfields using high-resolution 3 T magnetic
REFERENCES resonance imaging. Neuroimage 2013;74:254–65 CrossRef Medline
1. Raji CA, Lopez OL, Kuller LH, et al. Age, Alzheimer disease, and 22. van Eijk L, Hansell NK, Strike LT, et al. Region-specific sex differences
brain structure. Neurology 2009;73:1899–905 CrossRef Medline in the hippocampus. Neuroimage 2020;215:116781 CrossRef Medline
2. Han KM, Kim A, Kang W, et al. Hippocampal subfield volumes in 23. Yushkevich PA, Amaral RS, Augustinack JC, et al. Hippocampal
major depressive disorder and bipolar disorder. Eur Psychiatry Subfields Group (HSG). Quantitative comparison of 21 protocols
2019;57:70–77 CrossRef Medline for labeling hippocampal subfields and parahippocampal subre-
3. Battaglia FP, Benchenane K, Sirota A, et al. The hippocampus: hub gions in in vivo MRI: towards a harmonized segmentation proto-
of brain network communication for memory. Trends Cogn Sci col. Neuroimage 2015;111:526–41 CrossRef Medline
2011;15:310–18 CrossRef Medline 24. Wisse LE, Chételat G, Daugherty AM, et al. Hippocampal subfield
4. Buzsáki G, Moser EI. Memory, navigation and theta rhythm in the volumetry from structural isotropic 1 mm3 MRI scans: a note of
hippocampal-entorhinal system. Nat Neurosci 2013;16:130–38 caution. Hum Brain Mapp 2021;42:539–50 CrossRef Medline
CrossRef Medline 25. Pintzka CW, Hansen TI, Evensmoen HR, et al. Marked effects of in-
5. Amaral DG, Witter MP. The three-dimensional organization of the tracranial volume correction methods on sex differences in neuroa-
hippocampal formation: a review of anatomical data. Neuroscience natomical structures: a HUNT MRI study. Front Neurosci 2015;9:238
1989;31:571–91 CrossRef Medline CrossRef Medline
6. Dimsdale-Zucker HR, Ritchey M, Ekstrom AD, et al. CA1 and CA3 26. Voevodskaya O, Simmons A, Nordenskjöld R, et al, Alzheimer’s
differentially support spontaneous retrieval of episodic contexts Disease Neuroimaging Initiative. The effects of intracranial volume
within human hippocampal subfields. Nat Commun 2018;9:294 adjustment approaches on multiple regional MRI volumes in healthy
CrossRef Medline aging and Alzheimer’s disease. Front Aging Neurosci 2014;6:264
7. Mueller SG, Weiner MW. Selective effect of age, Apo e4, and CrossRef Medline
Alzheimer’s disease on hippocampal subfields. Hippocampus 27. Sanfilipo MP, Benedict RH, Zivadinov R, et al. Correction for intra-
2009;19:558–64 CrossRef Medline cranial volume in analysis of whole brain atrophy in multiple sclero-
8. Apostolova LG, Dutton RA, Dinov ID, et al. Conversion of mild cog- sis: the proportion vs. residual method. Neuroimage 2004;22:1732–43
nitive impairment to Alzheimer disease predicted by hippocampal CrossRef Medline
atrophy maps. Arch Neurol 2006;63:693–99 CrossRef Medline 28. Gur RC, Turetsky BI, Matsui M, et al. Sex differences in brain gray
9. Hanseeuw BJ, Van Leemput K, Kavec M, et al. Mild cognitive and white matter in healthy young adults: correlations with cogni-
impairment: differential atrophy in the hippocampal subfields. tive performance. J Neurosci 1999;19: 4065–72 CrossRef Medline
AJNR Am J Neuroradiol 2011;32:1658–61 CrossRef Medline 29. Chow N, Hwang KS, Hurtz S, et al. Comparing 3T and 1.5T MRI
10. Hett K, Ta VT, Catheline G, et al. Alzheimer’s Disease Neuroimaging for mapping hippocampal atrophy in the Alzheimer’s Disease
Initiative. Multimodal hippocampal subfield grading for Alzheimer’s Neuroimaging Initiative. AJNR Am J Neuroradiol 2015;36:653–60
disease classification. Sci Rep 2019;9:13845 CrossRef Medline CrossRef Medline
AJNR Am J Neuroradiol : 2021 www.ajnr.org 7You can also read