T1 -Mapping for Musculoskeletal Pain Diagnosis: Case Series of Variation of Water Bound Glycosaminoglycans Quantification before and after Fascial ...
←
→
Page content transcription
If your browser does not render page correctly, please read the page content below

International Journal of
           Environmental Research
           and Public Health

Article
T1%-Mapping for Musculoskeletal Pain Diagnosis:
Case Series of Variation of Water Bound
Glycosaminoglycans Quantification before and after
Fascial Manipulation® in Subjects with Elbow Pain
Rajiv G. Menon 1 , Stephen F. Oswald 2 , Preeti Raghavan 3 , Ravinder R. Regatte 1 and
Antonio Stecco 4, *
 1    Bernard and Irene Schwartz Center for Biomedical Imaging, New York University School of Medicine,
      New York, NY 10016, USA; Rajiv.Menon@nyulangone.org (R.G.M.);
      Ravinder.Regatte@nyulangone.org (R.R.R.)
 2    Private Practice, New York, NY 10011, USA; drstephenoswald@gmail.com
 3    Departments of Physical Medicine and Rehabilitation and Neurology, Johns Hopkins University School of
      Medicine, Baltimore, MD 21205, USA; praghav3@jhmi.edu
 4    Rusk Rehabilitation, New York University School of Medicine, New York, NY 10016, USA
 *    Correspondence: antonio.stecco@nyumc.org

 Received: 6 January 2020; Accepted: 19 January 2020; Published: 22 January 2020

 Abstract: Diagnosis and management of musculoskeletal pain is a major clinical challenge.
 Following this need, the first aim of our study was to provide an innovative magnetic resonance
 technique called T1% to quantify possible alterations in elbow pain, a common musculoskeletal
 pain syndrome that has not a clear etiology. Five patients were recruited presenting chronic elbow
 pain (>3 months), with an age between 30 and 70 years old. Patients underwent two T1% -mapping
 evaluations, one before and one after the series of Fascial Manipulation® (FM) treatments. After the
 first MRI evaluation, a Disability of the Arm, Shoulder and Hand (DASH) questionnaire was
 administered to quantify the symptoms and pain intensity. Patients then received three sessions of
 FM, once a week for 40 min each. A statistically significant difference was found between bound
 and unbound water concentration before and after FM treatment. Our preliminary data suggest that
 the application of the manual method seems to decrease the concentration of unbound water inside
 the deep fascia in the most chronic patients. This could explain the change in viscosity perceived by
 many practitioners as well as the decrease of symptoms due to the restoration of the normal property
 of the loose connective tissue. Being able to identify an altered deep fascial area may better guide
 therapies, contributing to a more nuanced view of the mechanisms of pain.

 Keywords: T1% ; fascial manipulation; epicondylitis

1. Introduction
     Diagnosis and management of musculoskeletal pain is a major clinical challenge [1].
Non-malignant musculoskeletal pain is the most common clinical symptom that causes patients
to seek medical attention and is a major cause of disability in the world [2]. In a large study, 842 patients
presenting to the emergency department with moderate to severe pain found that 74% of patients
continued to experience pain of moderate to severe intensity at discharge [3]. Hence, we need to
strengthen our understanding of the symptoms and the related mechanisms underlying musculoskeletal
pain. Fundamental knowledge of nociception from deep somatic structures has been studied and
defined in animals but the translation into clinical (human) sciences is still lacking [1]. Even if most

Int. J. Environ. Res. Public Health 2020, 17, 708; doi:10.3390/ijerph17030708      www.mdpi.com/journal/ijerph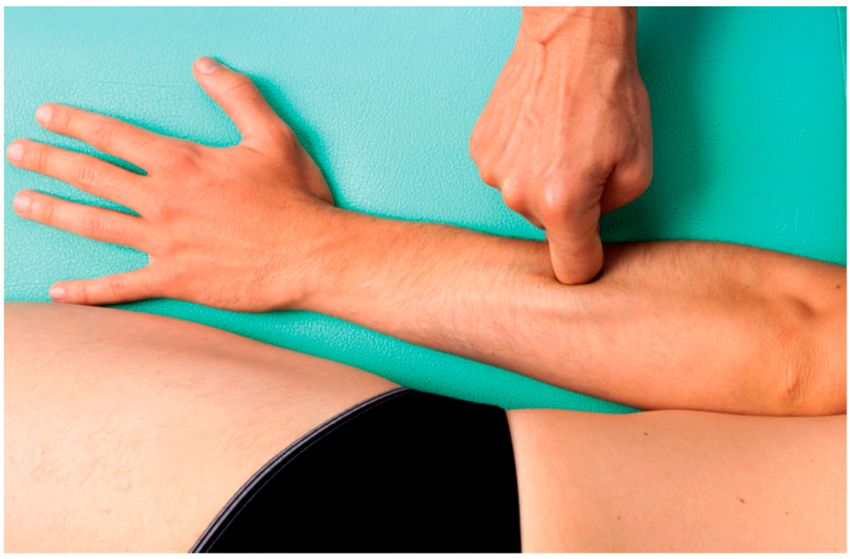
Int. J. Environ. Res. Public Health 2020, 17, 708                                                   2 of 10

clinicians consider chronic pain to be typically due to ongoing peripheral nociceptive input, there is not
a single chronic pain state where any radiographic, surgical, or pathological description of peripheral
nociceptive damage has been reproducibly shown to be related to the presence or severity of pain [4].
Many studies have reported pain in the absence of tissue damage or with likely pathophysiological
cause. Further, it is usually not possible to distinguish their experience from that due to soft-tissue
damage [5]. Even muscle biopsy studies had not conclusively shown specific abnormalities for chronic
pain syndromes [6,7]. Arendt-Nielsen et al. [1] state that, in humans, little information is available
on the peripheral neuronal correlate of muscle nociceptor activation and, therefore, quantitative
non-invasive techniques are needed for translational pain research. Following this need, we designed
our study with an innovative technique to quantify possible alterations presented in symptomatic
elbow. Shawan et al. [7] explain that the location and quality of elbow pain can be generally localized
in the anterior, medial, lateral, or posterior region. Lateral and medial elbow pain are two of the more
common diagnoses and often occur as a result of occupational activities but, unfortunately, determining
the underlying etiology of elbow pain can be difficult. Even if MRI is the preferred imaging modality
for chronic elbow pain due to its excellent soft-tissue contrast [8,9], most conditions that cause chronic
elbow pathology have only a clinically based diagnosis [7].
      Recently a new MR-technique using T1% mapping to image water-bounded content in upper limb
muscles was proposed [10]. T1% mapping is sensitive to low-frequency interactions [11], related to
the chemical exchange between extracellular water (unbound water) and macromolecules (bound
water) [12]. T1% mapping allows an indirect quantification of glycosaminoglycan (GAG) content,
and has been used to quantify proteoglycan content in cartilage [12], muscle [13], and intervertebral
discs [14].
      Arendt-Nielsen et al. [1] affirm that developing an understanding with novel mechanism-based
therapies to treat musculoskeletal pain would address a major unmet clinical need and will have
significant clinical, economic, and societal benefits. With this purpose, the aim of this study was to
treat patients suffering from elbow pain using Fascial Manipulation® (FM), a manual technique that
modifies the fascia [15,16] leading to change the excitability threshold of peripheral receptors within
fascia [17,18]. Knowing the existence of a high concentration of free nerves endings and receptors
within the fascia [17,18], this tissue has therefore obtained a new important role in pain generation,
attracting many researchers [1].

2. Material and Methods
     In this case series, five patients were prospectively recruited presenting chronic elbow pain
(>3 months), with an age between 30 and 70 years old, presenting symptoms prevalent in the lateral
region of the elbow which appeared without apparent trauma. Exclusion criteria for the study were
subjects with previous elbow fractures, surgery, or concomitant neurological or rheumatological
pathologies that could have altered the normal anatomy. This study was approved by New York
University Langone Health’s institutional review board (IRB) and was health insurance portability and
accountability act (HIPAA) compliant (S16-01317). This was a prospective, non-randomized imaging
study to determine intramuscular GAG content using proton T1% relaxation mapping. All subjects gave
written informed consent after explanation of the study and the protocol, as per the IRB guidelines.
     Patients underwent two T1% mapping evaluations, one before and one after the series of FM
treatments. T1% -MRI was performed at the Bernard and Irene Schwartz Center for Biomedical Imaging,
New York University School of Medicine. All imaging scans were done on a clinical 3T MRI scanner
(Prisma, Siemens Healthineers, Erlangen, Germany). The subjects were instructed to lie in a prone
position during the MRI imaging session. An 8-coil flexible receive array coil was wrapped around
the arm. A 3D-turbo-FLASH (fast, low-angle shot) MRI sequence with a customized T1% -preparation
module was used to enable varying spin lock durations (TSL). The sequence parameters included
FOV = 130 mm, matrix size = 256 × 64 × 64, TR = 1500 ms, resolution = 0.5 mm × 2 mm × 2 mm,
spin lock frequency = 500 Hz, 10-TSL durations = 2, 4, 6, 8, 10, 15, 25, 35, 45, 55 ms acquisition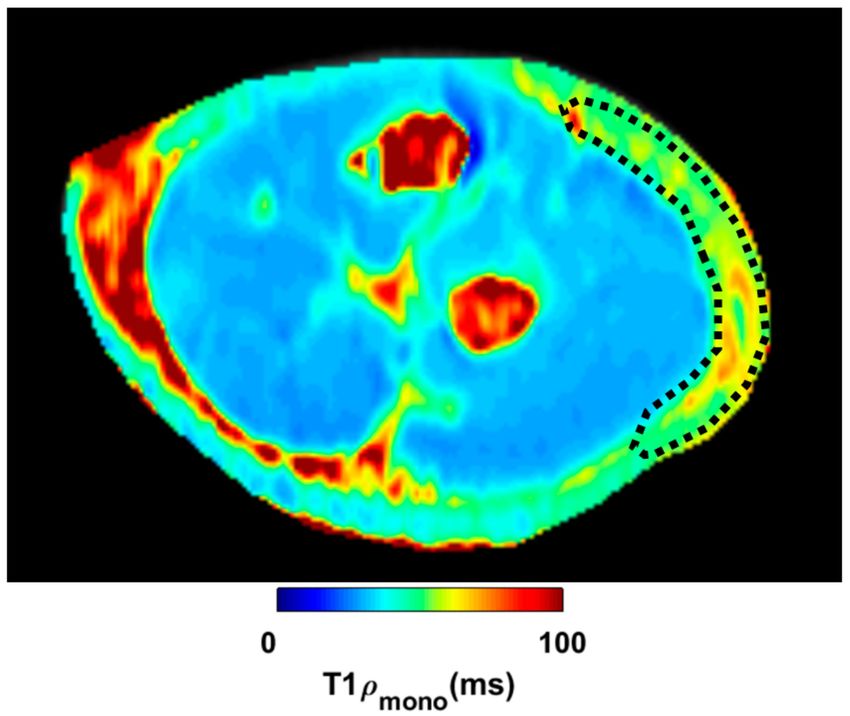
Int. J. Environ. Res. Public Health 2020, 17, 708                                                   3 of 10

duration = ~10 min. The MRI body coil was used for transmission, and vendor-supplied flexible receive
array coils (8 coil elements each) were wrapped around the affected arm for imaging. The defined
landmarks were adopted in order to standardize the location of the regions of interest as to where
on the limb the MR imaging was performed. Seven sites were selected in the forearm, equidistant
from each other, from the lateral epicondyles to the musculotendon junction of the common extensor
tendon. The advantage of T1% is that it can quantify indirectly the concentration of the GAG in the
musculoskeletal system. T1% mapping allows the quantification of the amount of water that is bounded
or not with GAG. GAG includes hyaluronan (HA) and proteoglycans. HA is normally considered a
lubricant that allows the gliding between interfaces such as cartilage to cartilage, epimysium to deep
fascia, and between individual layers of the deep fascia [19]. In specific conditions, however, when it is
spread on a surface at high concentration, HA can aggregate through non-covalent interactions like
those characteristic of van der Waals and hydrophobic forces, dramatically increasing the viscosity of
the surrounding loose connective tissue [20].
      After the pre-treatment T1%-mapping evaluation, a DASH questionnaire was administered to
quantify symptoms and pain intensity. Patients then received three sessions of FM, once a week for
40 min each, after which the DASH questionnaire was administered again. FM is a manual technique
(Figure 1) that implies a modern biomedical approach to the illness, thanks to the knowledge of the
human fascial system, but, at the same time, uses an individual approach to the patient. During the
clinical history, the segments in dysfunction are identified with an emphasis on the chronology.
This permits the development of a treatment hypothesis based on the current symptomatology of
patients and previous musculoskeletal events, which may be causing compensations, leading to
pain even in distant sites. The selection of points, defined as centers of coordination (CC) and
centers of fusion (CFs) (Figure 2), is guided by an assessment chart [21,22]. The chart integrates
information collected through movement verifications, patient pain ratings, including any radiation,
and, most importantly, the presence of “densification” (soft-tissue stiffness), obtained through palpation
verification. Additional guidance for the selection of points includes avoiding the patient’s excessively
painful areas where inflammation, lesions, or even fractures could be present, making this deep friction
a safe treatment.

                       Figure 1. Treatment over the center of coordination ER-CA (see Figure 2).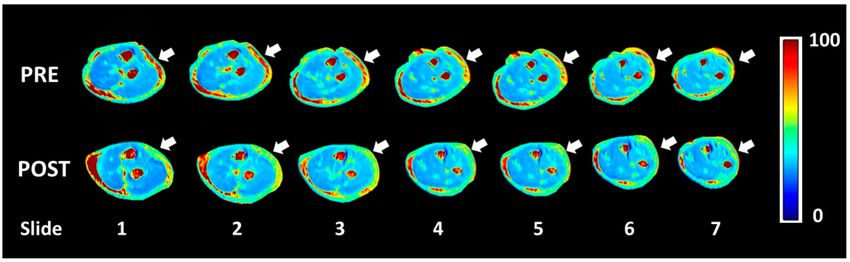
Int. J. Environ. Res. Public Health 2020, 17, 708                                                              4 of 10

      Figure 2. Location of the center of coordination. AN = antemotion; RE = retromotion; ME = mediomotion;
      LA = lateromotion; IR = intrarotation; ER = extrarotation. The blue dots represent the slides were coronal
      MRI were made.

3. Statistics
     Data analysis was performed with the SPSS software, version 25, (SPSS Inc., Chicago, IL, USA).
Efficacy of the treatment, assessed through the DASH score, was treated as an ordinal variable
using nonparametric statistical test (Wilcoxon–Mann–Whitney test). The mean values and standard
deviations in the manually drawn region of interests (ROIs) were calculated across the patients.
Wilcoxon–Mann–Whitney test was also used for comparing the pre- vs. post-treatment conditions in
patients. A p-value of less than 0.05 was used for analysis as the threshold to reject the null hypothesis.

4. Results
     Five patients were recruited with an average age of 57.4 (SD 7.92): two males and three females.
The average time since the onset of the symptoms was 30 months (SD 18.97). No side effects were
reported during or after treatment. Approximately one to two months following the treatment,
the patients were scanned again using the same T1% -mapping protocol. For post-treatment imaging,
only four of the five treated subjects were scanned, due to a subsequent dental implant in one
patient. Only the subjects having pre- and post-treatment MRI scans were included in the pre- vs.
post-treatment analysis.
     The DASH questionnaire had a mean value of 49.95 (SD 19.93), DASH work 43.64 (SD 23.50),
and DASH sport 65.07 (SD 34.95) before treatment. The DASH score ranged from 0 (no symptoms) to
100 (unable to perform any activities). After treatment, the questionnaire presented a mean value of
32.80 (SD 7.03), DASH work 32.03 (SD 13.84), and a DASH sport of 35.60 (SD 11.65) with a statistically
significant difference in 21 items over 30 and four items over five in work and sport DASH score
(Tables 1–4).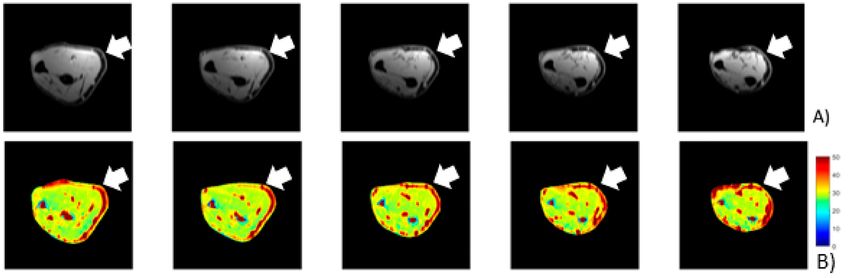
Int. J. Environ. Res. Public Health 2020, 17, 708                                                                                                  5 of 10

                                          Table 1. DASH score of the mean value of items 1–15.

    ITEMS       1            2       3         4      5         6        7           8          9      10          11    12        13      14      15
      PRE       2.29     1.71        2.00     1.57    2.00      2.00     2.00        1.86    1.86      2.00      2.43    2.57      1.86    3.00    2.43
     POST       1.71     1.14        1.43     1.14    1.29      1.29     1.14        1.29    1.29      1.43      1.29    1.43      1.14    1.86    1.43
    p-value    0.165     0.15       0.549    0.002   0.004     0.068    0.016       0.010   0.016     0.172     0.007   0.051     0.000   0.504   0.269

                                          Table 2. DASH score of the mean value of items 15–30.

    ITEMS       16       17          18       19      20        21       22          23         24     25          26    27        28      29      30
      PRE       1.71     1.00        2.57     2.43    1.57      1.00     1.29        1.57    2.14      2.71      1.86    2.57      2.29    2.00    2.86
     POST       1.00     1.00        1.71     1.14    1.14      1.00     1.29        1.29    1.43      1.57      1.43    1.57      1.43    1.29    2.00
    p-value    0.000    0.001       0.023    0.003   0.000     0.001    0.015       0.010   0.040     0.255     0.042   0.199     0.119   0.013   0.736

                                              Table 3. DASH work and DASH sport score.

                                                                        WORK
                                 ITEMS                     1                    2                     3                   4
                                   PRE                 1.71                    2.00                   1.86               1.57
                                  POST                 1.29                    1.29                   1.43               1.29
                                 p-value              0.046                   0.168                  0.030              0.010

                                              Table 4. DASH work and DASH sport score.

                                                                        SPORT
                                 ITEMS                     1                    2                     3                   4
                                   PRE                 2.71                   2.86                   2.57                2.43
                                  POST                 1.57                   1.43                   1.57                1.29
                                 p-value               0.36                   0.36                   0.65                0.11

     MATLAB software was used to evaluate the quantity of each single-color pixel in the seven MRI
slices over a pre-defined ROI corresponding to the lateral region of the elbow, the anatomical area
where most of the symptoms were referred (Figure 3). The selection of the ROI area was arbitrary with
the intent to isolate the deep fascia: a “second skin” that appears in the circumference of each coronal
section. A major red region (high concentration of unbounded water) was identified at the level of the
antebrachial fascia (deep fascia) in the pretreatment T1% sequence (Figure 4a). Some red spots were also
present in the middle of the forearm, corresponding to intermuscular septa and vessels. A statistically
significant difference was found between bound and unbound water concentration, before and after
FM treatment (Table 5). The slices shown in Figure 4a,b correspond to approximately similar slice
positions in the affected arm.

                                    Table 5. Mean T1% evaluation before and after the treatment.

                                                     PRE                                            POST
                                            MEAN               STD                   MEAN                     STD               p-Value
                       P_1                  45.39               4.09                  59.42                   1.99              0.0005
                       P_2                  44.84               2.54                  53.36                   6.97              0.0079
                       P_3                  49.9                    2                    53.4                  7                0.1797
                       P_4                  72.16               2.86                  53.36                   6.72              0.00058
Int. J. Environ. Res. Public Health 2020, 17, 708 6 of 10
Figure 3. Region of interest (ROI) in one slide post-treatment. The ROI is the black line located below
the skin at the level of the deep fascia in this transversal section of the forearm.
Figure 4. (A) Pretreatment of T1 MRI where the thickness of the brachial fascia is evident. The fascia is
the black ring below the skin identified by the arrow. (B) Pretreatment T1% -mapping where the higher
concentration of unbounded water is evident (water that it is not linked with any glycosaminoglycan
or hyaluronan) within the brachial fascia in the symptomatic side (white arrow).
Most of the patients presented a statistically significant difference in T1% relaxation time between
pre- and post-treatment conditions in the selected ROI (Table 5). Unfortunately, only in the most severe
patients there was a clear decrease of the unbounded water. In patient p_4, following the Fascial
Manipulation treatment, the mean T1% relaxation time in the ROI decreased from 72.16 ms (SD 2.86) to
53.36 ms (SD 6.72) (Figure 5). While there were smaller focal reductions in the unbound water in the
less chronic patients, the overall ROIs showed a net increase in the T1% values. It may be related to a
general biomechanical change of all the forearm region following the treatment of CCs and CFs that,
even if opposite or far away from the lateral region of the elbow, they may have affected the physiology
of the evaluated area. We also have to take into consideration that minor symptoms should also be less
extended or maybe localized proximal or distal from the lateral epicondyles, limiting the ability of the
pre-defined ROI to collect those alterations. If so, the increase of unbounded water, detected from our
ROI, could be considered a redistribution or new organization of the remaining unbounded water in
all the body segments.Int. J. Environ. Res. Public Health 2020, 17, 708 7 of 10
Figure 5. Pre- and post-T1% -mapping of brachial fascia (in ms). The white arrows show the areas that
were considered the most symptomatic from the patient. It can be seen a change of the color from red
(unbound water) in the pre-treatment imaging to green-blue (bound water that works as a lubricant) in
the post-treatment imaging.
5. Discussion
For the last two to three decades, pain research has mainly focused on the sensitization of
nociceptors in the periphery [1] without clearly defining the cause. Cowman et al. [23] has proved
that increases in HA concentration, the chief component of the GAG, can trigger a self-aggregation,
generating a dramatic increase in the viscosity in the extracellular matrix. This alteration can affect
the polymodal nociceptors [24] included in the deep fascia [17,18], decreasing their threshold of
activation [25]. This means that painful signals can easily be generated from abnormal peripheral
tissues (for example, stiff fascia) and transmitted, by the dorsal horn pain transmission neurons, to the
brain [26].
Being able to identify an altered deep fascial region may better guide therapies, contributing
to a more nuanced view of the mechanisms of pain rather than simply knowing “diagnoses” from
which the patient is suffering [4], and using this as the basis for treatment. In a recent survey [3],
294 patients were followed prospectively for a year. Of these patients, 62% suffered musculoskeletal
pain. Despite a year of treatment, 95% of the patients were still suffering from moderate to severe pain.
Arendt-Nielsen et al. [1] affirm that this data may very well represent the clinical situation observed
by many general practitioners. Elbow pain, epicondylitis, epitrochleitis, etc. could be examples of
regional pain conditions characterized by localized tenderness and pain which are caused by altered
fascia. A correct diagnosis will allow defining a better treatment, decreasing not only the patients’
sufferance but also the cost for the entire society.
FM, even if it shares some similarities with other techniques, presents a deeply different rationality
and clinical approach. While deep friction seen in FM can be compared to other techniques, the reasoning
behind the choice of points treated presents a major difference. The points are selected after a specific
assessment process involving clinical history, taking a clinical examination of specific movements and
palpatory verifications with the aim to identify stiff CCs and CFs [21] mostly outside the painful site.
MRI imaging already played a critical role in evaluating elbow pain [27], but now, with the T1%
mapping technique, it can become critical to define pain etiology. The process, that requires only a few
minutes more than a normal evaluation, provides data and imaging that can guide the clinician in
identifying the origin of the problem and the areas where treatment should be applied.
Our pilot study has shown that a high concentration of unbounded water was present even more
in outside regions from the symptomatic areas, regions where FM treatment is normally performed
(Figure 2). The information collected from the T1%- mapping can now give rationality to many techniques
that approach the symptoms by treating areas distant from the symptoms’ sites. This may explain
why a moderate relation between the DASH score and the concentration of bound water was found.
At the opposite end, a high concentration of unbound water was highly related to elevated DASH
score and symptoms. The statistically significant difference in T1% relaxation time between pre- and
post-treatment in patient one and two still proves a change of the quality of the tissue in the lateralInt. J. Environ. Res. Public Health 2020, 17, 708 8 of 10
elbow, even if the concentration of the bound water is not increased locally. A single and predefined
ROI does not permit to exclude improvements that occurred in other important biomechanical areas.
It was shown that hyaluronidase is able to decrease high HA concentration in patients suffering
from muscle stiffness [10]. Interestingly, although with a lower scale, T1% values showed elevated levels
of high unbound water before HA treatment, similar to the severe case of elbow pain in P_4.
A similar result was also found after treatment where hyaluronidase injection decreased the
amount of unbounded and increased the bounded water [10]. The authors suggest that hyaluronidase,
with its capacity to decrease the concentration of HA, was able to deplete the area from an excess
amount of HA that was not bound with water and so was not in its physical condition to operate as
a lubricant.
These preliminary data are supported by in vitro studies that confirm the capacity of HA to
self-aggregate and consequently increase its viscosity [23]. In our in vivo studies, we speculate that
increased T1% values reflect greater deposits of unbound GAG and HA and so are not able to express
their lubricant property within the deep fascia. This peculiar state of isolated self-aggregate GAG or
HA without water may explain the stiffness [15,22] as well the pain perceived probably due to the
irritation of the free nerve ending and receptor within the deep fascia that do not have a proper gliding
between its layers or with the underlying muscle [28].
Intervention with the aim of reducing the imbalance between self-aggregate HA/GAG (unbounded)
and water aggregate HA/GAG (bounded) represents a potential therapeutic target. FM applied over CCs
and CFs seems to hydrolyze the excess amount of self-aggregate GAG/HA reducing the viscoelasticity
of the ECM in the affected regions and allowing the fasciacyte [29] to produce the correct quantity and
quality of HA that will bound water for generating an appropriate lubricant solution required within
the fascial layers.
These preliminary data suggest that, because alterations were shown in five or even seven coronal
sections located between the epicondyles and the musculotendinous junction of the forearm, treatment
should be performed wider than usual, including altered areas that are far from the symptoms but
important from a biomechanical point of view.
This study had several limitations. The patient cohort used in this study is small. This study
received an institutional review board (IRB) compliancy for imaging with new MRI sequences under
development, limiting the recruitment at no more than five participants. For the ROI was arbitrary
selected the lateral part of the elbow, as the most common region of symptoms, without taking into
consideration the great variety of symptomatology that patients could have, as well the low correlation
between the area of symptoms and origin of the problem. Previous studies have demonstrated,
through elastrosonography [15] or intra/inter reliability palpation verification tests [22], that CCs and
CFs, even far away from the regions of the symptoms, can affect the biomechanics of proximal or
distal articulations.
No control group as well follow-up was present to prove the short- and long-lasting effects.
This case series does not permit to conclude cause and effect relationships, but due to the chronicity of
the patients, future clinical trials should be conducted.
6. Conclusions
Our understanding of pain has greatly improved over the last few decades [30], even if many
questions are still unanswered. There is a general agreement in applying an early and aggressive
treatment to prevent chronicity of pain when it is possible. There is also a general agreement on
the need for an evidence-based, individualized treatment strategy in patients with chronic pain
disorders [31]. Patient P_4 was the most chronic patient with the biggest improvement following
treatment. The p-value of 0.00058 of the pre- vs. post-treatment supports our hypothesis of quantifying
the increase in the bound water with FM treatments. Although focal improvements in small focal
areas were noted in the pre- vs. post-treatment, the less chronic patients did not show significant
improvement using MR-quantification.Int. J. Environ. Res. Public Health 2020, 17, 708 9 of 10
The goal of this case series was not to explain the full mechanisms of pain perception but to
better investigate the application of T1% -mapping in the detection of musculoskeletal alteration in
patients who have mainly received clinical diagnosis without any imaging-based causal evidence.
This manuscript suggests that we might finally have made some science-based progress with respect to
etiology in pain fields in order to implement our clinical practice. Furthermore, T1% mapping is sensitive
to the chemical exchange of large macromolecules such as HA and GAG with protons in bulk water,
making it a useful tool to quantify their content before and after treatment. These preliminary data
have shown an excess amount of unbounded water in the symptomatic areas as well in surrounding
areas, such as CCs and CFs, that have shown to decrease after treatment. These results suggest that
using T1% imaging shows significant potential to enhance the management of musculoskeletal pain,
which is a very common syndrome to treat. However, more studies have to be done to gain deeper
insights into the management of pain.
Author Contributions: R.R.R. and R.G.M. conducted the study and analyzed the data. S.F.O. evaluated and
treated the patients. A.S. and P.R. designed the study and prepared the first draft of the manuscript. All authors
were involved in the revision of the draft manuscript and have agreed to the final content. All authors reviewed
and contributed to the manuscript. All authors have read and agreed to the published version of the manuscript.
Funding: This research received no external funding.
Acknowledgments: This study was supported by NIH grants R01 AR067156, R01 AR068966, and R21 HD091559,
and was performed under the rubric of the Center of Advanced Imaging Innovation and Research (CAI2R),
a NIBIB Biomedical Technology Resource Center (NIH P41 EB017183).
Conflicts of Interest: R.R.R., R.G.M., and P.R. do not have any potential conflict of interests. S.F.O. and A.S. are
teachers associated with the Fascial Manipulation Association. The association is non-profit, with the objective of
promoting and supporting research in the field of pain relief in general and, in particular, in the field of anatomy
and physiopathology of the fasciae.
References
1. Arendt-Nielsen, L.; Graven-Nielsen, T. Translational aspects of musculoskeletal pain: From animals to
patients. In Fundamentals of Musculoskeletal Pain; Graven-Nielsen, T., Arendt-Nielsen, L., Mense, S., Eds.;
IASP Press: Seattle, WA, USA, 2008; pp. 347–366.
2. Bove, S.E.; Flatters, S.J.; Inglis, J.J.; Mantyh, P.W. New advances in musculoskeletal pain. Brain Res. Rev. 2009,
60, 187–201. [CrossRef] [PubMed]
3. Sinatra, R. Causes and consequences of inadequate management of acute pain. Pain Med. 2010, 11, 1859–1871.
[CrossRef] [PubMed]
4. Clauw, D.J. Diagnosing and treating chronic musculoskeletal pain based on the underlying mechanism(s).
Best Pract. Res. Clin. Rheumatol. 2015, 29, 6–19. [CrossRef] [PubMed]
5. Blyth, F.M.; Noguchi, N. Chronic musculoskeletal pain and its impact on older people. Best Pract. Res.
Clin. Rheumatol. 2017, 31, 160–168. [CrossRef] [PubMed]
6. Bartels, E.M.; Danneskiold-Samsøe, B. Histological abnormalities in muscle from patients with certain types
of fibrositis. Lancet 1986, 1, 755–757. [CrossRef]
7. Sharafi, A.; Chang, G.; Regatte, R.R. Bi-component T1rho and T2 Relaxation Mapping of Skeletal Muscle
In-Vivo. Sci. Rep. 2017, 7, 14115. [CrossRef]
8. Stevens, K.J.; McNally, E.G. Magnetic resonance imaging of the elbow in athletes. Clin. Sports Med. 2010, 29,
521–553. [CrossRef]
9. Walz, D.M.; Newman, J.S.; Konin, G.P.; Ross, G. Epicondylitis: Pathogenesis, imaging, and treatment.
Radiographics 2010, 30, 167–184. [CrossRef]
10. Menon, R.G.; Raghavan, P.; Regatte, R.R. Quantifying muscle glycosaminoglycan levels in patients with
post-stroke muscle stiffness using T(1%) MRI. Sci. Rep. 2019, 9, 14513. [CrossRef]
11. Gilani, I.A.; Sepponen, R. Quantitative rotating frame relaxometry methods in MRI. NMR Biomed. 2016, 29,
841–861. [CrossRef]
12. Mlynarik, V.; Szomolanyi, P.; Toffanin, R.; Vittur, F.; Trattnig, S. Transverse relaxation mechanisms in articular
cartilage. J. Magn. Reson. 2004, 169, 300–307. [CrossRef] [PubMed]Int. J. Environ. Res. Public Health 2020, 17, 708 10 of 10
13. Peng, X.G.; Wang, Y.C.; Zhang, S.J.; Bai, Y.Y.; Mao, H.; Teng, G.J.; Ju, S.H. Noninvasive assessment of age,
gender, and exercise effects on skeletal muscle: Initial experience with T1 rho MRI of calf muscle. JMRI 2017,
46, 61–70. [CrossRef] [PubMed]
14. Paul, C.P.L.; Smit, T.H.; De Graaf, M.; Holewijn, R.M.; Bisschop, A.; Van De Ven, P.M.; Mullender, M.G.;
Helder, M.N.; Strijkers, G.J. Quantitative MRI in early intervertebral disc degeneration: T1rho correlates
better than T2 and ADC with biomechanics, histology and matrix content. PLoS ONE 2018, 13, e0191442.
[CrossRef] [PubMed]
15. Luomala, T.; Pihlman, M.; Heiskanen, J.; Stecco, C. Case study: Could ultrasound and elastography visualized
densified areas inside the deep fascia? J. Bodyw. Mov. Ther. 2014, 18, 462–468. [CrossRef]
16. Stecco, A.; Meneghini, A.; Stern, R.; Stecco, C.; Imamura, M. Ultrasonography in myofascial neck pain:
Randomized clinical trial for diagnosis and follow-up. Surg. Radiol. Anat. 2014, 36, 243–253. [CrossRef]
[PubMed]
17. Mense, S.; Hoheisel, U. Evidence for the existence of nociceptors in rat thoracolumbar fascia. J. Bodyw.
Mov. Ther. 2016, 20, 623–628. [CrossRef] [PubMed]
18. Yahia, L.; Rhalmi, S.; Newman, N.; Isler, M. Sensory innervation of human thoracolumbar fascia.
An immunohistochemical study. Acta Orthop. Scand. 1992, 63, 195–197. [CrossRef] [PubMed]
19. Stecco, C.; Stern, R.; Porzionato, A.; Macchi, V.; Masiero, S.; Stecco, A.; De Caro, R. Hyaluronan within fascia
in the etiology of myofascial pain. Surg. Radiol. Anat. 2011, 33, 891–896. [CrossRef]
20. Matteini, P.; Dei, L.; Carretti, E.; Volpi, N.; Goti, A.; Pini, R. Structural behavior of highly concentrated
hyaluronan. Biomacromolecules 2009, 10, 1516–1522. [CrossRef]
21. Pintucci, M.; Simis, M.; Imamura, M.; Pratelli, E.; Stecco, A.; Ozcakar, L.; Battistella, L.R. Successful treatment
of rotator cuff tear using Fascial Manipulation(® ) in a stroke patient. J. Bodyw. Mov. Ther. 2017, 21, 653–657.
[CrossRef]
22. Cotti, A.; Del Corso, M.; Diana, R.; Cornale, L.; Sudanese, A.; Stecco, A.; Branchini, M. Inter and Intra Operator
Reliability of Motor and Palpation Evaluation in Fascial Manipulation in individuals with coxarthrosis.
J. Man. Manip. Ther. 2019, 1–10. [CrossRef] [PubMed]
23. Cowman, M.K.; Schmidt, T.A.; Raghavan, P.; Stecco, A. Viscoelastic Properties of Hyaluronan in Physiological
Conditions. F1000Research 2015, 4, 622. [CrossRef] [PubMed]
24. Mense, S. Nociception from skeletal muscle in relation to clinical muscle pain. Pain 1993, 54, 241–289.
[CrossRef]
25. Song, Z.; Banks, R.W.; Bewick, G.S. Modelling the mechanoreceptor’s dynamic behaviour. J. Anat. 2015, 227,
243–254. [CrossRef]
26. Todd, A.J. Neuronal circuitry for pain processing in the dorsal horn. Nat Rev Neurosci. 2010, 11, 823–836.
[CrossRef]
27. Wenzke, D.R. MR imaging of the elbow in the injured athlete. Radiol. Clin. N. Am. 2013, 51, 195–213.
[CrossRef]
28. Stecco, A.; Gesi, M.; Stecco, C.; Stern, R. Fascial components of the myofascial pain syndrome. Curr. Pain
Headache Rep. 2013, 17, 352. [CrossRef]
29. Stecco, C.; Fede, C.; Macchi, V.; Porzionato, A.; Petrelli, L.; Biz, C.; Stern, R.; De Caro, R. The fasciacytes: A
new cell devoted to fascial gliding regulation. Clin. Anat. 2018, 31, 667–676. [CrossRef]
30. Phillips, K.; Clauw, D.J. Central pain mechanisms in chronic pain states - Maybe it is all in their head.
Best Pract. Res. Clin. Rheumatol. 2011, 25, 141–154. [CrossRef]
31. Sarzi-Puttini, P.; Atzeni, F.; Mease, P.J. Chronic widespread pain: From peripheral to central evolution.
Best Pract. Res. Clin. Rheumatol. 2011, 25, 133–139. [CrossRef]
© 2020 by the authors. Licensee MDPI, Basel, Switzerland. This article is an open access
article distributed under the terms and conditions of the Creative Commons Attribution
(CC BY) license (http://creativecommons.org/licenses/by/4.0/).You can also read