Estimation of the economic burden of COVID-19 using Disability-Adjusted Life Years (DALYs) and Productivity Losses in Kerala, India: A model based ...
←
→
Page content transcription
If your browser does not render page correctly, please read the page content below
Estimation of the economic burden of COVID-19 using Disability-Adjusted Life Years (DALYs) and Productivity Losses in Kerala, India: A model based analysis Denny John ( djohn1976@gmail.com ) Amrita Institute of Medical Sciences and Research Centre, Amrita Vishwa Vidyapeetham, Kochi, Kerala, India https://orcid.org/0000-0002-4486-632X M.S. Narassima Amrita School of Engineering, Coimbatore, Amrita Vishwa Vidyapeetham, India https://orcid.org/0000- 0002-4113-430X Jaideep C Menon Amrita Institute of Medical Sciences and Research Centre, Amrita Vishwa Vidyapeetham, Kochi, Kerala, India https://orcid.org/0000-0002-0786-8123 Guru Rajesh Jammy Society for Health Allied Research and Education (SHARE-INDIA), Telangana, India. https://orcid.org/0000-0002-8579-6460 Amitava Banerjee Institute of Health Informatics, University College London, London, UK Research Article Keywords: Burden of Disease, Disability-Adjusted Life Years (DALYs), Years of Potential Productive Life Lost (YPPLL), Cost of Productivity Lost (CPL), Kerala, India Posted Date: August 19th, 2021 DOI: https://doi.org/10.21203/rs.3.rs-118146/v5 License: This work is licensed under a Creative Commons Attribution 4.0 International License. Read Full License
Estimation of the economic burden of COVID-19 using Disability-Adjusted Life
 Years (DALYs) and Productivity Losses in Kerala, India: A model based
 analysis

Denny John1, M.S. Narassima2, Jaideep C Menon3, Jammy Guru Rajesh4, Amitava Banerjee5

Affiliations:

1Department of Public Health, Amrita Institute of Medical Sciences and Research Centre, Amrita Vishwa Vidyapeetham, Kochi, Kerala, India

2Department of Mechanical Engineering, Amrita School of Engineering, Coimbatore, Amrita Vishwa Vidyapeetham, India

3Cardiology, Amrita Institute ofMedical Sciences and ResearchCentre, Kochi, Kerala, India

4Society for Health, Allied Research and Education (SHARE-INDIA), Telangana, India

5Farr Institute of HealthInformatics Research, UniversityCollege London, London, UK

Corresponding Author details:

Name: Denny John

Email: djohn1976@gmail.com

Address: Department of Public Health, Amrita Institute of Medical Sciences and Research Centre, Amrita Vishwa Vidyapeetham, Kochi,

Kerala, India

ABSTRACT

Objectives: From the beginning of the COVID-19 pandemic, clinical practice and research, globally,
have centered on the prevention of transmission and treatment of the disease. The pandemic has
had a huge impact on the economy and stressed the healthcare systems worldwide. The present
study estimates Disability-Adjusted Life Years (DALYs), Years of Potential Productive Life Lost (YPPLL),
and Cost of Productivity Lost (CPL) due to premature mortality and absenteeism, secondary to
COVID-19 in Kerala state, India.

Setting: Details on sociodemography, incidence, death, quarantine, recovery time, etc were derived
from public sources and CODD-K for Kerala. The working proportion for 5-year age-gender cohorts
and corresponding life expectancy were obtained from the Census of India 2011.

Primary and secondary outcome measures: The impact of disease was computed through model
based analysis on various age-gender cohorts. Sensitivity Analysis has been conducted by adjusting
six variables across 21 scenarios. We present two estimates, one till November 15, 2020, and later
updated till June 10, 2021.

Results: Severity of infection and mortality were higher among the older cohorts, with males being
more susceptible than females in most sub-groups. The DALYs for males and females were 15954.5
and 8638.4 till November 15, 2020, and 83853.0 and 56628.3 till June 10, 2021. The corresponding

 1
YPPLL were 1323.57 and 612.31 till November 15, 2020, and 6993.04 and 3811.57 till June 10, 2021
and CPL (premature mortality) were 263780579.94 and 41836001.82 till November 15, 2020, and
1419557903.76 and 278275495.29 till June 10, 2021.

Conclusions: Most of the COVID-19 disease burden was contributed by YLL. Losses due to YPPLL
were reduced as the impact of COVID-19 infection was lesser among productive cohorts. CPL values
for 40-49 year-olds were the highest. These estimates provide the data necessary for policymakers
to work on, to reduce the economic burden of COVID-19 in Kerala.
Article summary
Strengths and limitations of this study
 - The first study to characterize the economic burden caused by COVID-19 in Kerala state
 using DALYs, YPPLL, and CPL
 - Use of public sourced data for analysis and presentation of results
 - Exclusion of incidence of case post August 20, 2020, due to unavailability of data could lead
 to an underestimation of DALYs
 - Psychological impacts of the mitigation strategies (e.g., lockdown, travel restrictions, etc.)
 that could increase mortality were not included in the scope
 - Unpaid work and presenteeism data, and data on post-recovery illness and long-term effects
 of COVID-19 have not been considered.
KEYWORDS

Burden of Disease, Disability-Adjusted Life Years (DALYs), Years of Potential Productive Life Lost
(YPPLL), Cost of Productivity Lost (CPL), Kerala, India

 2
INTRODUCTION

Since the first case of COVID-19 was reported in December 2019, COVID-19 has spread across all
countries infecting 176,705,044 people with 3,819,138 deaths and 160,737,654 recoveries
worldwide as of June 14, 2021[1]. With lower access to quality health facilities in Low-and-Middle-
Income countries has placed a sizeable proportion at a higher risk[2]. India ranks second with
29,507,438 cases and 28,148,977 recoveries as of June 14, 2021[1]. Higher infection rates have
increased the burden on healthcare systems and thus increased the fatality rate[3].

Estimating the mortality due to COVID-19 helps to understand the dynamics of the pandemic. The
role of socio-demographics, social determinants, and geography is important to assess the
differential risk levels to the disease with age, gender, and geography[4]. However, indirect effects
due to morbidity and post-COVID-19 syndromes have highlighted the far-reaching consequences of
the pandemic [5]. Also, Social Determinants of Health (SDH) often create inequalities between and
within territories disproportionately such as losses incurred by the caregivers of the infected,
frontline workers, food insecurity, work-life conditions, unemployment, etc., that have a
considerable impact on public and health systems[6]. Governments have imposed strict measures to
curtail the morbidity and mortality caused by COVID-19. Individual-level measures such as self-
isolation and social distancing and population-level measures like lockdowns are widely adopted to
limit spread[2,7,8]. The SDH plays a vital role in strategizing the interventions especially in LMICs
where there are differences in socioeconomic strata [6]. Quantifying the health and economic
impact of COVID-19 would be a reflection of the policy decisions taken[9]. Economic impact
assessment is highly important in countries/ territories like India and states such as Kerala where
most of the infected people have recovered.

In India, the first case of COVID-19 was reported in Kerala on January 30, 2020. Timely interventions
such as contact tracing, testing, quarantine, isolation, and treatment had reduced the spread of the
disease in Kerala[10]. The number of cases in Kerala has now reached 2,728,239 with 11,181 deaths
and 2,593,625 recoveries as of June 13, 2021. The resulting economic burden of COVID-19 in the
state thus appears to be substantial. Therefore, this present study aimed to estimate economic
burden and productivity loss using Disability-Adjusted Life Years (DALYs), Years of Potential
Productive Life Lost (YPPLL), and Cost of Productivity Lost (CPL)and their effects on age and gender
for the state of Kerala.

 3
METHODS

Data Collection

The present work is an age-gender cohort-based observational study to estimate the DALYs and
productivity losses due to COVID-19 in Kerala, India. The effect of multimorbidity has been
considered to compute the Burden of Disease (BoD). Human Capital Approach has been adopted to
estimate productivity losses. Publicly available data from various sources have been used to gather
sociodemographic details, information about the incidence, death due to COVID-19, information on
quarantine, per capita income, etc., for the state of Kerala[11–13]. The first reported case of COVID-
19 in Kerala dates back to January 30, 2020, from when the estimates for the present study have
been collected[12,13].

The 5-year age-gender population of Kerala, working population in each age-gender cohort, and the
corresponding life expectancies were obtained from the 2011 Census of India[11]. Incidence data
documented by Team Collective for Open Data Distribution-Keralam (CODD-K) was till August 20,
2020, was used to classify the incidence of the age-gender cohort (Table S I). Out of 52,199 reported
cases till August 20, 2020, data of 7645 patients were excluded as they did not contain information
on age and gender[12]. Recovery time documented by the team for 1,012 patients in Kerala was
used from CODD-K [12]. Data for the number of deaths were extracted from the Government of
Kerala dashboard and CODD-K [12,13]. The infections were categorized as mild, moderate, and
severe/ critical[13,14]. Further, estimates updated till 2021 have also been presented throughout all
of which will hereon be indicated using a subscript ‘2021’. Table I presents the information on
various parameters used for the study.

 Table I: Parameters used for the study.

 Values
 Parameters Reference Till Date
 Value Sensitivity Analysis (SA)*
 Number of cases
 10% (S12), 20% (S13) and 30% (S14) 20-Aug-
Actual 52199 [3,12]
 increase in infected cases 20
Valid records 44554
 Number of deaths
 10% (S18), 20% (S19) and 30% (S20) 10-Jun-
Actual 1869 [3,12,13]
 increase in deaths 2021
Valid records 1841
 Quarantine 10% (S15), 20% (S16) and 30% (S17) 29-Aug-
 [12,13]
Home (Mild cases) 158543 increase in mild cases 20

 4
Hospital 14646
 Severity
 -
Moderate 80% [14] NA
Severe/ Critical 20%
Disability weights (average: S3, S4, S5); (lower: S6, S7, S8, upper: S9, S10,
 S11) – Three methods of DW calculation in each case (Table S II)
Whopping cough 0.051 (0.032, 0.074)
Severe paratyphoid
 0.133 (0.088, 0.19)
fever
Asthma 0.043 (0.036, 0.05)
Moderate iron-
 0.052 (0.034, 0.076)
deficiency anemia
Mild diarrheal diseases 0.074 (0.049, 0.104)
Mild symptomatic
peptic ulcer disease 0.011 (0.005, 0.021)
 [3,15–17] NA
without anemia
Pharyngitis 0.070 (0.07, 0.07)
Symptomatic tension-
 0.037 (0.022, 0.057)
type headache
Moderate angina due to
 0.080 (0.052, 0.113)
ischemic heart disease
Moderate symptomatic
peptic ulcer disease 0.118 (0.081, 0.163)
with mild anemia
Moderate other mental
 0.133 (0.091, 0.186)
disorders
Life Expectancy for age-
 25% (S1) and 50% (S2) decrease [3,11] NA
gender cohort
Burden of isolation
after discharge/ 0 2 weeks isolation (S21) [3] NA
recovery

 Recovery time for age-gender cohort (Duration of Disability) Available
 [12]
 Age group Time to Age group Time to recovery for 1012

 5
recovery (days) patients
 (days)
 0 to 1 13.00 45 to 50 13.49
 1 to 5 17.55 50 to 55 15.55
5 to 10 14.40 55 to 60 13.57
10 to 15 15.59 60 to 65 13.61
15 to 20 13.94 65 to 70 18.94
20 to 25 13.82 70 to 75 15.00
25 to 30 13.16 75 to 80 11.57
30 to 35 14.07 80 to 85 15.00
35 to 40 13.54
 85+ 17.33
40 to 45 15.26
 Life expectancy at age of death (L)
 Age Male Female
 0 to 1 72.5 77.9
 1 to 5 72.3 77.8
 5 to 10 68.4 73.9
 10 to 15 63.4 69.0
 15 to 20 58.6 64.1
 20 to 25 53.7 59.2
 25 to 30 48.9 54.4
 30 to 35 44.2 49.5
 35 to 40 39.5 44.7 [11] NA
 40 to 45 34.8 39.9
 45 to 50 30.3 35.1
 50 to 55 25.9 30.5
 55 to 60 21.8 26.2
 60 to 65 17.9 21.9
 65 to 70 14.3 17.9
 70 to 75 11.4 14.3
 75 to 80 8.6 11.0
 80 to 85 6.2 7.9
 85+ 4.5 5.6

 6
Discount rate for value
 2.90% - [18] NA
of life

Age-gender population
 Table S
Age-gender working - [11] NA
 III
population

Discount rate (Financial
 4.25% - [19] 6-Nov-20
Benchmark)

Stay in Intensive Care
 8 days - [20,21] NA
Unit (ICU)
Retirement age in
 56 - [22] NA
Kerala (years)
Number of working
 6 - [23] NA
days in a week
Per capita Gross
 221904I
Domestic Product (GDP) - [24] 2020
 NR/ year
in Kerala
*- Scenarios of Sensitivity Analysis have been denoted from S1 to S21. A detailed description is
provided in table S IV

Estimation of the distribution of cases till June 10, 2021

The distribution of cases for age-gender cohorts in Kerala in 2020 and India in 2020 & 2021 was used
to estimate the distribution of cases in Kerala till June 10, 2021 (Table S I). The rationale behind the
method is that the percentage deviations in distribution of cases for each age-gender cohort in India
then (2020) and now (2021) and those of Kerala are assumed to be the same. In this way, the
distribution of cases for age-gender cohorts has been computed till June 10, 2021 (Table S V). The
actual cases in Kerala as of June 10, 2021, is 2,688,590 while our estimates cumulate to 2,688,516
with an error of 0.0028%.

Disability-Adjusted Life Year (DALY)

DALYs are standard measures to estimate the burden of disease in public health and are calculated
as the sum of Years Lived with Disability (YLD) and Years of life lost (YLL)[3,9,25]. DALYs take into
account the disability caused by the disease (YLD) and the premature mortality (YLL)[9]. Determining
YLLs, YLDs and DALYs would allow us to measure the shortfall of the deceased and life years lost.
YLLs explain the loss incurred as a result of death due to an event by comparing it with the years that

 7
they would have lived otherwise. YLLs become high in case of either higher mortality or mortality of
younger people or both[4]. Years of Potential Productive Life Lost (YPPLL) and Cost of Productivity
Lost (CPL) are widely adopted measures that majorly explain the economic burden due to an
event[26].

DALYs were calculated using an incidence-based approach[3,18]. DALY estimates were obtained for
the age-gender split to identify the more vulnerable groups[9]. Though incidence-based approaches
do not consider the severity of diseases, owing to the diverse impact of COVID-19, severity was
considered to assign the Disability Weights (DW)[3]. Initial estimates of YLDs are presented only till
August 20, 2020, DALYs estimated in this study are certainly an underestimation. However, YLDs
contribute only a minor share to the DALY estimates[3,9,27]. Discounting for the value of life
(discount rate of 2.9%) was used in the calculation of DALYs[18]. DALYs with no discounting have
also been presented in table II. DWs were chosen based on the symptoms experienced by patients
and were varied based on the severity of infection. The proportion of home quarantine cases were
considered to be mild, whilst the proportion of hospitalized cases was further split into moderate
and critical (table I). The symptoms, proportion of people experiencing each symptom, and
corresponding DWs are presented in table S II[28].

 ∗ ∗ ( 1− − )
 = (1)

where r = discount rate; D = disability duration (years); I = number of incident cases

 = (1 − − ) (2)

where L = life expectancy at age of death (years); N = number of deaths.

 = + (3)

Most of the BoDstudies do not consider multimorbidity, which might produce inaccurate
estimates[25]. Three methods for calculation of Combined Disability Weights (CDW) for
multimorbidity as reported by Hilderlink et al (2016) viz. additive, multiplicative, and maximum limit
methods, were employed in this study[25].

 = + (4)

 = 1 − (1 − ) ∗ (1 − ) (5)

 = max ( , ) (6)

where ‘i’ and ‘j’ indicate the DWs of ‘i’th and ‘j’th disabilities.

 8
Productivity Losses (YPPLL and CPL)

YPPLL defines the number of productive years an average person would have lived otherwise. The
working population proportion of each cohort was multiplied with the YPPLL to estimate the CPL lost
due to morbidity and absenteeism. Recovery days for the severe cases were extended by 8 days to
account for the ICU stay. Productivity losses were estimated using the Human Capital Approach
considering absenteeism and premature mortality for temporary and permanent losses
respectively[9,29]. For calculation of productivity losses, people from age groups 15 to 60 were
chosen considering the employment age[30] and retirement age of Kerala[22]. [18,31].

 = ∑ =1 ∗ ∗ | = 1, 2, … , (7)

where ‘i’ represents ‘n’ age-gender cohorts; Di = deaths at age; wi= productive years remaining at
age of death (years); d = discount rate for the value of life as proposed by Reserve Bank of India
(RBI)[19]. were selected[19]. These are applicable for every year excluding the first year[32]. CPL for
premature mortality and absenteeism was computed as shown in Eqn. (8) and (9).

 = ∑ =1 ∗ ∗ (8)

 = ∑ =1 ∗ ∗ ∗ (9)

where S = average salary per day considering the number of paid working days per week as six; Lj =
average recovery time; N = Number of incident cases; P = proportion of the working population, in
cohort ‘j’. For the computation of productivity losses, the proportion of the working population was
considered along with an extended disability period for severe cases to account for the ICU
stay[20,21].

Sensitivity Analysis (SA)

A spectrum of scenarios (table S IV) was considered to analyze the effect of each parameter on the
DALY estimates. The key idea of performing SA is to assist policymakers to anticipate the effects
brought in by each of the driving variables. As most of the deceased cases had underlying health
conditions that reduce the life expectancy, Scenario 1 (S1) and Scenario 2 (S2) have been
developed[4,33]. Increasing the number of mild cases, overall cases and deaths are conservative
analyses to help the healthcare fraternity and policymakers[3].

Validation

To ensure credibility, the data related to COVID-19 (Table I) were collected from various official
sources, reports, and published works [3,11–17,20,21]. Discount rates for the Financial Benchmark

 9
and the value of life were taken into account on the values defined by the Reserve Bank of India
[19]and Shanmugam (2011) [18] respectively. For the computation of the DALY, three different
approaches to calculate the CDW as mentioned by Hilderink et al (2016) were used [25]. The DALY
estimates and productivity losses were computed as done by Wyper et al. (2020) [34]and Rumisha et
al. (2020)[35].

Patient and public involvement

The data used for inputs and analysis were derived from public sources (such as websites) and
published literature. Our research question for estimating economic burden and productivity loss in
Kerala was aimed based on the rise in the number of cases in Kerala from July to November 2020.
The increase in the number of cases would also mean the increased productivity losses due to
COVID-19 for patients and their family members especially those who died or were hospitalised due
to COVID-19. However, as our model based analysis used data from published sources such as
publications, and websites, and modeling methods, patients and/or the public were not involved in
the design, or conduct, or reporting, or dissemination plans of the research.

Cohort description

From July 2020 to June 2021 there was a significant rise in the number of COVID-19 cases in Kerala.
The increase in the number of cases would also mean increased economic loss due to COVID-19 for
patients and their family members, mainly due to the rise in hospitalisations and deaths. We did not
involve any patients in the design of this study as we used publicly available sources. However, we
aim to disseminate the findings of this paper through various media channels post-publication to
reach out to policymakers and the general public in the state of Kerala.

RESULTS

From the distribution of cases and deaths (figure S1 (till Nov 15, 2020), S2 (till June 10, 2021)), it is
clear that older adults are disproportionately vulnerable to be severely affected by the disease.
Though the age group of 25 to 30 males and females account for 13.45% and 11.06% of the total
number of cases, their proportionate mortality remains as low as 0.80% and 1.17% respectively
(figure S1). Contrastingly, while the male and female proportion of cases for the age group 65 to 70
is only 2.11% and 2.75% of the overall cases, their proportionate mortality remains as high as 17.88%
and 13.13% respectively (figure S1). The 2021 estimates confirm that the elderly people from age
groups 55 to 70 (figure S2) are affected high as their proportionate mortality is 39.99% though their
proportionate incidence is as low as 12.34%.

 10
DALY estimates calculated using the average DW scores using the additive method were considered
as the baseline scenario for Sensitivity Analysis (SA). From table S VI, it is clear that the YLL is the
major proportion of DALYs (Discounted), with Male and Female YLL and YLL2021 of age group 60 to 65
cumulating to 16.58% & 16.46% and 16.21% & 15.43% respectively. Since the cohort does not fall
into the productive population (considering the employment age), these might not impact the
productivity losses. Considering the YLLs and DALYs in the productive population, the YLLs and DALYs
of males and females are the highest for the age group 55 to 60. Comparing the discounted and
undiscounted DALYs, we see that the undiscounted DALY and DALY2021 of males and females are
36.02% & 44.15% and 33.1% and 38.52% higher than those of the discounted ones. The discount
rate for the value of life was considered as 2.90% for all the scenarios in the study [18]. Also, the
DALYs per million and DALY2021 per million were estimated to be 709.2 and 4050.99 based on the
projected population of Kerala for the year 2020 which is 34,678,294[36].

 Table II: DALY estimates for the baseline scenario (S3)

 DALYs till Nov 15, 2020 DALYs till June 10, 2021
 Age Discounted Undiscounted Discounted Undiscounted
 M F M F M F M F
0 to 1 30.3 61.8 72.6 155.9 63.7 64.8 145.1 155.9
1 to 5 0.4 0.4 0.4 0.4 50.7 19.7 72.7 0.4
5 to 10 0.3 0.3 0.3 0.3 47.4 15.5 68.7 0.3
10 to 15 58.4 30.1 127.2 69.3 114.1 80.5 190.6 138.3
15 to 20 57.0 58.6 117.8 128.6 265.0 200.8 469.4 385.0
20 to 25 137.3 113.8 269.7 237.5 590.7 465.0 1021.5 888.7
25 to 30 262.7 192.2 490.4 381.4 893.3 639.8 1517.3 1197.4
30 to 35 126.0 132.0 222.4 248.1 1583.7 1168.2 2653.4 2129.1
35 to 40 636.2 351.3 1067.8 626.3 3581.9 1862.3 5886.8 3263.6
40 to 45 899.7 189.7 1428.1 319.8 5050.7 2306.4 7900.9 3831.0
45 to 50 1150.2 507.0 1728.1 807.8 6874.1 4193.9 10242.4 6634.4
50 to 55 1603.7 952.0 2280.2 1434.0 9240.0 5943.5 13054.6 8906.5
55 to 60 2343.5 1413.5 3161.6 2017.8 11231.3 8078.1 15108.0 11502.2
60 to 65 2639.5 1426.8 3383.5 1927.5 13502.1 8690.6 17273.9 11716.8
65 to 70 2610.8 1089.5 3189.4 1396.5 11711.3 7826.5 14271.9 10006.4
70 to 75 1669.8 983.4 1961.0 1201.3 9513.7 6775.0 11160.8 8265.5
75 to 80 898.2 508.6 1014.8 594.0 5201.8 4080.8 5873.8 4763.0
80 to 85 556.2 430.7 607.6 482.0 2908.8 2637.2 3174.4 2946.8
85+ 274.3 196.5 292.5 212.8 1428.5 1579.8 1521.0 1708.0
Total 15954.5 8638.4 21415.5 12241.5 83853.0 56628.3 111607.3 78439.5

Figure S3 a) to i) and figure S4 a) to i) show that on the whole, the DALYs for males are higher than
those of females except for the age groups 30 to 35, 15 to 20, and less than 10. About 47.69% and
45.34% of overall DALYs, and 43.46% and 43.43% of the overall DALY2021 for males and females

 11
respectively are from the age groups 55 to 70. It is highly disproportionate as the number of cases
from these age groups piles up to only 11.13% and 13.11% (2020), and 11.32% and 13.37% (2021) of
cases for males and females respectively. Figure S3 and figure S4 present the DALYs calculated for
the nine different scenarios (refer Table S II) that involve altering the DW calculation methods and
values.

To measure the impact of the disease on the productivity of the state, YPPLL and CPL were
calculated among the productive age group of 15-60 years. The age group 25-49 being the majority
is the prime contributor to productivity. Fortunately, there is a relatively lesser impact of the
infection in terms of duration of illness and mortality for these age groups, which has reduced the
losses to some extent (Table III). Recovery days mentioned in table S III are exclusive of the ICU stay
of severe cases.

Table III shows that the CPL values for people aged from 40-49 years were the highest, and
constituted about 51.34% and 41.76% of the total CPL values (for premature mortality) of males and
females respectively. CPL values for absenteeism are also the highest for the same age cohort for
both males and females accounting for up to 26.53% and 31.35% respectively. CPL2021 (for premature
mortality) gets the highest shares of 58.98% and 58.73% from male and female cohorts of the 41-50
age group (Table IV). Similarly, CPL2021 has a maximum of 25.89% and 30.96% from the same cohorts
respectively.

 Table III: YPPLL, CPL (Mortality and Absenteeism) till November 15, 2020

 Years of Potential
 Age- Cost of Productivity Lost (CPL) – Cost of Productivity Lost (CPL) -
 Productive Life Lost
 Group Death Morbidity
 (YPPLL)
 Males Females Males Females Males Females
 15-19 8.02 16.04 200,004.28 144,074.81 1,308,538.75 325,006.38
 20-24 43.05 25.83 5,009,096.46 849,735.38 13,824,381.71 2,252,069.57
 25-29 81.38 54.25 15,385,047.11 2,675,078.71 28,999,248.30 3,130,470.52
 30-34 46.07 46.07 9,543,101.81 2,934,692.41 32,044,805.25 4,055,127.61
 35-39 197.61 107.79 41,717,765.16 8,623,040.56 28,976,931.25 4,149,430.14
 40-49 646.28 215.43 135,448,141.17 17,470,735.95 48,999,357.83 9,131,773.54
 50-59 301.17 146.91 56,477,423.96 9,138,644.00 30,872,800.27 6,134,611.07
 Total 263,780,579.94 41,836,001.82 185,026,063.37 29,178,488.82
 Table IV: YPPLL, CPL (Mortality and Absenteeism) till June 10, 2021 (Refer Table S VII for incidence
 and deaths)

 Years of Potential
 Age- Cost of Productivity Lost (CPL) – Cost of Productivity Lost (CPL) -
 Productive Life Lost
 Group Death Morbidity
 (YPPLL)
 Males Females Males Females Males Females
 16-20 65.17 48.88 1,625,265.52 439,040.27 102,297,314.03 23,652,339.15

 12
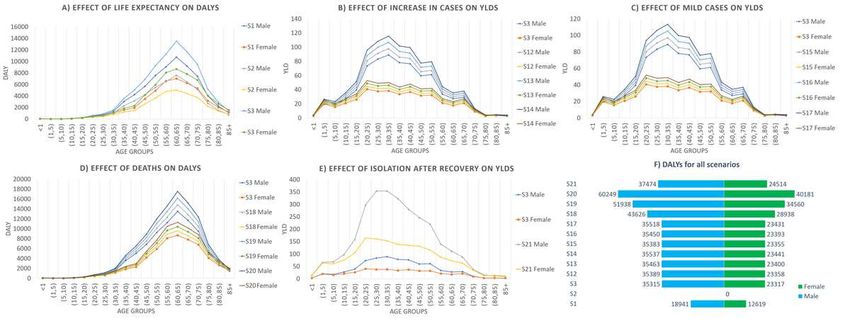
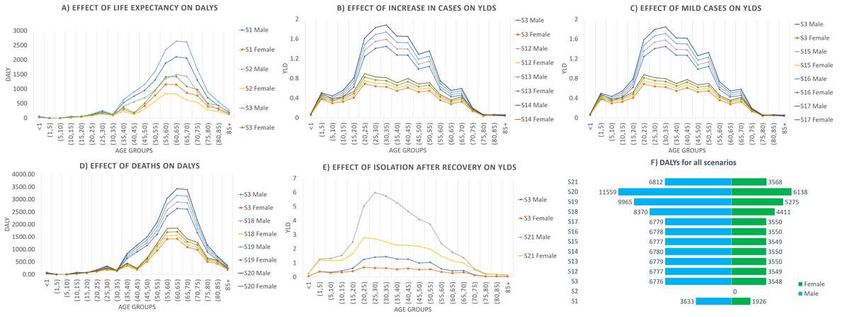
21-25 165.51 130.67 19,259,902.22 4,298,973.72 886,623,358.12 140,085,916.15
 26-30 282.14 200.23 53,340,135.18 9,872,885.34 1,831,188,038.59 187,207,907.26
 31-35 552.34 395.84 114,409,861.84 25,214,693.78 1,875,906,232.92 243,394,778.33
 36-40 1321.80 647.59 279,048,434.48 51,808,021.93 1,788,669,340.39 262,987,085.64
 41-50 3994.98 2015.17 837,278,167.58 163,427,668.31 2,860,063,434.24 541,756,862.03
 51-59 611.09 373.19 114,596,136.95 23,214,211.95 1,703,001,999.97 350,660,556.84
 Total 1,419,557,903.76 278,275,495.29 11,047,749,718.26 1,749,745,445.40

SENSITIVITY ANALYSIS (SA)

Figure 1 a) to e) and 1 f) present SA explaining the role of each variable to economic burden to
provide a better interpretation of the changes and comparison of the DALY estimates across all the
scenarios for 2020. Figure 2 a) to e) and 2 f) present similar results for 2021 estimates. From figure 1
a) it is evident that the reduction in life expectancy by 25% and 50% reduced the DALYs by 19.7%
and 42.47% for males and 18.78% and 41.08% for females respectively. Likewise, DALY2021 reduced
by 19.53% and 42.11% for males and 18.89% and 41.17% for females respectively (figure 2a)). For
figure 1 b), c) and e), and figure 2 b), c) and e), only YLDs were compared as the variables adjusted in
these scenarios do not alter the YLLs. Comparing the DALY estimates might not explain the effect of
variables clearly. For figure 1 a) and d), and figure 2 a) and d) the DALY estimates were directly
compared. Increasing the overall cases by 10%, 20%, and 30% increased the YLDs proportionately
equal to the percentage increase in the number of cases. An increase in the mild cases by 10%, 20%,
and 30% increased the YLDs by 9.15%, 18.31%, and 27.46% respectively for both male and female
cohorts. An increase in deaths by 10%, 20%, and 30% increased the DALYs by 9.91%, 19.91%, and
29.9% respectively for both male and female cohorts. The increase of the burden of isolation of two
weeks increased the YLDs from 12.24 to 48.01 for males and from 6.88 to 26.74 for females, and
YLD2021 from 738.82 to 2897.92 for male and from 414.90 to 1612.10 for females.

Three different approaches for average, lower and upper limit values of DW have been used to
arrive at YLDs. DALYs are seen to be the highest when the number of deaths is altered. The DALYs
increase by 29.9% from that of S3 for both cohorts when the number of deaths increases by 30%.
These values would be still higher if the mortality among younger cohorts is high owing to their
longer life expectancy during the age of death.

 13
DISCUSSION

Main findings of this study

In this study, for the baseline scenario, YLLs were 15942.3 and 8631.6 and the YLDs were 12.2 and
6.9 for males and females. Also, YLL2021 were 83114.1 and 56213.4 and the YLD2021 were 738.8 and
414.9 for males and females. DALYs and DALY2021 were estimated as 709.2 per million and 4050.99
per million population based on the year 2020 population projections [36]. However, the DALY
estimate will be impacted by the quality of the data reported. Based on an article published by the
BBC, deaths due to COVID-19 as estimated by the volunteers are 3,356 which is 70.44% higher than
the officially reported count 1969 as of November 19, 2020[13,37]. Considering the effect of
asymptomatic cases that act as latent spreaders, DWs due to presenteeism, and unpaid work could
increase the losses [38]. These facts are concerning as the actual DALYs might be way higher than
those estimated using official figures.

The DALY2021 estimates sum up to 83853 and 56628.3 for males and females respectively indicating a
very high impact of the pandemic. The YLL2021 were computed to be 83114.1 and 56213.4 for male
and female with YLD2021 are only 738.8 and 414.9 for male and female. Reports state that the second
wave has affected the younger population significantly, unlike the first. The distribution of cases
among age groups 21-30, 31-40, and 41-50 till May 31, 2021 are 2,61,232, 2,52,935, and 2,33,126
people respectively. Also, 18% of the people who died during April and May 2021 in the state were
not co-morbid[39].

In addition, the productivity losses in terms of YPPLL and CPL for mortality and absenteeism for the
productive population (15 to 60 years of age) were estimated. Multimorbidity was taken into
account for the calculation of CDW. CPL values (for premature mortality) for a younger population
less than 25 years of age just 1.97% and 2.37% for males and females respectively. Likewise,
CPL2021(premature mortality) for the same cohorts constitute 1.47% and 1.70% respectively. This is
because of the lesser proportion of people working in this age group and also the lesser impact of
the disease in terms of mortality. Considering the CPL due to absenteeism, the values for younger
people less than 25 years of age are 8.16% and 8.83% for males and females respectively. A similar
trend is observed in CPL2021 due to absenteeism with 8.95% and 9.36% contribution from males and
females less than 25 years of age. This is higher compared to that of the deaths because of a
relatively lower proportion of people dying due to infection.

 14
What is already known on this topic

Several researchers have been conducting researches to estimate the economic burden and
productivity losses of various diseases around the globe such as the estimation of YLLs due to COVID-
19 in the US[4], India[27]& Swiss[7], DALYs due to COVID-19 in Korea[3]& Italy[9], YPPLL due to
Cancer in Brazil, Russia, India, China, and South Africa (BRICS)[40], YPPLL due to five leading causes
of deaths in Iran[26], productivity loss due to Cardiovascular disease and mental illness in India[38],
etc. COVID-19 has created a significant impact across the globe, some of which include 1.2 million
YLLs in the US from 1 Feb 2020 to 11 July 2020[4]; 2 million YLL in India as of October 17, 2020[27];
1.75 million YLLs due to mass confinement of 3 months in Switzerland[7]; 2531 DALYs in Korea
between January 20, 2020, and April 24, 2020, with YLLs and YLDs constituting 89.7% and 10.3%
respectively[3]; and 121449 DALYs, productivity losses of EUR 300 million and EUR 100 million due to
premature mortality and absenteeism respectively, in Italy[9].

What this study adds

As is evident from this study, the disease has impacted the older population to a greater extent. The
proportion of cases for the age group 65 to 70 in Kerala is only 2.11% and 2.75% of the overall cases
whilst their deaths remain as high as 17.88% and 13.13%. Other studies reveal a similar trend of the
disease which provides strong insights for more care to be given to the elderly. Indrayan and Mishra
(2020) found that the relative incidence of younger age group (
SA has been vastly adopted by researchers to depict the influence of one or more variables on the
outcome(s)[3,4]. A total of 21 scenarios by adjusting six variables were analyzed in the study for
2020 and 2021 estimates. The increase in the number of deaths highly increased the DALYs whereas
the reduction in life expectancy reduced the DALYs. Reducing life expectancy could be related to
practical findings of researchers. The majority of the older patients have had underlying medical
conditions such as pneumonia (68.8%), hypertension (34.4%), diabetes mellitus (50%), and chronic
obstructive airway disease (15.6%)[42], 89.3% of the older adults (65 or more) contained
comorbidities[28].

Limitations of this study

Exclusion of incidence of cases post August 20, 2020, for estimation of DALYs due to unavailability of
open data, has led to a certain underestimation. Also, the psychological impacts of the mitigation
strategies are a potential risk that could increase mortality and are not in the scope of the present
study[7]. Most of the policies have not considered mental illness and allied problems[7,43,44].
Though YLDs contribute a minor proportion in DALY, including factors such as unpaid work and
presenteeism might improve the accuracy. In Kerala, about 30 and 10 percent of recovered patients
have experienced post-recovery illness and long-term effects, which have not been considered in the
study, resulting in an underestimation of YLDs[45]. Data on the number of deaths from Madhya
Pradesh (MP), Andhra Pradesh (AP), and a part of Tamilnadu indicate that these estimates could be
possible under-reporting, and this might be the case for Kerala as well [46]. The "excess deaths"
approach shows a clear spike in deaths. In May 2020, MP and AP reported 34,320 and 27,100 deaths
whereas the deaths in May 2021 have reached 1,64,838 and 1,20,845. Not all these could be directly
attributed to COVID-19 as some relate to the deaths due to shortage of oxygen and burden on
hospitals [46].

CONCLUSION

In conclusion, this is the first study to characterize the economic burden caused by COVID-19 in
Kerala state using DALYs, YPPLL, and CPL. YLL contributed most to the disease burden due to COVID-
19. Losses due to YPPLL were reduced as the impact of COVID-19 infection was relatively lesser
among the productive age groups. People aged from 40-49 years reported the highest CPL values.
Decision-makers could use these estimates and aim to focus and make efforts on reducing the
economic burden for the longer impact of COVID-19 in Kerala state.

The methodological framework used in this study can be applied to other states in India, and other
developing countries where the disease notification data are collected by the government and are

 16
available in the public domain. Estimation of economic burden using DALYs, YPPLL, and CPL
attributable due to COVID-19 in other states in India and developing countries could provide the
basis of inter-state comparison, and prioritization of healthcare resources in resource-limited
settings. Sub-group analysis would give deeper insights into the most vulnerable cohorts that require
special attention to minimize the losses.

Acknowledgment: We like to sincerely thank Dr. Geetha R Menon, Scientist E, ICMR-National
Institute of Medical Statistics, New Delhi for her comments towards improving this manuscript.

Contribution statement: The conception and design of the study, or acquisition of data, or analysis
and interpretation of data – DJ, NMS, JM, Drafting the article or revising it critically for important
intellectual content – NMS, DJ, JM, JGR, AB, Final approval of the version to be submitted – JM, DJ,
JGR, AB

Funding: No funding support was received for this study.

Competing interests: The authors declare that they have no known competing financial interests or
personal relationships that could have appeared to influence the work reported in this paper.

Patient and public involvement: Patients and/or the public were not involved in the design, or
conduct, or reporting, or dissemination plans of the research.

Patient consent for publication: Not required.

Data sharing statement: All data that is incorporated into the article is available from the references
mentioned. Raw data has been uploaded in the following link:
https://doi.org/10.6084/m9.figshare.14999616

Ethical statement: The study has been conducted using publicly available data. No ethical approvals

were sort for this study.

REFERENCES

1 Worldometer. COVID-19 Coronavirus Pandemic. 2020.

2 Laxminarayan R, Wahl B, Dudala SR, et al. Epidemiology and transmission dynamics of COVID-
 19 in two Indian states. Science (80- ) 2020;370:691–7.

3 Jo MW, Go DS, Kim R, et al. The burden of disease due to COVID-19 in Korea using disability-
 adjusted life years. J Korean Med Sci 2020;35:1–10. doi:10.3346/jkms.2020.35.e199

4 Quast T, Andel R, Gregory S, et al. Years of life lost associated with COVID-19 deaths in the

 17
United States. J Public Health (Bangkok) 2020;:1–6. doi:10.1093/pubmed/fdaa159

5 Horton R. Offline: COVID-19 is not a pandemic. Lancet. 2020;396:874. doi:10.1016/S0140-
 6736(20)32000-6

6 WHO. WHO Coronavirus disease 2019 (COVID-19) Situation Report - 73. 2020;:1–13.

7 Moser DA, Glaus J, Frangou S, et al. Years of life lost due to the psychosocial consequences of
 COVID-19 mitigation strategies based on Swiss data. Eur Psychiatry 2020;63:1–7.
 doi:10.1192/j.eurpsy.2020.56

8 Neil M F, Daniel L, Gemma N-G, et al. Impact of non-pharmaceutical interventions (NPIs) to
 reduce COVID-19 mortality and healthcare demand. Imp Coll COVID-19 Response Team
 Published Online First: 2020. doi:https://doi.org/10.25561/77482

9 Nurchis MC, Pascucci D, Sapienza M, et al. Impact of the burden of COVID-19 in italy: Results
 of disability-adjusted life years (dalys) and productivity loss. Int J Environ Res Public Health
 2020;17:1–12. doi:10.3390/ijerph17124233

10 Menon JC, Rakesh PS, John D, et al. What was right about Kerala’s response to the COVID-19
 pandemic. BMJ Glob Heal 2020;5:1–5. doi:10.1136/bmjgh-2020-003212

11 Office of the Registrar General & Census Commissioner. Ministry of Home Affairs,
 Government of India. 2020.

12 Team CODD-K | covid19kerala.info. 2020.

13 C-DIT. GoK Dashboard | Official Kerala COVID-19 Statistics. 2020.

14 Aylward, Bruce (WHO); Liang W (PRC). Report of the WHO-China Joint Mission on
 Coronavirus Disease 2019 (COVID-19). 2020.

15 Wang H, Naghavi M, Allen C, et al. Global, regional, and national life expectancy, all-cause
 mortality, and cause-specific mortality for 249 causes of death, 1980–2015: a systematic
 analysis for the Global Burden of Disease Study 2015. Lancet 2016;388:1459–544.
 doi:10.1016/S0140-6736(16)31012-1

16 Salomon JA, Haagsma JA, Davis A, et al. Disability weights for the Global Burden of Disease
 2013 study. Lancet Glob Heal 2015;3:e712–23. doi:10.1016/S2214-109X(15)00069-8

17 Ock M, Lee JY, Oh IH, et al. Disability weights measurement for 228 causes of disease in the
 Korean burden of disease study 2012. J Korean Med Sci 2016;31:S129–38.

 18
doi:10.3346/jkms.2016.31.S2.S129

18 Shanmugam KR. Discount Rate for Health Benefits and the Value of Life in India. Econ Res Int
 2011;2011:1–5. doi:10.1155/2011/191425

19 Reserve Bank of India. Ratios and Rates. © Reserv. Bank India. All Rights Reserv.

20 Phua J, Weng L, Ling L, et al. Intensive care management of coronavirus disease 2019 (COVID-
 19): challenges and recommendations. Lancet Respir Med 2020;8:506–17.
 doi:10.1016/S2213-2600(20)30161-2

21 Rees EM, Nightingale ES, Jafari Y, et al. COVID-19 length of hospital stay: A systematic review
 and data synthesis. BMC Med 2020;18. doi:10.1186/s12916-020-01726-3

22 Kerala Kaumudi Online. Govt mulls extension of retirement age as it considers deferring
 salary cut plan - Kerala - General. 2020.

23 ExcelNotes. Working Days in Kerala, India in 2020.

24 MOSPI. Ministry of Statistics and Program Implementation. Gov. India.
 2021.http://mospi.nic.in/ (accessed 13 Mar 2021).

25 Hilderink HBM, Plasmans MHD, Snijders BEP, et al. Accounting for multimorbidity can affect
 the estimation of the Burden of Disease: A comparison of approaches. Arch Public Heal
 2016;74. doi:10.1186/s13690-016-0147-7

26 Najafi F, Karami-Matin B, Rezaei S, et al. Productivity costs and years of potential life lost
 associated with five leading causes of death: Evidence from Iran (2006-2010). Med J Islam
 Repub Iran 2016;30:1–8.

27 Indrayan A, Mishra A. Preliminary Estimates of Years of Life Lost (YLL) Due to COVID-19 in
 India. medRxiv 2020;:1–10.

28 Garg S, Kim L, Whitaker M, et al. Hospitalization Rates and Characteristics of Patients
 Hospitalized with Laboratory-Confirmed Coronavirus Disease 2019 — COVID-NET, 14 States,
 March 1–30, 2020. Morb Mortal Wkly Report, US Dep Heal Hum Serv Dis Control Prev
 2020;69:458–64.

29 Kirch W, editor. Human Capital Approach. Encycl. Public Heal. 2008;:697–8. doi:10.1007/978-
 1-4020-5614-7_1583

30 India Development Gateway (InDG). Child Labour — Vikaspedia. 2020.

 19
31 SISA Research paper. Quantitative Skills - Consultancy for Research and Statistics. Calculating
 the discounted YPLL - annotated.

32 Michael F. D, Mark J. S, Karl C, et al. Methods for the Economic Evaluation of Health Care
 Programmes. Fourth Edi. Oxford, United Kingdom: : Oxford University Press 2015.

33 Hanlon P, Chadwick F, Shah A, et al. COVID-19 – exploring the implications of long-term
 condition type and extent of multimorbidity on years of life lost: a modelling study. Wellcome
 Open Res Published Online First: 2020. doi:10.12688/wellcomeopenres.15849.1

34 Wyper GMA, Assunção RMA, Colzani E, et al. Burden of Disease Methods: A Guide to
 Calculate COVID-19 Disability-Adjusted Life Years. Int J Public Health 2021;66:1–7.
 doi:10.3389/ijph.2021.619011

35 Rumisha SF, George J, Bwana VM, et al. Years of potential life lost and productivity costs due
 to premature mortality from six priority diseases in Tanzania, 2006-2015. PLoS One
 2020;15:2006–15. doi:10.1371/journal.pone.0234300

36 Census2011. Kerala Population Sex Ratio in Kerala Literacy rate data 2011-2020.

37 Biswas S. India coronavirus: How a group of volunteers ‘exposed’ hidden Covid-19 deaths -
 BBC News. BBC News Serv. 2020.

38 Fathima F, Kahn J, Krishnamachari S, et al. Productivity losses among individuals with
 common mental illness and comorbid cardiovascular disease in rural Karnataka, India. Int J
 Noncommunicable Dis 2019;4:86–92. doi:10.4103/jncd.jncd_17_19

39 Second wave impacted youth more: Minister - The Hindu. The Hindu.
 2021.https://www.thehindu.com/news/national/kerala/second-wave-impacted-youth-more-
 minister/article34754237.ece (accessed 14 Jun 2021).

40 Pearce A, Sharp L, Hanly P, et al. Productivity losses due to premature mortality from cancer
 in Brazil, Russia, India, China, and South Africa (BRICS): A population-based comparison.
 Cancer Epidemiol 2018;53:27–34. doi:10.1016/j.canep.2017.12.013

41 Farzanegan MR, Feizi M, Gholipour HF. Globalization and the Outbreak of COVID-19: An
 Empirical Analysis. J Risk Financ Manag 2021;14:105. doi:10.3390/jrfm14030105

42 Aggarwal A, Shrivastava A, Kumar A, et al. Clinical and Epidemiological Features of SARS-CoV-
 2 Patients in SARI Ward of a Tertiary Care Centre in New Delhi. J Assoc Physicians India
 2020;68:19–26.

 20
43 Stark L, Ager A. A systematic review of prevalence studies of gender-based violence in
 complex emergencies. Trauma, Violence, Abus 2011;12:127–34.
 doi:10.1177/1524838011404252

44 Rendall MS, Weden MM, Favreault MM, et al. The Protective Effect of Marriage for Survival:
 A Review and Update. Demography 2011;48:481–506. doi:10.1007/s13524-011-0032-5

45 The Hindu. COVID-19 | Kerala CM calls for more effective measures for containment. 2020.

46 Yadav Y. What shocking data on Covid second wave deaths really reveals: Yogendra Yadav.
 2021.https://theprint.in/opinion/what-shocking-data-on-covid-second-wave-deaths-really-
 reveals-yogendra-
 yadav/678890/?fbclid=IwAR3lCQ9pYGunAmztxOtv2VUNESewRcrVckaCuH3cvYIM5keEcdEOtO
 0k3LE (accessed 17 Jun 2021).

Figure Captions:

Figure 1: Sensitivity Analysis (Nov 15, 2020). A) Effect of Life Expectancy on DALYs; B) Effect of
increase in cases on YLDs; C) Effect of mild cases on YLDs; D) Effect of deaths on DALYs; E) Effect of
isolation after recovery on YLDs; F) DALYs for all scenarios

Figure 2: Sensitivity Analysis (June 10, 2021). A) Effect of Life Expectancy on DALYs; B) Effect of
increase in cases on YLDs; C) Effect of mild cases on YLDs; D) Effect of deaths on DALYs; E) Effect of
isolation after recovery on YLDs; F) DALYs for all scenarios

 21
Figures

Figure 1

Sensitivity Analysis (Nov 15, 2020). A) Effect of Life Expectancy on DALYs; B) Effect of increase in cases
on YLDs; C) Effect of mild cases on YLDs; D) Effect of deaths on DALYs; E) Effect of isolation after
recovery on YLDs; F) DALYs for all scenarios

Figure 2

Sensitivity Analysis (June 10, 2021). A) Effect of Life Expectancy on DALYs; B) Effect of increase in cases
on YLDs; C) Effect of mild cases on YLDs; D) Effect of deaths on DALYs; E) Effect of isolation after
recovery on YLDs; F) DALYs for all scenarios

Supplementary Files
This is a list of supplementary les associated with this preprint. Click to download.

 s4.png
 s1.png
 s2.png
 s3.png
 SupplementaryTables.docx
You can also read