On the use of satellite observations to fill gaps in the Halley station total ozone record - Recent
←
→
Page content transcription
If your browser does not render page correctly, please read the page content below
Atmos. Chem. Phys., 21, 9829–9838, 2021
https://doi.org/10.5194/acp-21-9829-2021
© Author(s) 2021. This work is distributed under
the Creative Commons Attribution 4.0 License.

On the use of satellite observations to fill gaps
in the Halley station total ozone record
Lily N. Zhang1 , Susan Solomon1 , Kane A. Stone1 , Jonathan D. Shanklin2 , Joshua D. Eveson2 , Steve Colwell2 ,
John P. Burrows3 , Mark Weber3 , Pieternel F. Levelt4,5 , Natalya A. Kramarova6 , and David P. Haffner6,7
1 Earth, Atmospheric, and Planetary Sciences, Massachusetts Institute of Technology, Cambridge, MA 02139, USA
2 British Antarctic Survey, Cambridge, CB3 0ET, UK
3 Institute of Environmental Physics, University of Bremen, 28334 Bremen, Germany
4 KNMI, De Bilt, 3731, the Netherlands
5 University of Technology Delft, Delft, 2628, the Netherlands
6 NASA Goddard Space Flight Center, Greenbelt, MD 20771, USA
7 Science Systems and Applications, Inc., Lanham, MD 20706, USA

Correspondence: Lily N. Zhang (lnz0018@gmail.com)

Received: 11 February 2021 – Discussion started: 22 February 2021
Revised: 29 May 2021 – Accepted: 1 June 2021 – Published: 30 June 2021

Abstract. Measurements by the Dobson ozone spectropho-             1   Introduction
tometer at the British Antarctic Survey’s (BAS) Halley re-
search station form a record of Antarctic total column ozone
that dates back to 1956. Due to its location, length, and com-     Using the Halley Dobson record, Farman et al. (1985) were
pleteness, the record has been, and continues to be, uniquely      the first to identify the austral springtime Antarctic ozone
important for studies of long-term changes in Antarctic            hole, a discovery that would change the fundamental scien-
ozone. However, a crack in the ice shelf on which it resides       tific understanding of atmospheric ozone chemistry and con-
forced the station to abruptly close in February of 2017, lead-    tribute to environmental policy at the international level via
ing to a gap of two ozone hole seasons in its historic record.     the Montreal Protocol (Birmpili, 2018). The length of the
We develop and test a method for filling in the record of          Halley Dobson record as well as the Halley station’s partic-
Halley total ozone by combining and adjusting overpass data        ular location relative to the polar vortex and solar terminator
from a range of different satellite instruments. Comparisons       have made it not only historically important but also uniquely
to the Dobson suggest that our method reproduces monthly           valuable to modern studies of Antarctic total ozone.
ground-based total ozone values with an average difference             In 2017, this remarkable record was interrupted.
of 1.1 ± 6.2 DU for the satellites used to fill in the 2017–2018   That February, the Halley station was forced to
gap. We show that our approach more closely reproduces             cease operations due to risks associated with the
the Dobson measurements than simply using the raw satel-           structural stability of the Brunt ice shelf upon
lite average or data from a single satellite instrument. The       which       it   rests     (https://www.bas.ac.uk/media-post/
method also provides a check on the consistency of the pro-        halley-research-station-antarctica-to-close-for-winter/,
visional data from the automated Dobson used at Halley after       last access: 26 May 2021). No ozone data were taken
2018 with earlier manual Dobson data and suggests that there       during the austral springs of 2017 or 2018, breaking the
were likely inconsistencies between the two. The filled Hal-       continuity of this unique record of the springtime ozone
ley dataset provides further support that the Antarctic ozone      hole. The measurement season at Halley typically spans
hole is healing, not only during September but also in Jan-        August through April of each year (although there are a
uary.                                                              few missing months in years before the ice crack issue,
                                                                   discussed further below). No routine ozone data are available
                                                                   at Halley in the Antarctic winter months of May, June, and

Published by Copernicus Publications on behalf of the European Geosciences Union.
9830 L. N. Zhang et al.: Filling gaps in the Halley station ozone record
Figure 1. Daily averages for total column ozone measurements by Dobson instruments at the Halley station (in black) overlaid on top of all
available (raw) satellite daily averages (in red) from 2014–2019.
July, when the sun is below the horizon. Halley is now only the gaps from 2017 to 2018 but also apply the method where
staffed during the Antarctic summer season, with automated possible to fill in missing months in the earlier historical data.
instrumentation operating throughout the measurement
season, including the automated Dobson instrument. The
transition from manual year-round operation to automated 2 Methods
operation is reflected in the post-2017 change in seasonal
coverage in the Halley ozone record shown in Fig. 1 (which 2.1 Data
also shows satellite data for comparison, discussed further
below). All Halley Dobson data were obtained directly from the
In the first decades of the satellite observing system, British Antarctic Survey (https://legacy.bas.ac.uk/met/jds/
overpass comparisons with the ground-based Dobson net- ozone/index.html#data, last access: 25 June 2021). Halley
work were used for validation: e.g., to identify problems solar data typically end on 16 April as the sun retreats for
with different satellite systems such as calibration drifts or polar night and resume on 27 August. There are also some
performance under cloudy conditions (Bojkov et al., 1988; limited lunar measurements. For observations between 1956
McPeters and Labow, 1996). As the satellite observing sys- and 1971, only daily averages are currently available. Pro-
tem matured, satellite and Dobson comparisons could be visional individual Dobson measurements of total column
used in the opposite sense: for example, to find particular ozone at Halley are available from 1972 onwards and were
Dobson stations that were inconsistent with the rest of the used to compute daily averages. Data from the automated in-
ozone observing system (e.g., Fioletov et al., 1998). There- strument for 2018 onwards are particularly likely to require
fore, we undertook the development of an approach to fill revision as cross-calibration only takes place during the short
in missing periods in a specific Dobson ozone dataset using summer season.
satellite data. The different satellite datasets use a variety of spec-
The recent gap in the Halley record limits its use for study- tral ranges, scan widths, ozone absorption cross sections,
ing the full record of Antarctic ozone, particularly the current and retrieval algorithms to determine total ozone. In this
era of ozone healing, as global chlorofluorocarbon concen- study, we analyze Halley overpass data from the follow-
trations slowly decline. Satellite records of total ozone began ing 11 instruments (Fig. 2): GOME (Global Ozone Moni-
in the 1970s (Heath et al., 1973) and provide complemen- toring Experiment), GOME-2A, GOME-2B, SCIAMACHY
tary information, with shorter data records than those of the (SCanning Imaging Absorption spectroMeter for Atmo-
historic ground-based stations such as Halley but complete spheric CartograpHY), SBUV (Solar Backscatter Ultravi-
global coverage and routine day-to-day observations. Here olet), N7/TOMS (Total Ozone Mapping Spectrometer on
we examine a technique to combine satellite Halley overpass Nimbus-7), M3/TOMS (Meteor-3), EP/TOMS (Earth Probe),
observations from a variety of different available satellite in- OMI (Ozone Monitoring Instrument), OMPS-NM (Ozone
struments to provide as complete a record of Halley total Mapping and Profiler Suite, Nadir Mapper), and OMPS-NP
ozone as possible. Using satellite data, we develop and test (Nadir Profiler). A comparison of the satellite overpass data
a method to fill in the record of Halley total ozone as would with the Halley Dobson over 2013–2019 is shown in Fig. 1,
have been measured by the Dobson instrument. Our goal is highlighting the missing Halley Dobson data during the 2017
not to obtain the “most accurate” value for total ozone over and 2018 austral springs. All instruments use only UV wave-
Halley but rather to reproduce what the Dobson instrument lengths in their ozone retrieval. Version numbers and data
would have observed, had it been in operation. We focus on availability for each satellite instrument are listed below in
Table 1.
Atmos. Chem. Phys., 21, 9829–9838, 2021 https://doi.org/10.5194/acp-21-9829-2021L. N. Zhang et al.: Filling gaps in the Halley station ozone record 9831 Figure 2. Timeline showing years with available measurements from each satellite instrument considered for filling the gaps of the Halley Dobson total ozone record. The European GOME (see Burrows et al., 1999) and ments were later launched on the M3 and EP satellites. The GOME-2 sensors (since 2007; Munro et al., 2015) are nadir- TOMS instruments made measurements at discrete wave- sounding instruments while SCIAMACHY (2002–2012) is a lengths in the spectral range from ∼ 309 to 380 nm with a combined limb-, occultation-, and nadir-viewing spectrom- spatial resolution of about 50 by 50 km at nadir and increase eter (Bovensmann et al., 1995), all with a common her- to 150 by 200 km at the extreme cross-track positions. itage (Burrows et al., 1995). The total ozone columns from The Dutch–Finnish OMI is a nadir-looking, push broom GOME, SCIAMACHY nadir, GOME-2A, and GOME-2B UV–visible solar backscatter spectrometer on NASA’s Aura are retrieved using the weighting function differential op- satellite that measures the Earth’s radiance spectrum from tical absorption spectroscopy (WFDOAS) technique in the 270 to 500 nm with a spatial resolution of 13 × 24 km at nadir spectral window 325–335 nm (Coldewey-Egbers et al., 2005; and approximately 125 × 125 km at the outermost scan po- Orfanoz-Cheuquelaf et al., 2021). The WFDOAS approach sitions (Levelt et al., 2006). The OMI total ozone dataset was validated using Halley station data as reported in Weber used here is produced with a variation in the same algo- et al. (2005) and Orfanoz-Cheuquelaf et al. (2021). The min- rithm used for the TOMS instruments and validation of the imum footprints (ground pixel sizes) are 320 km by 40 km record has shown OMI to be stable for studies of ozone trends for GOME, 60 km by 30 km for SCIAMACHY nadir, and (McPeters et al., 2008, 2015). 80 km by 40 km for both GOME-2 sensors. Daily mean over- OMPS-NM and OMPS-NP are both from the Ozone Map- passes were calculated by averaging ozone columns from all ping and Profiler Suite on board of Suomi National Po- ground pixels within 100 km (GOME-2) and 300 km (SCIA- lar Partnership (NPP) satellite. The OMPS-NM has a wide MACHY, GOME) of the station. swath to provide global daily maps of total ozone columns The SBUV record is the longest satellite record and in- with a spatial resolution at nadir of 50 × 50 km. The OMPS- cludes measurements from nine satellite instruments starting NP sensor measures the complete spectrum from 260 to from the Backscatter Ultraviolet (BUV) on Nimbus-4 fol- 310 nm and in combination with the OMPS Nadir Mapper lowed by the SBUV instrument on Nimbus-7 and a series enables profile and total ozone retrievals for nadir direction of SBUV/2 sensors on NOAA-9, 11, 14, 16, 17, 18, and 19. only with a spatial resolution of 250 × 250 km at the ground The SBUV instruments measure Earth’s radiance at discrete (McPeters et al., 2019; Kramarova et al., 2014). wavelengths in the spectral range from 252 to 340 nm, with a Overpasses for the TOMS, OMI, and OMPS-NP instru- spatial field of view of about 170 km × 170 km at the surface. ments are defined by selecting the single pixel most closely These measurements have been cross-calibrated (DeLand et co-located with the Halley station. In the case of there being al., 2012) and processed with the same retrieval algorithm multiple pixels available, a pixel with a high optical path will (Bhartia et al., 2013) to produce a consistent, climate-quality be rejected in favor of one with slightly poorer spatial coinci- record of ozone profiles and total columns (Frith et al., 2014). dence but lower optical path. For the OMPS-NP instrument, The method for creating overpasses for SBUV is described the pixel closest to the station is chosen. None of these in- by Labow et al. (2013, see Sect. 5 there). struments, or SBUV, were validated with Halley station data. The TOMS on Nimbus-7 provided the first maps of to- Below, we first focus on the following six instru- tal ozone over Antarctica from space (Stolarski et al., 1986; ments: GOME-2A, GOME-2B, SBUV, OMI, OMPS-NP, and Bhartia and McPeters, 2018). Two additional TOMS instru- OMPS-NM. All of these were in operation during the period https://doi.org/10.5194/acp-21-9829-2021 Atmos. Chem. Phys., 21, 9829–9838, 2021
9832 L. N. Zhang et al.: Filling gaps in the Halley station ozone record
from 2013 to 2020 (spanning the period of missing Halley
represents the version number for the algorithm. The second represents the data version. In some cases, the algorithm and data version are the same.
Table 1. Version numbers, sources, and URLs for each of the 11 satellite instruments used in the study. For the NASA GSFC instruments, we provide two numbers. The first one
OMPS-NP
OMPS-NM
OMI
EP/TOMS
M3/TOMS
N7/TOMS
SBUV
SCIAMACHY
GOME-2B
GOME-2A
GOME
Instrument
data from 2017 to 2018). We then include other instruments
as appropriate for other periods. As with the Dobson data,
individual overpass data of total column ozone were used to
compute daily averages.
2.2 Data analysis
V8.6/V2.6
V8.0/V2.1
V8.0/V8.5
V8.0/V8.6
V8.0/V8.0
V8.0/V8.6
V8.6/V8.6
WFDOAS V1
WFDOAS V4
WFDOAS V4
WFDOAS V1
Version
From the individual satellite instruments, a “satellite aver-
age” daily total column ozone dataset was constructed, which
represents the mean of all available satellite daily averages
for each day.
NASA GSFC
NASA GSFC
NASA GSFC
NASA GSFC
NASA GSFC
NASA GSFC
NASA GSFC
University of Bremen
University of Bremen
University of Bremen
University of Bremen
Source Absolute and relative differences between satellite data
with respect to the Halley Dobson were computed using daily
values for each satellite individually, from which the satellite
average was obtained. All comparisons and difference calcu-
lations were only considered on coincident days of satellite
and Dobson measurements.
With all measurements and differences in the form of av-
eraged daily values, data were categorized and then aver-
https://acd-ext.gsfc.nasa.gov/anonftp/toms/, last access: 25 May 2021
https://acd-ext.gsfc.nasa.gov/anonftp/toms/, last access: 25 May 2021
https://acd-ext.gsfc.nasa.gov/anonftp/toms/, last access: 25 May 2021
https://acd-ext.gsfc.nasa.gov/anonftp/toms/, last access: 25 May 2021
https://acd-ext.gsfc.nasa.gov/anonftp/toms/, last access: 25 May 2021
https://acd-ext.gsfc.nasa.gov/anonftp/toms/, last access: 25 May 2021
https://acd-ext.gsfc.nasa.gov/anonftp/toms/, last access: 25 May 2021
https://www.iup.uni-bremen.de/UVSAT_material/data/satellite_overpass_HalleyBay_Syowa/, last access: 25 June 2021
https://www.iup.uni-bremen.de/UVSAT_material/data/satellite_overpass_HalleyBay_Syowa/, last access: 25 June 2021
https://www.iup.uni-bremen.de/UVSAT_material/data/satellite_overpass_HalleyBay_Syowa/, last access: 25 June 2021
https://www.iup.uni-bremen.de/UVSAT_material/data/satellite_overpass_HalleyBay_Syowa/, last access: 25 June 2021
URL
aged according to their corresponding month and day of the
year (DOY). Months directly bordering the polar night (April
and August) contained fewer data points when computing
monthly averages.
Initial comparisons revealed the value of our method for
identifying outliers in the Dobson data. In particular, lunar
Dobson measurements from 24 August 2015 were excluded
due to obviously anomalous differences compared to satellite
values observed on that day.
2.3 Delta characterization and adjustment
Biases between Halley and satellite data were characterized
individually for each instrument by day of the year, over the
entire period of available observations. Note that the use of
the word “bias” is not meant to imply an error but rather a
difference relative to the Halley Dobson. To avoid confusion,
we will henceforth use the Greek letter 1 to denote this dif-
ference. Using only coincident days, the 1 value for each day
of the year is the average of the absolute differences between
each satellite and Dobson for that day of the year, across
all years in each satellite series. Relative differences were
also computed but displayed the same seasonality as abso-
lute differences. To provide the value that would be seen by
the Dobson, the corresponding 1 was then subtracted from
each satellite’s daily average. The 1-adjusted satellite aver-
age is the mean after each instrument’s dataset has been indi-
vidually 1-adjusted. Uncertainty for the 1 adjustment of the
satellite average was calculated by combining, in quadrature,
the standard error of the mean for each satellite and accounts
for interannual variability.
2.4 Filling in missing Halley data
Daily Dobson measurements at Halley typically begin in
the last week of August and end in the third week of April
Atmos. Chem. Phys., 21, 9829–9838, 2021 https://doi.org/10.5194/acp-21-9829-2021L. N. Zhang et al.: Filling gaps in the Halley station ozone record 9833
(27 August to 16 April). For months when Dobson observa-
tions are not available, the 1-adjusted satellite average was
used to fill in daily averages for the days that Halley would
typically be in operation. No attempt was made to fill in in-
dividual missing days within months for which Dobson data
do exist but rather only those months when Halley measure-
ments are lacking.
3 Results and discussion
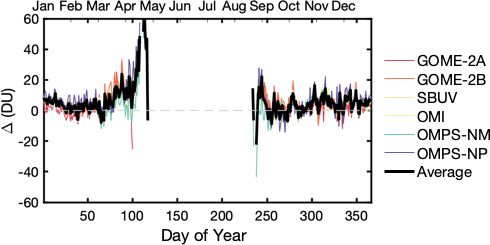
Figure 3. Average 1 (over 2013–2018) between total O3 column
Average absolute difference values provide a measure of how retrieved from the measurements of the Halley Dobson and each
the satellite data compare to the Dobson instrument (Table 1). satellite instrument by day of the year as well as the 1 averaged
across all instruments.
On average, GOME2A-, OMPS-NM, and OMI exhibit the
lowest average difference with the Dobson of the individual
instruments while the OMPS-NP instrument has the highest.
Initial comparisons revealed that the use of the Serdyuchenko the larger 1s in April versus August. Therefore, we chose to
ozone absorption cross sections (Serdyuchenko et al., 2014) characterize 1 by day of the year rather than zenith angle.
in the current GOME-2 data analysis method resulted in a Figure 4 reveals that the provisional 2019 automated Dob-
2 %–3 % positive bias in total ozone when compared to the son displayed substantially larger negative 1 values com-
Bass and Paur cross sections (Paur and Bass, 1985) employed pared to the rest of the dataset (Fig. 4). This indicates likely
at Halley. For comparability with the other values, we ad- inconsistencies between the automated instrument and ear-
justed GOME-2 data by a first-order factor of 1.025 to ac- lier data. Every Dobson instrument must be carefully cal-
count for the differences in absorption cross sections before ibrated to ensure accurate data; the calibration process for
performing the above analysis. OMI is the only one out of the the automated instrument has not yet been completed. There-
six displayed to use the Bass–Paur ozone absorption cross fore, we chose to exclude 2019 from our 1 adjustment. Be-
sections in its retrieval algorithm. The other NASA instru- cause the station continued to use the automated instrument
ments – OMPS-NP, OMPS-NM, and SBUV – all use the in 2020, we treated the 2020 data as likely inconsistent as
Brion–Daumont–Malicet (BDM) cross sections (Malicet et well and excluded it from our 1 adjustment. Figure 4 illus-
al., 1995). While a scaling factor could be applied to adjust trates the value of our method for testing Dobson measure-
for the different cross sections used as was done for GOME- ments for potential inconsistencies, particularly following in-
2, differences between OMPS-NM and OMPS-NP datasets strument changes when calibration procedures may still be
would remain. The average of all satellite instruments con- underway.
sistently performs well relative to the individual instruments To test the fidelity of our method, we then omitted Halley
in all months except April (see below) and in particular dur- Dobson measurements for selected time frames during which
ing the austral spring months of August, September, and Oc- data were available and evaluated how well our method could
tober. This supports the use of the satellite average for this reproduce those values. In short, after excluding the selected
study and application. years, instruments were “trained” over the rest of the avail-
All 1 values were then applied by day of the year in able range for the satellite (see Fig. 2) by determining the
each individual satellite dataset for all periods of observa- average 1 for each day of the year between each of the satel-
tions. Multiple instruments were averaged for each period lites and Halley. We then applied that 1 to the satellite data
whenever available, in the manner discussed above, and used for the omitted period to define what the 1-adjusted satellite
to form the best available 1-adjusted satellite averages over average suggests that Halley should have observed. These
time throughout the record. values were then compared to what the Halley Dobson ac-
Characterizing 1 by day of the year reveals trends across tually observed. We were particularly interested in evaluat-
all instruments. Figure 3 shows that 1 is largest in the months ing our method for a time frame when the same satellite in-
of April and August, when solar zenith angles are large, as struments as the ones in operation from 2017 and 2018 were
the station approaches and exits the polar night. The rapid available. Consequently, we chose to test the method for the
and non-linear increase in 1 during spring and fall demon- years 2013 to 2015 by pretending data for those years did not
strates the importance of defining the 1 in these seasons by exist and characterizing the monthly 1 values averaged over
average daily rather than monthly differences. Additionally, those years using the rest of the available data for the GOME-
1 does not follow a simple solar zenith angle dependence. 2A, GOME-2B, OMI, OMPS-NP, OMPS-NM, and SBUV
Values differ between the onset and end of the polar night instruments. To examine the performance of our method dur-
for days with the same solar zenith angle, as evidenced by ing periods when there were fewer available instruments, we
https://doi.org/10.5194/acp-21-9829-2021 Atmos. Chem. Phys., 21, 9829–9838, 20219834 L. N. Zhang et al.: Filling gaps in the Halley station ozone record
Table 2. Average absolute differences in DU between the total column of O3 retrieved from the Halley Dobson instrument and those retrieved
from the (raw) daily measurements by GOME-2A, GOME-2B, OMI, OMPS-NM, OMPS-NP, and SBUV averaged by month and in total for
the period from 2013–2018.
Month GOME-2A GOME-2B SBUV OMI OMPS-NM OMPS-NP Satellite average
January 0.3 4.1 6.5 4.8 4.6 7.3 4.5
February −1.5 −0.1 3.3 2.8 1.6 5.4 1.8
March 7.9 11.4 6.0 6.6 2.3 6.0 6.7
April 9.2 17.7 24.3 8.6 7.8 24.3 17.7
August N/A 10.1 12.3 7.6 −4.7 12.3 6.2
September 2.8 6.3 −0.5 −0.6 −2.5 −0.7 1.0
October 2.1 4.2 2.4 4.9 4.4 3.5 3.5
November 0.7 4.8 5.6 6.1 6.4 6.2 4.9
December 2.5 6.4 6.8 3.8 4.4 7.1 5.1
Total 2.2 5.7 5.8 4.4 3.3 6.5 4.9
Figure 4. Average 1 over all years (Fig. 2) excluding 2019 for each month with error bars (black). The monthly 1 values with the automated
Dobson in 2019 (red) have larger magnitudes than 1s in other years. The error bars represent the standard error of each satellite mean,
combined in quadrature for each monthly bin.
also tested on 1998–2002 using data from GOME, SCIA- values. This result is expected, given that the day-of-year-
MACHY, SBUV, and EP/TOMS instruments. The range of characterized 1 values, when averaged over a month, should
available data for each instrument can be found in Fig. 2. resemble the monthly-characterized 1. The decreased uncer-
The training period for each instrument is the available range tainty in the monthly-characterized 1 is due to the greater
after excluding the years being tested (and 2019–2020). number of data points averaged in the 1 adjustment. The use
Figure 5 shows that, after excluding 2019 and 2020 data, of one characterization over the other should depend on the
applying the results of training to the satellite average repro- goal of a given study. When reproducing daily total ozone
duced Halley Dobson monthly total ozone values with an av- values, as we do in this paper, 1 values need to be charac-
erage and an estimated training error of 1.8 ± 6.7 Dobson terized by day of the year in order to capture rapid changes
units (DU) for the period from 1998–2002 and 1.1 ± 6.2 DU in solar zenith angle (SZA) and, subsequently, total ozone in
for the period from 2013–2015. The raw satellite average the early spring and late fall (Fig. 3).
only reproduced Halley Dobson monthly total ozone values The 1-adjusted satellite data were then used to complete
to within an average of 6.5 DU for 1998–2002 and 4.6 DU for the Halley Dobson record (Table 2), including not only the
2013–2015. On average, the 1-adjusted satellite average dis- period of the ice crack but other months when Dobson data
played significantly smaller differences than the raw average are occasionally missing. No satellite data exist prior to 1970,
without including 1 adjustment, showing that our method re- and in the early 1970s, only one instrument (Nimbus-4 BUV)
produced well what the Dobson would have observed com- is available to fill in certain months. A comparison between
pared to the performance of the satellite average. Table 2 and Fig. 1 shows which satellite instruments are
Characterizing 1 values by month, rather than day of the available to fill in various periods.
year, results in comparable accuracy (within 0.79 DU for Figure 6 presents plots of September and January monthly
2013–2015) but decreased uncertainty (± 2.2 DU for 2013– mean total ozone at Halley, now with missing months filled
2015) in reproducing Halley Dobson monthly total ozone in, illustrating the value of our method. For September,
Atmos. Chem. Phys., 21, 9829–9838, 2021 https://doi.org/10.5194/acp-21-9829-2021L. N. Zhang et al.: Filling gaps in the Halley station ozone record 9835
Table 3. Monthly total ozone averages at Halley. Italic indicates months with no available Halley Dobson observations or only provisional
automated Dobson data, for which the 1-adjusted satellite average was used.
Year January February March April August September October November December
1956 NA NA NA NA NA 315 313 371 360
1957 335 297 289 275 302 285 322 396 349
1958 333 302 282 257 NA NA 306 351 380
1959 343 329 298 NA NA NA 303 304 341
1960 323 299 296 NA NA 288 293 347 377
1961 320 304 305 NA NA 268 309 333 345
1962 312 298 330 NA NA NA 323 382 378
1963 321 303 306 288 315 NA 301 349 352
1964 318 301 326 304 272 NA 310 402 358
1965 316 295 297 NA NA NA 274 299 336
1966 300 290 284 287 NA 289 308 339 346
1967 300 285 269 NA NA NA 315 359 334
1968 320 286 290 281 285 281 293 387 350
1969 313 291 282 246 NA 286 275 298 316
1970 306 286 269 259 309 274 275 357 346
1971 319 314 275 279 303 280 291 375 346
1972 317 301 301 314 305 266 296 377 351
1973 306 293 286 277 272 263 271 326 334
1974 307 275 262 242 NA 244 272 337 351
1975 320 275 279 NA NA 267 303 309 338
1976 314 272 257 251 NA 265 283 326 335
1977 318 280 275 253 290 239 251 332 360
1978 310 305 282 253 NA 264 284 345 337
1979 295 283 278 283 265 232 263 323 352
1980 324 292 290 278 328 236 226 293 340
1981 299 280 253 268 278 241 237 285 326
1982 290 278 260 285 267 210 218 268 322
1983 308 292 278 266 253 228 195 289 325
1984 301 272 273 267 242 215 194 248 322
1985 301 269 263 245 247 217 185 215 304
1986 286 273 247 227 253 212 233 282 309
1987 301 278 274 274 254 182 150 188 287
1988 286 264 271 265 242 207 216 312 323
1989 284 281 260 274 270 186 150 255 295
1990 290 266 254 254 259 173 173 207 246
1991 281 257 263 233 204 163 137 232 296
1992 271 283 281 257 185 152 147 206 270
1993 284 275 277 256 209 167 122 179 285
1994 278 264 255 284 197 152 126 217 316
1995 278 269 256 254 218 160 130 164 252
1996 261 249 246 226 173 155 148 181 260
1997 278 265 247 243 218 171 141 210 286
1998 267 262 264 255 221 162 140 183 255
1999 272 259 254 267 205 172 143 172 254
2000 281 258 250 256 179 151 137 267 299
2001 286 261 251 245 224 148 138 209 265
2002 283 263 246 250 228 213 224 329 306
2003 282 280 268 246 205 155 158 229 292
2004 277 271 262 242 242 173 191 222 282
2005 275 262 253 242 207 158 155 253 290
2006 281 269 272 255 221 147 137 181 275
2007 286 281 270 255 186 150 159 214 290
2008 291 274 282 263 203 151 145 180 244
2009 286 264 249 234 200 153 165 216 293
2010 293 275 254 267 222 188 184 222 271
2011 290 278 275 245 197 160 140 186 267
2012 284 262 252 243 209 175 179 302 310
2013 285 270 270 251 186 170 177 306 296
2014 292 279 265 255 205 173 148 195 294
2015 289 267 255 256 241 179 139 171 253
2016 274 261 258 234 213 175 155 245 307
2017 285 265 263 263 240 196 175 309 307
2018 297 280 263 255 208 165 132 214 300∗
2019 286 280 268 261 204 208 197 293 300
2020 293 281 275 265 235 176 138 182 226
∗ Manual observations with Dobson 31 from 10–31 December. May not be representative of the full month. NA: not available.
https://doi.org/10.5194/acp-21-9829-2021 Atmos. Chem. Phys., 21, 9829–9838, 20219836 L. N. Zhang et al.: Filling gaps in the Halley station ozone record
Figure 5. The monthly mean of the absolute difference between the ozone columns, retrieved from Halley Dobson daily ozone averages
and the satellite average (dotted) as well as the difference between the trained satellite average (solid) and the Dobson observations for the
periods (a) 1998–2002 and (b) 2013–2015.
the now-complete long record from Halley is suggestive of
ozone recovery at a rate of 1.34 ± 0.64 DU yr−1 (p = 0.05)
post-2000, although caution must be exercised before draw-
ing conclusions using single station data, due to potential sys-
tematic shifts of the location of the springtime polar vortex
over time that has been noted in previous work (Hassler et al.,
2011; Lin et al., 2009; Grytsai et al., 2017) and possibly other
factors. A low p value (p ≤ 0.05) for the regression indicates
that the trend is unlikely to have occurred by chance. This
figure also shows that post-2000 January data also display
a positive trend of 0.44 ± 0.20 DU yr−1 (p = 0.04). January
does not display such shifts in the vortex; indeed, the vortex
is essentially dissipated in this summer month. Fioletov and
Shepherd (2005) showed that summer season total ozone is
correlated with that in spring. The long records in September
and January taken together hence support the view that ozone
recovery is occurring, and the figure demonstrates the ap- Figure 6. Monthly Halley ozone averages over time (black) for
plication of our method towards future studies of long-term (a) September and (b) January, with the 1-adjusted satellite average
trends in Antarctic ozone. (red) filled in for years with no or provisional Halley Dobson ob-
servations. Note that GOME and SBUV data are not yet available.
Dobson data from 2019 and 2020 were replaced due to apparent
4 Conclusions inconsistencies between the automated instrument and earlier data.
We developed a method to fill in missing data in the historic
Halley record of total ozone (Farman et al., 1985; Jones and
Shanklin, 1995) using satellite overpass data, with a partic- in identifying potential calibration issues, particularly after
ular focus on the period of 2017–2018 when the Halley sta- instrument changes.
tion was abruptly closed for safety reasons associated with a We found that the average of the available satellites over
crack in the ice shelf. We analyzed the suite of total ozone 2013–2018 displayed a smaller 1 relative to the Halley to-
data from a range of available satellite total ozone instru- tal ozone data than most of the individual satellites and per-
ments. Using the differences between daily Halley and satel- formed especially well during months in the austral spring.
lite overpass data, we derived the differences (1) between We then tested our method using time periods when Halley
the Dobson and each satellite for each day of the observ- data were actually available to see how well the technique
ing season (August to April) as well as the satellite average. would have worked if data were missing at those times. Our
Through this process, we found that the preliminary com- tests indicate that by accounting for 1s between the daily
puted data from the automated instrument in 2019 had ap- satellite averages and Dobson data, we could fill in missing
parent inconsistencies with the earlier data taken with the months with a high degree of fidelity (average difference of
manual Dobson when compared to the satellite (see Fig. 4). 1.1 ± 6.2 DU for monthly averages). We applied the method
This comparison illustrates that our method can be valuable to all possible missing months of data in the Halley record,
Atmos. Chem. Phys., 21, 9829–9838, 2021 https://doi.org/10.5194/acp-21-9829-2021L. N. Zhang et al.: Filling gaps in the Halley station ozone record 9837
and the filled dataset will be available for use by other re- Acknowledgements. Lily N. Zhang acknowledges support by the
searchers. David P. Bacon Fund for undergraduate research. Susan Solomon
The filled dataset allows studying the important question acknowledges support by the Lee and Geraldine Martin Chair in
of the healing of the ozone hole due to the phaseout of Environmental Studies at MIT. The research of John P. Burrows
the new production of ozone-depleting substances under the and Mark Weber is in part supported by the University and the
State of Bremen, Germany, DFG (German Research foundation),
Montreal Protocol, which would otherwise be impeded by
DLR (German Aerospace), and BMBF (SynopSys). We thank EU-
the years of the ice crack interruption. The results better sup- METSAT for providing level-1 data from GOME-2A and GOME-
port the conclusion that healing of the ozone hole is begin- 2B. Helpful discussions with Paul Newman are gratefully acknowl-
ning in the key month of September than would be possible edged.
without the data filling, although we note that data for a sin-
gle station in September can be influenced by changes in the
position and conditions of the polar vortex, as documented Review statement. This paper was edited by Farahnaz Khosrawi
in other studies. However, we also show that the Halley data and reviewed by two anonymous referees.
indicate ozone healing for January as well, a month when the
vortex is very weak and essentially circumpolar.
Because of COVID-19, several Antarctic stations are cur-
rently subject to reduced operations and staffing (Hughes and References
Convey, 2020). The COVID-19 pandemic underscores that
long-term observations may be unexpectedly interrupted at Bhartia, P. K., McPeters, R. D., Flynn, L. E., Taylor, S., Kramarova,
any time, due not only to geophysical change such as the N. A., Frith, S., Fisher, B., and DeLand, M.: Solar Backscatter
ice crack but also societal change. The method developed UV (SBUV) total ozone and profile algorithm, Atmos. Meas.
here could be applied to bridge missing data in other station Tech., 6, 2533–2548, https://doi.org/10.5194/amt-6-2533-2013,
records. 2013.
Birmpili, T.: Montreal Protocol at 30: The governance structure, the
evolution, and the Kigali Amendment, C. R. Geosci., 350, 425–
Code availability. MATLAB was used for data analysis and visual- 431, 2018.
ization. Scripts can be accessed at https://www.ssolomongroup.mit. Bojkov, R. D., Mateer, C. L., and Hansson, A. L.: Comparison
edu/toolsandproducts (Zhang, 2021). of ground-based and total ozone mapping spectrometer mea-
surements used in assessing the performance of the global
ozone observing system, J. Geophys. Res., 93, 9525– 9533,
https://doi.org/10.1029/JD093iD08p09525, 1988.
Data availability. Sources for all data used in this paper can be
Burrows, J. P., Hölzle, E., Goede, A. P. H., Visser H., and Fricke, W.:
found in Table 1. The filled Halley record shown in Table 3
SCIAMACHY – Scanning Imaging Absorption Spectrometer for
is available for download at https://www.ssolomongroup.mit.edu/
Atmospheric Chartography, Acta Astronaut., 35, 445–451, 1995.
toolsandproducts (Zhang, 2021).
Burrows, J. P., Weber, M., Buchwitz, M., Rozanov, V.,
Ladstatter-Weissenmayer, A., Richter, A., DeBeek, R.,
Hoogen, R., Bramstedt, K., Eichmann, K., Eisinger, M.,
Supplement. The supplement related to this article is available on- and Perner, D.: The global ozone monitoring experiment
line at: https://doi.org/10.5194/acp-21-9829-2021-supplement. (GOME): Mission concept and first scientific results, J.
Atmos. Sci., 56, 151–175, https://doi.org/10.1175/1520-
0469(1999)0563C0151:TGOMEG3E2.0.CO;2, 1999.
Author contributions. SS and KAS conceptualized the project. The Coldewey-Egbers, M., Weber, M., Lamsal, L. N., de Beek,
methodology was developed by SS, KAS, and LNZ and imple- R., Buchwitz, M., and Burrows, J. P.: Total ozone retrieval
mented by LNZ with satellite and Halley Dobson data provided from GOME UV spectral data using the weighting func-
by the other co-authors. LNZ prepared the paper with contributions tion DOAS approach, Atmos. Chem. Phys., 5, 1015–1025,
from all co-authors. https://doi.org/10.5194/acp-5-1015-2005, 2005.
DeLand, M. T., Taylor, S. L., Huang, L. K., and Fisher, B. L.: Cal-
ibration of the SBUV version 8.6 ozone data product, Atmos.
Competing interests. The authors declare that they have no conflict Meas. Tech., 5, 2951–2967, https://doi.org/10.5194/amt-5-2951-
of interest. 2012, 2012.
Farman, J., Gardiner, B., and Shanklin, J.: Large losses of total
ozone in Antarctica reveal seasonal ClOx /NOx interaction, Na-
Disclaimer. Publisher’s note: Copernicus Publications remains ture, 315, 207–210, https://doi.org/10.1038/315207a0, 1985.
neutral with regard to jurisdictional claims in published maps and Fioletov, V. E., Kerr, J. B., Hare, E. W., Labow, G. J.,
institutional affiliations. and McPeters, R. D.: An assessment of the world ground-
based total ozone network performance from the compari-
son with satellite data, J. Geophys. Res., 104, 1737–1747,
https://doi.org/10.1029/1998JD100046, 1999.
https://doi.org/10.5194/acp-21-9829-2021 Atmos. Chem. Phys., 21, 9829–9838, 20219838 L. N. Zhang et al.: Filling gaps in the Halley station ozone record Fioletov, V. E. and Shepherd, T. G: Summertime total ozone vari- with the Dobson network, Geophys. Res. Lett., 23, 3695–3698, ations over middle and polar latitudes, Geophys. Res. Lett., 32, https://doi.org/10.1029/96GL03539, 1996. L04807, https://doi.org/10.1029/2004GL022080, 2005. McPeters, R., Kroon, M., Labow, G., Brinksma, E., Balis, Frith, S. M., Kramarova, N. A., Stolarski, R. S., McPeters, D., Petropavlovskikh, I., Veefkind, J. P., Bhartia, P. K., and Lev- R. D., Bhartia, P. K., and Labow, G. J.: Recent changes elt, P. F.: Validation of the Aura Ozone Monitoring Instrument in total column ozone based on the SBUV Version 8.6 total column ozone product, J. Geophys. Res., 113, D15S14, merged ozone data set. J. Geophys. Res., 119, 9735–9751, https://doi.org/10.1029/2007JD008802, 2008. https://doi.org/10.1002/2014JD021889, 2014. McPeters, R. D., Frith, S., and Labow, G. J.: OMI total column Grytsai, A., Klekociuk, A., Milinevsky, G., Evtushevsky, O., ozone: extending the long-term data record, Atmos. Meas. Tech., and Stone, K.: Evolution of the eastward shift in the quasi- 8, 4845–4850, https://doi.org/10.5194/amt-8-4845-2015, 2015. stationary minimum of the Antarctic total ozone column, At- McPeters, R., Frith, S., Kramarova, N., Ziemke, J., and Labow, G.: mos. Chem. Phys., 17, 1741–1758, https://doi.org/10.5194/acp- Trend quality ozone from NPP OMPS: the version 2 processing, 17-1741-2017, 2017. Atmos. Meas. Tech., 12, 977–985, https://doi.org/10.5194/amt- Hassler, B., Bodeker, G. E., Solomon, S., and Young, P. J.: Changes 12-977-2019, 2019. in the polar vortex: Effects on Antarctic total ozone obser- Munro, R., Lang, R., Klaes, D., Poli, G., Retscher, C., Lind- vations at various stations, Geophys. Res. Lett., 38, L01805, strot, R., Huckle, R., Lacan, A., Grzegorski, M., Holdak, A., https://doi.org/10.1029/2010GL045542, 2011. Kokhanovsky, A., Livschitz, J., and Eisinger, M.: The GOME- Heath, D. F., Mateer, C. L., and Krueger, A. J.: The Nimbus-4 2 instrument on the Metop series of satellites: instrument design, Backscatter Ultraviolet (BUV) atmospheric ozone experiment calibration, and level 1 data processing – an overview, Atmos. – two years’ operation, Pure Appl. Geophys., 106, 1238–1253, Meas. Tech., 9, 1279–1301, https://doi.org/10.5194/amt-9-1279- https://doi.org/10.1007/BF00881076, 1973. 2016, 2016. Hughes, K. and Convey, P.: Implications of the COVID- Wilkerson, J., Sayres, D. S., Smith, J. B., Allen, N., Rivero, M., 19 pandemic for Antarctica, Antarct. Sci., 32, 426–439, Greenberg, M., Martin, T., and Anderson, J. G.: In situ obser- https://doi.org/10.1017/S095410202000053X, 2020. vations of stratospheric HCl using three-mirror integrated cav- Jones, A. and Shanklin, J.: Continued decline of total ozone ity output spectroscopy, Atmos. Meas. Tech., 14, 3597–3613, over Halley, Antarctica, since 1985, Nature, 376, 409–411, https://doi.org/10.5194/amt-14-3597-2021, 2021. https://doi.org/10.1038/376409a0, 1995. Paur, R. J. and Bass, A. M.: The Ultraviolet Cross-Sections of Munro, R., Lang, R., Klaes, D., Poli, G., Retscher, C., Lind- Ozone: II. Results and Temperature Dependence, in: Atmo- strot, R., Huckle, R., Lacan, A., Grzegorski, M., Holdak, A., spheric Ozone, edited by: Zerefos C. S. and Ghazi A., Springer, Kokhanovsky, A., Livschitz, J., and Eisinger, M.: The GOME- Dordrecht, 611–616, https://doi.org/10.1007/978-94-009-5313- 2 instrument on the Metop series of satellites: instrument design, 0_121, 1985. calibration, and level 1 data processing – an overview, Atmos. Serdyuchenko, A., Gorshelev, V., Weber, M., Chehade, W., and Meas. Tech., 9, 1279–1301, https://doi.org/10.5194/amt-9-1279- Burrows, J. P.: High spectral resolution ozone absorption cross- 2016, 2016. sections – Part 2: Temperature dependence, Atmos. Meas. Tech., Kramarova, N. A., Nash, E. R., Newman, P. A., Bhartia, P. K., 7, 625–636, https://doi.org/10.5194/amt-7-625-2014, 2014. McPeters, R. D., Rault, D. F., Seftor, C. J., Xu, P. Q., and Labow, Stolarski, R. S., Krueger, A. J, Schoeberl, M. R., McPeters, R. D., G. J.: Measuring the Antarctic ozone hole with the new Ozone Newman, P. A., and Alpert, J. C.: 7 satellite measurements of Mapping and Profiler Suite (OMPS), Atmos. Chem. Phys., 14, the springtime Antarctic ozone decrease, Nature, 322, 808–811, 2353–2361, https://doi.org/10.5194/acp-14-2353-2014, 2014. https://doi.org/10.1038/322808a0, 1986. Labow, G. J., McPeters, R. D., Bhartia, P. K., and Kramarova, N.: A Weber, M., Lamsal, L. N., Coldewey-Egbers, M., Bramstedt, K., comparison of 40 years of SBUV measurements of column ozone and Burrows, J. P.: Pole-to-pole validation of GOME WFDOAS with data from the Dobson/Brewer network, J. Geophys. Res.- total ozone with groundbased data, Atmos. Chem. Phys., 5, Atmos., 118, 7370–7378, https://doi.org/10.1002/jgrd.50503, 1341–1355, https://doi.org/10.5194/acp-5-1341-2005, 2005. 2013. Weber, M., Chehade, W., Gorshelev, V., Serdyuchenko, A., and Spi- Levelt, P. F., van den Oord, G. H. J., Dobber, M. R., Malkki, A., etz, P.: Impact of ozone cross-section choice on WFDOAS total Visser, H., de Vries, J., Stammes, P., Lundell, J. O. V., and Saari, ozone retrieval applied to GOME, SCIAMACHY, and GOME- H.: The Ozone Monitoring Instrument, IEEE T. Geosci. Remote., 2 (1995-present), Technical Note Issue 2 with updates from 44, 1093–1101, https://doi.org/10.1109/TGRS.2006.872333, November 2013, a contribution to ACSO, University of Bremen, 2006. Bremen, Germany, https://doi.org/10.26092/elib/306, 2013. Lin, P., Fu, Q., Solomon, S., and Wallace, J. M.: Temperature Weber, M., Coldewey-Egbers, M., Fioletov, V. E., Frith, S. M., Trend Patterns in Southern Hemisphere High Latitudes: Novel Wild, J. D., Burrows, J. P., Long, C. S., and Loyola, D.: To- Indicators of Stratospheric Change, J. Climate, 22, 6325–6341, tal ozone trends from 1979 to 2016 derived from five merged https://doi.org/10.1175/2009JCLI2971.1, 2009. observational datasets – the emergence into ozone recovery, At- Malicet, J., Daumont, D., Charbonnier, J., Parisse, C., Chakir, A., mos. Chem. Phys., 18, 2097–2117, https://doi.org/10.5194/acp- and Brion, J.: Ozone UV spectroscopy, II. Absorption cross- 18-2097-2018, 2018. sections and temperature dependence, J. Atmos. Chem., 21, 263– Zhang, L.: Scripts and Datasets for Filling in Dobson Total Ozone 273, https://doi.org/10.1007/BF00696758, 1995. Records, MIT Atmospheric Chemistry, available at: https://www. McPeters, R. and Labow, G.: An assessment of the accuracy of 14.5 ssolomongroup.mit.edu/toolsandproducts, last access: 25 June years of Nimbus 7 TOMS version 7 ozone data by comparison 2021. Atmos. Chem. Phys., 21, 9829–9838, 2021 https://doi.org/10.5194/acp-21-9829-2021
You can also read


