AN EVALUATION OF SPORTRADAR'S FRAUD DETECTION SYSTEM - BY DAVID FORREST PROFESSOR OF ECONOMICS, UNIVERSITY OF LIVERPOOL, UK AND IAN G. MCHALE ...
←
→
Page content transcription
If your browser does not render page correctly, please read the page content below
!

    AN EVALUATION OF SPORTRADAR’S
       FRAUD DETECTION SYSTEM

                                  by

                             David Forrest
         Professor of Economics, University of Liverpool, UK

                                  and

                            Ian G. McHale
        Professor of Sports Analytics, University of Salford, UK

                           September, 2015

!
!

CONTENTS
SUMMARY ............................................................................................................................... 1!
1! INTRODUCTION ............................................................................................................... 2!
    1.1! The purpose and scope of this Report .............................................................................................. 2!

    1.2! Conceptual framework ..................................................................................................................... 3!
    1.3! Criteria for assessing screening systems .......................................................................................... 6!

    1.4! Structure of the Report ..................................................................................................................... 9!

2! THE QUALITY, SCOPE AND RELIABILITY OF THE DATA USED IN THE FDS .. 12!
    2.1! Introduction .................................................................................................................................... 12!
    2.2! Odds Data....................................................................................................................................... 12!

       The scope of the data ........................................................................................................................... 12!
       The quality of the data ......................................................................................................................... 15!

    2.3! Sports Data ..................................................................................................................................... 16!

    2.4! Synchronisation of Odds and Sports Data ..................................................................................... 17!

3! THE MATHEMATICAL MODELS OF THE FDS.......................................................... 19!
    3.1! The role of the mathematical models ............................................................................................. 19!

    3.2! The pre-match model ..................................................................................................................... 20!
    3.3! The in-play model .......................................................................................................................... 23!

       The in-play model in practice.............................................................................................................. 24!
       Testing the efficacy of the in-play model ............................................................................................. 27!

4! THE ALERT PROCESS: STAGE 1 IN THE FDS ........................................................... 29!
    4.1! The triggering of alerts pre-match ................................................................................................. 29!
       The general approach ......................................................................................................................... 29!

       Criteria for creation of an alert .......................................................................................................... 30!

       Additional criteria for alerts ............................................................................................................... 32!

       Setting thresholds for alerts (‘configuration’) .................................................................................... 33!

    4.2! The triggering of alerts in-play ...................................................................................................... 35!
    4.3! Are the thresholds set appropriately? ............................................................................................. 38!

5! STAGE 2 IN THE FDS: HOTLISTING AND ESCALATION........................................ 40!

                                                                                                                                                            i
!
!

    5.1! Introduction .................................................................................................................................... 40!

    5.2! Hotlisting ....................................................................................................................................... 41!

       Description of the process ................................................................................................................... 41!

       Are the analysts adequately provided with information?.................................................................... 42!

       Are the analysts appropriately qualified to make the judgement? ...................................................... 44!

    5.3! The escalation process ................................................................................................................... 45!

       The input from freelancers .................................................................................................................. 47!
       The decision meeting ........................................................................................................................... 50!

       The report on a match classified as suspicious ................................................................................... 51!

       Conclusion ........................................................................................................................................... 53!

6! CASE STUDIES: THE FDS IN ACTION ........................................................................ 55!
    6.1! Introduction .................................................................................................................................... 55!

    6.2! Case studies .................................................................................................................................... 56!

       Australia .............................................................................................................................................. 56!
       Austria ................................................................................................................................................. 58!

       Estonia and Latvia .............................................................................................................................. 59!

7! SOME REFLECTIONS ..................................................................................................... 62!
8! CONCLUSIONS ............................................................................................................... 65!
Appendix A:! List of bookmakers monitored within the FDS .............................................. 67!
Appendix B:!              Odds database and screenshot details............................................................. 71!
Appendix C:!              Empirically testing the in-play model. ........................................................... 77!
Appendix D:! Procedures for hotlisting and escalation......................................................... 81!

                                                                                                                                                                 ii
!
!

SUMMARY
In this Report, we examine the likely efficacy of Sportradar’s Fraud Detection System (FDS),
which monitors betting markets for indications that a (football) match may have been
manipulated. As with any screening system, its efficacy is appropriately evaluated by reference
to its sensitivity (what proportion of manipulated matches does it identify?) and its specificity
(what proportion of matches identified as likely to have been manipulated are true cases of
manipulation?).

Our evaluation was based principally on analysing the reliability in construction and execution of
each component of the system, both those based on statistical algorithms and those where expert
analysts form a final judgement. We also considered case studies of matches known, from
external evidence, to have been manipulated

Our conclusion is, first, that, while the level of sensitivity cannot be evaluated precisely, the FDS
is likely to identify correctly a significant proportion of manipulated matches. Second, given the
quite high proportion of matches identified as potentially suspicious by the statistical algorithms
operated by the FDS and the relatively low number of reports finally issued to client
organisations, we view analysts at the FDS as being both thorough and cautious when the final
decision is taken on whether to classify a match as suspicious. Therefore we believe that the
specificity of the screen is likely to be high and that few false positives will be presented.

!

                                                                                                    1
!
!

1       INTRODUCTION
1.1         The purpose and scope of this Report

During the last five years in particular, there has been growing awareness of the scale and level
of threat to the integrity of organised sport, including from international organised crime. Several
significant Reports on the problem of match fixing have been produced, for example by l’Institut
de Relations Internationales et Stratégiques1 and by the Sorbonne University2. Increasingly,
governments have also recognised the need for protective measures to be developed, as
evidenced by the Council of Europe Convention on the Manipulation of Sports Competitions,
adopted by the Committee of Ministers in July 2014.

Against this background, Sportradar offers integrity services to sports federations and
competitions and state and law enforcement agencies. Its Fraud Detection System (FDS)
monitors betting markets for abnormal activity with a view to identifying fixtures where there is
evidence suggestive of manipulation of the event. Reports are then issued to the sports federation
or other partner as appropriate. Successful detection of match fixing potentially aids directly in
addressing the threat to integrity as it may lead to removal of corrupt personnel from the sport.
Strengthening the chance of detection may also serve as a deterrent to sports insiders agreeing to
participate in corrupt practices to begin with.

The present authors were contracted by Sportradar to provide an independent evaluation of the
efficacy and reliability of the FDS. Our investigation took place between March and May, 2015.
Methods employed included reviews of multiple internal documents describing procedures in
place at Sportradar, practical testing of systems for assembling odds data, theoretical and
empirical evaluation of the statistical models embedded within the FDS, live observation of the
work of analysts as matches were played and data generated, and attendance at subsequent
meetings where Sportradar personnel took decisions as to whether to report a match as
suspicious. Though Sportradar operates the FDS for certain other sports, such as handball and
cricket, our investigation was limited to its application to football. Sportradar monitors football
betting markets on behalf of UEFA and several other soccer federations and competitions around
the World.

Naturally, our perspective and approach were influenced by our academic background in
economics and statistics. In carrying out the Evaluation, we were able to draw on substantial
experience in producing peer-reviewed papers and reports on sports integrity, the efficiency of

!!!!!!!!!!!!!!!!!!!!!!!!!!!!!!!!!!!!!!!!!!!!!!!!!!!!!!!!!!!!!
1
!IRIS, ‘Sports betting and Corruption: How to Preserve the Integrity of Sport’, Paris, 2012.
2
 Université Paris 1 Panthéon-Sorbonne and International Centre for Sport Security, ‘Fighting against the
Manipulation of Sports Competitions’, Paris, 2014

                                                                                                           2
!
!
betting markets and the statistical modelling of football matches. In the past, we have also
advised various sports federations and public bodies on relevant related issues.
In this introductory section, we discuss the conceptual framework within which we approached
the Evaluation. Then we describe how we broke down our commission into steps such that all
the building blocks which make up the FDS were covered.
1.2 Conceptual framework
Forensic economics and statistics has been applied to sports data by a number of authors to
attempt to gain a general idea of the prevalence of corruption in various sports. For example,
Wolfers3 estimated the proportion of college basketball matches which might have been subject
to point shaving (a practice of manipulating the margin of victory such that, while a team wins
on the court, wagers on its opponent win on the betting market), Duggan and Levitt4 revealed
sumo wrestlers swapping wins across tournaments depending on when one competitor most
needed a win, and Minor and Brown5 modelled ‘tanking’ (playing with low effort) in
professional tennis. All such papers may be argued to be informative regarding the rough order
of magnitude of the prevalence of various corrupt practices. However, analysis of sports data
alone is unpromising at the micro level, i.e. for detection of individual cases of corruption,
because data are too ‘noisy’. Data can highlight instances where individuals or teams
underperform relative to ‘expectations’; but underperformance is common from the inherent
uncertainty of sporting contests and treating a surprise result, or any underperformance, as
potentially evidence of corruption would produce a very high number of false positives.
For this reason, it appears a sensible course to search, as Sportradar does, for evidence of
corruption by monitoring betting markets alongside sports data. Of course, fixes may be
instigated with a variety of motives. There may be a ‘sporting’ motivation, for example one team
needs to win to avoid relegation and the owners of the two teams involved agree (for money or
for future return of favour) that an appropriate result be ‘manufactured’; or the motive for
‘buying’ a fix from players might simply be to enable winning money on the betting market. But,
even in the former case, effects from the fix may be evident on betting markets because insiders
cannot resist seeking to profit from knowledge that a match will be manipulated. Thus a variety
of fixes, not just those initiated by external parties purely for betting gain, might be detected by
procedures which include monitoring betting markets on sports events.
!!!!!!!!!!!!!!!!!!!!!!!!!!!!!!!!!!!!!!!!!!!!!!!!!!!!!!!!!!!!!
3
J. Wolfers, ‘Point shaving: Corruption in NCAA basketball’, American Economic Review, 2006, pp. 279-283.
4
M. Duggan and S.D. Levitt, ‘Winning isn’t everything: Corruption in sumo wrestling’, American Economic
Review, 2002, pp. 1594-1605.
5
D. Minor and J. Brown, ‘Selecting the best? Spillovers and shadows in elimination tournaments’, Management
Science, 2014, pp. 3087-3102.
3
!!
Monitoring the flow of data from betting markets to detect fraud with the aid of statistical models
and algorithms falls within the general field of statistics termed anomaly detection6. In many
applications it is appropriate for the search to focus on ‘outliers’, for example, on cases in data
from medical screening where blood pressure is exceptionally high given a subject’s age, gender
and weight. Such cases may then be selected for more detailed examination. However, the
literature notes that, where the reason for identifying anomalies is to detect possible malpractice,
it is very common to focus instead on ‘bursts of activity’. For example, algorithms for detecting
credit card fraud are constructed to emphasise the significance of instances where there is a
sudden increase in the frequency with which a card is used. This does not necessarily indicate
abuse but triggers further inquiry because most cards appropriated by criminals will in fact be
used frequently, to maximise returns quickly, before the theft of the card is discovered.
In its emphasis on ‘bursts of activity’, the principles underpinning the FDS therefore put it
squarely in the mainstream tradition of forensic statistics. Bursts of activity in the context of a
betting market may be captured by observing unusual changes in odds. Such changes will often
signify unusually heavy flows of money which reflect that certain bettors believe that the
previous odds were favourable to them; sometimes this will be because they themselves had
arranged for the match to take a certain course. Changes may also be observed where
bookmakers come to form an opinion that a match is being subject to manipulation, for example
they may then respond by taking the odds into an untypically uncompetitive range. Thus odds
changes capture both bettor and bookmaker knowledge and behaviour and algorithms to identify
anomalous odds changes will therefore present a selection of cases where the behaviour of
bettors and bookmakers indicates a need for further investigation.
Perhaps the closest analogue to the FDS lies in the activity of agencies charged with detecting
insider trading on stock markets. Indeed the analogy is almost perfect to the extent that fixers in
sport are also seeking to trade on a financial market (betting) to profit from specific private
information (for example that players have agreed to concede a certain number of goals). Insider
trading watchdogs on stock markets, similar to Sportradar, “primarily look for suspicious trading
patterns, usually with a combination of sophisticated software systems, rules of thumb and
common sense”7. The procedures described below for picking out matches as suspicious indeed
embody use of both sophisticated computer algorithms and employment of judgement by
experienced specialists.
!!!!!!!!!!!!!!!!!!!!!!!!!!!!!!!!!!!!!!!!!!!!!!!!!!!!!!!!!!!!!
6
A comprehensive survey is provided by V. Chandola, A. Banerjee and V. Kumar, ‘Anomaly detection: A survey’,
ACM Computing Surveys, 2009, Article 15.
7
!N. Mehta, ‘The ins and outs of insider trading’, Financial Times, July 7, 2013.
4
!!
But in some sense analysts at Sportradar face a tougher problem than those of such as the US
Securities and Exchange Commission (SEC). Typically, national agencies such as the SEC are
empowered to obtain information on the identity of traders in cases when anomalies such as
heavy buying before a favourable announcement are observed (whereas this is not possible in the
betting market, where transactions often take place in regions with no effective regulation).
Further, the SEC is permitted itself to seek further evidence using law enforcement techniques
such as wire-tapping. Nevertheless, an ‘official’ speech on behalf of the SEC8 noted that it was
still rare to find a ‘smoking gun’ and so “insider trading is an extraordinarily difficult crime to
prove” because the evidence is very commonly just circumstantial. The SEC used American
experience to argue the importance of legislating insider trading as a civil as well as a criminal
offence, as America has done. Otherwise, deterrence of insider trading will fail because criminal
guilt beyond reasonable doubt will too often not be established whereas liability in the civil
courts can be adjudicated on the basis of the balance of probability. Thus SEC investigations
sometimes lead to criminal but more often to civil penalties. By analogy, screening for match
fixing will sometimes lead to criminal prosecution (as we will illustrate below) but it is realistic
to expect that offences will more often have to be considered within the framework of
disciplinary proceedings within sport.
In any case, analysis requires not just data to identify bursts of activity on the relevant financial
market but also detailed information on the real events that prices on financial markets reflect.
Just as with sudden price movements on the stock market, most sharp changes in odds may be
linked to events which make them ‘rational’. For example, pre-match odds on a football match
may shift abruptly an hour before kick-off when team line-ups are announced and markets then
re-evaluate outcome probabilities because of surprise omissions from one of the teams.
Therefore, to distinguish between ‘rational’ and ‘perverse’ or ‘suspicious’ price movements,
analysts need access to reliable sports data as well as sight of trends in the betting market. It is
also important that there is consistency in the time-stamping of sports and betting data. For
example, in the in-play market odds will normally shift substantially as soon as there is a goal
given that soccer is a low scoring sport and one goal is therefore typically significant for the
probabilities of final outcomes. A ‘normal’ odds shift following a goal would not therefore be
suspicious whereas the same odds movement shortly before the goal may justify closer scrutiny.
For all these reasons, our review had to pay great attention to the quality of data flowing within
the FDS and to the consistency of the time-stamping of these data. Again these are precisely the
issues faced in the monitoring of other financial markets by such as the SEC.
!!!!!!!!!!!!!!!!!!!!!!!!!!!!!!!!!!!!!!!!!!!!!!!!!!!!!!!!!!!!!
8
Speech by T.C. Newkirk at the 16th International Symposium on Economic Crime, Jesus College, Cambridge,
retrieved from www.sec.gov
5
!!
1.3 Criteria for assessing screening systems
The FDS is a screen for identifying fraud. It tests whole populations (for example, all matches in
a given competition) and its output is essentially to declare which matches have tested positive
and which have tested negative. In the general literature on screening, it is conventional to judge
the usefulness of any screen test against the criteria of sensitivity and specificity. These criteria
relate to the proportions in screen results of true positives, false positives, true negatives and
false negatives. Here:
A true positive would be a match which the FDS labelled as suspicious and which had indeed
been manipulated.
A false positive would be a match which the FDS labelled as suspicious but which had not in fact
been manipulated.
A true negative would be a match which the FDS had not labelled as suspicious and where
indeed nothing untoward had taken place.
A false negative would be a match which the FDS had failed to identify as suspicious but where
fixing had in fact occurred.
A screen is said to have high sensitivity when it classifies as positive a high proportion of cases
where the condition of interest is present, i.e. a sensitive screen does not miss out many true
cases.
A screen is said to have high specificity when it correctly classifies as negative a high proportion
of cases where the condition of interest is absent. High specificity indicates a low probability that
a positive test result is incorrect.
Generally, there is a trade-off between sensitivity and specificity. Where there is a higher cut-off
(or threshold) in the specification of criteria which determine whether the screen declares a
positive, this has the cost of raising the proportion of true cases missed by the exercise
(sensitivity is weakened). But a higher cut-off will normally improve specificity in that fewer
false cases will then be included in the set of cases subject to further investigation. In the general
case, the choice of cut-off will determine the relative degrees of sensitivity and specificity
attached to the screen; and in specifying the cut-off users will need to weigh the relative costs
associated with false negatives and with false positives. For example, in a medical application of
detecting a particular condition, it might be decided that missing cases (false negatives) was not
very costly because doctors could not anyway offer effective treatment for the particular
condition whereas false positives were costly because follow-up procedures to determine
whether a case was a true positive were invasive and traumatic for patients. In this sort of
6
!!
circumstance, the cut-off would be set very high or it might even be decided that the screen
should not be used at all.
But, where sensitivity and specificity are both judged important, a recommended approach to
avoid harm from trading-off between them is to introduce a two-stage screening9. The first-stage
screen is constructed to exhibit high sensitivity (but consequently low specificity). This makes it
likely that few cases in the population are missed. Cases testing positive at this stage are then
subject to a second-stage screen designed with the emphasis on specificity. The intention is to
eliminate a high proportion of the false positives generated by the first-stage screen. The
combined result from the two screens should then satisfy both desirable criteria, sensitivity and
specificity.
In some applications, the sensitivity and specificity of a one- or two-stage screen can be
evaluated numerically. Sensitivity and specificity are then typically measured as:
Sensitivity= (# of true positives) / (# of true positives + # of false negatives)
= probability that a true case is classified as true
Specificity= (#of true negatives)/ (# of true negatives + # of false positives)
= probability that a false case is classified as false.
In some circumstances sufficient information emerges after testing for a precise numerical
evaluation of these probabilities to be made on the basis of historic data. For example, algorithms
to detect credit card abuse will fail to identify some cases where a credit card has been stolen and
is currently being used by a criminal. But almost all cases of missing credit cards will eventually
be noticed and reported by the customer and so the number of false negatives over a sample
period will become known ex post. Sensitivity and specificity can therefore then be precisely
measured to provide yardsticks by which the utility and efficacy of the screening procedures may
be judged.
In the present application, to the FDS, such precise numerical evaluation is not possible. In fact,
sensitivity appears essentially unknowable in this case since any match fixing not revealed by the
screen is unlikely to be revealed subsequently. In principle, of course, there may in future emerge
!!!!!!!!!!!!!!!!!!!!!!!!!!!!!!!!!!!!!!!!!!!!!!!!!!!!!!!!!!!!!
9
See, for example, A.G. Laikhen and A. McCluskey, ‘Clinical tests: sensitivity and specificity’, Continuing
Education in Anaesthesia, Critical Care and Pain, 2008, pp. 221-223.
7
!!
a set of matches uncovered independently of the screen, for example if police stumble across a
criminal organisation with records of which matches it had fixed. It could then be ascertained
whether those matches had tested positive or negative in the FDS. This would be a fair test of the
sensitivity of the FDS always providing that the sample size was adequately large. But to date
there do not exist sufficient numbers of independently discovered known proven matches from
the limited period for which the FDS has operated for any measurement to be treated as a wholly
statistically valid estimate.
Nevertheless some indicative evidence was available to us in the form of case studies where law
enforcement had been involved in investigation of match fixing. There were some cases where
police had requested information from Sportradar regarding matches where fixing had been
verified in independently initiated investigations and to the point of criminal proceedings being
considered. If the FDS had in fact flagged up such matches at the time they were played, this
would be suggestive of ‘good’ sensitivity even if the sample size was too small to make a serious
numerical estimate of the sensitivity index.
Similarly, regarding specificity, relatively few reports from Sportradar lead to prosecution but
this does not imply that they were not true cases. Sports federations or law enforcement, for their
own reasons, may not take any follow-up action. For example, the federation may be nervous of
reputational damage to the sport or police and prosecutors may operate in a jurisdiction where
there is no clear offence with which to bring charges. This is an obstacle to calculation of a
specificity index. But, if a national federation does pass on reports to the police and these do
result in verification of malpractice, this would be at least suggestive of ‘high’ specificity.
Even where empirical evaluation of sensitivity and specificity is not feasible, the concepts should
not simply be ignored. They are the essential conceptual criteria by which the efficacy of any
screen should be judged. Our strategy for assessing sensitivity and specificity was to make use of
case studies to provide indicative evidence but also to investigate closely issues such as the
coverage of the data and the choices of cut-off points in the system’s specification. For example,
it is intuitive that the FDS would be insensitive (i.e. would often miss cases of fraud) if it
monitored only a narrow range of betting platforms or if it monitored only well-regulated betting
environments where criminals would be unlikely to place bets. Similarly, classification of
matches as suspicious would be unlikely to be adequately reliable if the data employed in the
testing procedure contained significant errors. Therefore examining the set-up of the FDS in
terms of detailed specifications and reliability of inputs also makes it feasible to form an
informed view of how confident clients can be in the sensitivity and specificity of FDS systems.
In general, we shall report below that the FDS breaks down into a number of consecutive stages
and that parts of the system emphasise sensitivity and parts emphasise specificity. This is
8
!!
consistent with the preference derived from the medical literature for the use of two-stage testing
procedures as noted above.
1.4 Structure of the Report
Following an initial inspection of the FDS internal documentation, we determined that
Sportradar had implicitly adopted an appropriate two-stage procedure, leading to final decisions
on classification of some matches as positive (i.e. suspicious). In the first stage which is
automated, screening yields alerts for a relatively high proportion of matches, which makes it
plausible that sensitivity will be high. In the second stage, which is broken down into two parts
(hotlisting and escalation), judgemental evaluation is applied in a systematic way to discard
evident false positives with the goal of assuring high specificity when cases are finally classified
as positives (suspicious matches).
1. Throughout the betting period for each match, betting odds are obtained at high frequency
from many platforms. Algorithms developed by Sportradar trigger e-mail ‘alerts’ to be
considered by one of the duty analysts in the London (or Hong Kong or Sydney) office. These
alerts can be considered as the first-stage screen. In the pre-match betting market, alerts are
mostly linked to changes in odds above a threshold (or cut-off) specified for the relevant football
league10 (‘odds’ in the FDS algorithms are expressed as a statistic termed ‘netwin’11). For a
subset of leagues, alerts may additionally be triggered by deviation (beyond a threshold) of
observed odds from ‘true’ odds where true odds are generated from a Sportradar probabilistic
forecasting model based on Elo ratings of teams. In the in-play market, alerts are linked to
significant deviation of odds from those predicted (‘calculated probabilities’) by a statistical
forecasting model where outcome probabilities depend on pre-match odds, the current score, the
time remaining and whether teams are currently short-handed because of red cards. Additional
criteria for alerts to occur include withdrawals of market by bookmakers and unexpectedly high
volume on Betfair.
To test the reliability of these components of the FDS required us to consider whether the
coverage of the betting market was adequate; to verify the accuracy of the processes for
collecting data from both the betting market and the sports event; to check for appropriate
synchronisation of the timing of data on odds and scoreline; to examine back-up procedures to
be used in the event of failure of the automated procedures for collecting data; to check the
validity of defining odds by the statistic ‘netwin’; to assess whether the thresholds set for alerts
!!!!!!!!!!!!!!!!!!!!!!!!!!!!!!!!!!!!!!!!!!!!!!!!!!!!!!!!!!!!!
10
Thresholds are higher in low-status leagues where the liquidity in the associated betting market is typically lower
and thus even relatively small money flows may shift odds markedly.
11
!Netwin is the profit that would accrue to the successful bettor for a one unit stake. To illustrate, suppose the
bookmaker quoted ‘decimal odds’ (now the conventional way of quoting odds) of 1.5. This means that a successful
bettor would have a claim to 1.5 units of money per unit staked. But part of this is return of stake: the profit or
‘netwin’ is only 0.5 money units per unit staked. Thus netwin= odd-1. In fact, it is also the number that used
traditionally to be quoted by British bookmakers who would express the odds as 1/2 (=0.5).
9
!!
are sensible; to consider whether the specification of the statistical models conform with best
practice in the field; and to test the empirical performance of the statistical models.
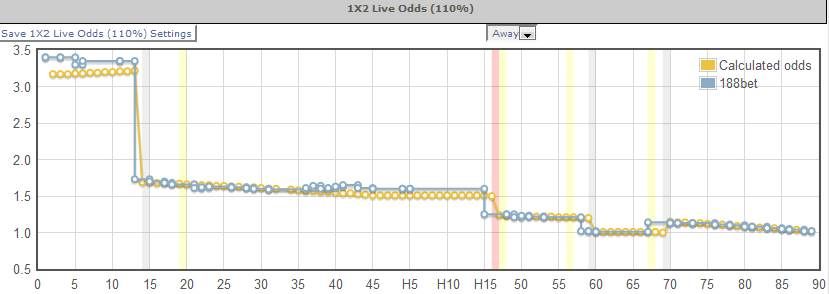
2. Where an alert or multiple alerts on the same event are generated, the analyst sees the
‘deviation’ in odds in tabular and/or graphical form (also information on whether any
bookmakers have withdrawn coverage of a match). At this stage, the system gives him access to
any additional information available, for example on latest sporting data, such as team news, and
any relevant recent reports from correspondents (‘freelancers’) engaged to report significant
football stories to Sportradar on a routine basis. The analyst may also use online sources to
research possible factors triggering the alert. Then the analyst must use skill, knowledge and
experience to judge whether the alert can be dismissed or should remain under active
consideration in the FDS. Knowledge of both sport and betting has to be used in decision-taking.
For example: in the in-play market, a deviation from the calculated odds might be explained by a
red card having been awarded to an unusually influential member of the team (the statistical
model takes account of the award of a red card but not of the identity of the carded player); and
whether bookmakers failing to offer in-play betting on a match is significant depends on what is
the usual commercial practice for those bookmakers for that League. The analyst therefore needs
to draw on his knowledge of sport and of betting markets. Having reached a judgement based on
such considerations, reasons must be logged in the FDS. If the analyst cannot find adequate
legitimate reason for the alert and so still finds the match potentially suspicious, then, subject to
agreement by a supervisor, the match is ‘hotlisted’ for further consideration in the FDS. This
process can be interpreted as the first part of the second-stage screen, filtering out false positives
from the first-stage that can be judged as such by appropriately experienced personnel aided by
appropriate collated information.
We obtained documentation of the career paths of each analyst to inform our judgement of
whether their background and skills equipped them for the task of accurately weeding out false
positives. We observed them at work to help us understand this stage in the operational process
and form a view on how effectively and reliably it was carried out. A new information source not
covered at stage 1 was the system of freelancers employed by Sportradar to cover each country
where it has a client competition. We reviewed the procedures used by Sportradar to control the
quality and relevance of information flows from freelancers.
3. Details of any match which has been hotlisted are flagged up in the FDS to allow other
analysts to consider the case. Meanwhile, the supervisor sends questions seeking further
information about the match from the freelancer in the relevant country. The questions broadly
follow a set pattern but are modified in each case to be made specific to the match under
suspicion. Responses are expected within 24 hours. In some cases, questions are also sent to the
‘scout’ who attended the game (Sportradar has a scout at many matches, with the primary
responsibility of supplying reliable sports data, such as time of kick-off and principal match
events). Sports data are validated and further analysis of personnel in the match is conducted.
10
!!
Once all the relevant documentation has been assembled, normally on the day after the match,
analysts and supervisor compare the facts against a ‘suspicious betting checklist’. They debate
the circumstances of the match and reach a consensus on whether Sportradar should issue a
warning to the client sports federation or competition. The number of personnel involved in this
debate varies according to duty periods but at least three analysts must formally agree for the
process to move towards a warning being issued, which would signify that the evidence
indicated strongly that the match had been manipulated. Normally many more than three are
involved in decision-taking and sometimes opinions are sought from other offices. In the event
that a decision to escalate is taken, the team will allocate one of three warning levels (for use
internally) and the analyst responsible for the match will write a full report, which is subject to a
checking process. In the alternative case where the judgement reached is that there are
insufficiently strong grounds for concluding that the match had been manipulated, the analyst
writes a detailed statement to interpret/ explain what was observed in the betting data. This
statement is checked by the supervisor and then referred to the weekly ‘Escalation Review’,
which has the option to report the match after all.
Our review of this second part of the second-stage screening, termed the ‘escalation process’ by
Sportradar, included attendance at the discussions on four hotlisted matches (for two of which it
was decided to issue warnings, i.e. two ‘positive’ final test results were declared) as well as
interviews with analysts and inspection of internal documents describing the procedures to be
followed. We also inspected a sample of questions sent to freelancers and their replies. Other
documents subject to review included the manual setting out how a report on a suspicious match
should be written and what information it should include. We obtained data on the number of
matches which triggered alerts, the number which were hotlisted and the number for which a
warning to the football authority was issued. We used all these sources to form a judgement on
the efficacy of the procedures followed for deciding on which matches from the previous steps in
the review process were finally to be categorised as positives according to the FDS screen.
We have provided here a basic outline of how the FDS works (more detail will be presented
below) in order to draw out some of the key tasks which we judged would have to be included in
our Evaluation. Subsequent sections of the Report will focus closely on particular components of
the overall task.
Thus, Section 2 covers all issues related to the range and quality of data concerning both the
betting market and the sport. Section 3 presents a formal review of the statistical models
embedded within the FDS. Section 4 examines the alerts process including alert logic and rules.
The next stage in the FDS is for an analyst to decide whether a match subject to an alert or alerts
merits more detailed consideration: this ‘hotlisting’ stage is described and discussed in Section 5,
which also reports on the next stage, the escalation process. Section 6 considers case studies of
matches where there is police or judicial evidence of manipulation and how the FDS performed
with respect to those matches. Section 7 offers some reflections on our exercise and Section 8
summarises our conclusion. Appendices present technical details and a diagrammatic
representation of FDS processes to assist readers further in understanding how the FDS works.
11
!!
2 THE QUALITY, SCOPE AND RELIABILITY OF THE DATA USED IN
THE FDS
2.1 Introduction
The essence of the FDS is to monitor for irregular (and potentially suspicious) activity in betting
markets where what is to be regarded as irregular cannot be defined independently of the
situation in the sports event (for example, the strength of the teams for the pre-match market, the
latest score for the in-play market). It is therefore a necessary condition for the efficacy of the
FDS that appropriate data are collected from both the betting and sports sectors and that there be
adequate assurance that all the data input into the FDS are reliable. In this section, we review
first the assembly of betting data, then the assembly of sports data and, finally, the important
process of ensuring consistency between them in respect of the timing of events occurring in
each sector.
The emphasis in this section is on data collection and processing prior to and during the match.
These data feed directly into Stage 1 of the FDS where algorithms identify circumstances where
what is observed justifies the sports event being moved into the first part (and then possibly the
second part) of Stage 2, where it will be given further consideration by analysts as a potentially
manipulated event. During the stage 2 procedures, additional information may be sought by
analysts to inform their judgement. We will comment on the quality of the supplementary
information gathered at those points in later sections. The present section focuses on the data
collected before and during the match and fed directly into the system, to be used by the
algorithms in automatically creating alerts according to parameters set within the FDS.
2.2 Odds Data
The scope of the data
Steadily, since the Millennium, and in response to development of technology conducive to
remote gambling, the sports betting market has evolved into a truly global financial market. For
example, betting on any football match in Europe will be offered by bookmakers located all over
the World and by many different types of bookmaker, such as European or Asian, licensed or
illegal, state-owned or private-sector. In the contemporary globalised world, whichever way the
market is segmented, one sector does not operate in isolation from the rest. For example, a surge
of money on one side of a bet in Asia will shift odds in Asia. But, following the odds shift
triggered by weight of new money in Asia, sophisticated private traders, perhaps using
automated trading, may seek to exploit any resulting gap in odds between Asia and Europe
(arbitrage); where the odds shift is large, European bookmakers may proactively adjust their own
odds to close down arbitrage opportunities and to reduce risk. As a consequence of these
activities, significant odds movements in Asia will typically be echoed on European markets
12
!!
very quickly afterwards. The process is the same as in any other financial market where
technology permits traders in one region to access markets in another region. If ‘something is
happening’, ripples will be observed in many sub-sectors even if the relevant initial trades were
all executed in one centre. Consequently, suspect matches in FDS often trigger multiple alerts
(across bookmakers) and alerts may also occur in response to flows of tainted money which were
initially placed with non-observed operators. Complete coverage of all bookmakers is not
therefore a pre-requisite for the efficacy of the FDS.
In fact, the number of bookmakers operating in the World is unknowable since those located in
countries where betting is illegal (for example, China, India, USA) are not registered with any
authority. Any monitoring exercise must therefore rely on observing odds movements in only an
observable subset of bookmakers which offer wagers on a particular event. Inevitably this runs
the risk that some small-scale home-made fixes will escape detection. However, any resulting
weakening of the sensitivity of the monitoring is likely in practice to be slight and not to affect
the ability of the system to detect significant fraudulent activity. The FDS brings together data
from (currently) 286 betting websites (listed in Appendix A) located in Asia, Australasia, the
Americas, Africa and Europe. Its coverage in terms of types of operator is equally
comprehensive, including state lotteries in Europe which offer sports betting, private sector
providers of both land-based and remote betting in Europe, all major trans-national operators, a
number of unambiguously illegal operators which are not licensed anywhere, and Betfair12, by
far the dominant ‘betting exchange’. Crucially, coverage also extends to the largest Asian
bookmakers including SBOBET and MAXbet.
SBOBET and MAXbet are licensed in Cagayan, Philippines and are the largest bookmakers in
the World, each with several times the annual sports betting turnover of major European
providers such as William Hill. These are legal operators in the jurisdiction where they are based
but are often described as occupying ‘grey markets’ because they draw in money from the illegal
markets across Asia: local bookmakers across Asia are unable to bear liability risks associated
with large bets and risk is managed by risk pooling, which in practice means passing on such
bets upwards through a hierarchy of sports books and agents such that, eventually, a large
proportion of illegal bets reaches the Cagayan operators. By monitoring SBOBET and MAXbet,
and other significant trans-national operators which serve a similar function, the effective
coverage of the FDS is therefore extended across a large region where bets are made illegally
and where, in fact, a high proportion of World stakes on (say) European and Australian football
matches are placed. From the criminal trials of match fixers, we know that betting associated
with large-scale fixing is in practice nearly always channelled through Asia because larger bets
!!!!!!!!!!!!!!!!!!!!!!!!!!!!!!!!!!!!!!!!!!!!!!!!!!!!!!!!!!!!!
12
!An important feature of the Betfair data is that FDS is able to observe not only odds but also volumes transacted.
In the case of Betfair, FDS procedures trigger alerts not only when abnormal odds changes are observed but also
when the level of activity is unusually large.
!
13
!!
are accepted there and lack of meaningful regulation ensures that funds cannot be traced back to
source in the event that a match falls under suspicion.13
The sensitivity of the FDS, at least with respect to sizeable fraud, appears therefore unlikely to be
compromised by insufficient coverage. If large bets are placed with any operators not covered by
monitoring, it is probable that these relatively small bookmakers will pass on the bets up the
chain to avoid risk and they particularly have an incentive to do so if they suspect they are
dealing with fixers (indeed they may add their own funds so as actually to profit from the fix).
Thus nefarious money is very likely to enter the observed sector of the Asian market.
The fixers’ money is not observed directly but through odds changes. These will occur because
the major Asian operators hold to a ‘book balancing’ business model where they seek to equalise
liabilities across sporting outcomes.14 If there is a surge of money on one outcome, they will
reduce exposure to that outcome by adjusting odds and may sometimes also hedge with other
operators, causing secondary changes in odds which will again be observed in the FDS.
The set of bookmakers for which odds are monitored by the FDS is therefore large, sufficiently
comprehensive to pick up the effects of suspicious money flows in Asia in the markets where
they are placed, and comprehensive enough also to detect local fraud in other regions including
Europe where unsophisticated offenders may bet with familiar local operators.
Taking all these factors into consideration, we judge that the breadth of coverage of betting
platforms is sufficient for us to be confident in its ability to detect a high proportion of
significantly-sized fraudulent activity. That not all of the betting market is observed directly
!!!!!!!!!!!!!!!!!!!!!!!!!!!!!!!!!!!!!!!!!!!!!!!!!!!!!!!!!!!!!
13
This is not to say that observation of operators in Europe is redundant even in cases where the primary focus of
the fixing operation is in Asia. For example, criminals arrange that players should deliver a certain outcome in an
Italian football match and plan to make their illicit profit by wagering on that outcome in Asia. But the players
concerned know about the fix and they or their families and associates to whom the information has leaked place
local bets to benefit personally from the corruption. The local bookmaker receives heavy betting on one outcome
and alters odds as part of risk management. The odds change is picked up by the FDS. Probably this will be the first
sign of a fix because the professional criminals will bet late to avoid alerting the market. That the abnormal activity
in the Asian market was preceded by unusual localised activity in the country where the match takes place would
make the conclusion that a match was fixed more compelling.
14
Empirical evidence that Asian bookmakers aim to maintain balanced books rather than take positions is provided
in A. Grant, J.E.V. Johnson and T. Oikonimidis, T. (2013). Bettors vs. Bookmakers :1-0 ! Examining the origin of
information in football betting markets. Working Paper, University of Sydney. This paper also includes convincing
econometric evidence that changes in odds observed at SBOBET have strong predictive power in a forecasting
model for match results in Europe, indicating that those with valuable, relevant information find it advantageous to
wager at providers where the funds eventually arrive in the Phillipines-based bookmakers. Fixers are one class of
bettors possessing valuable, relevant information.
!
14
!!
appears unlikely seriously to weaken the sensitivity of the FDS (and of course it does not affect
specificity at all).
The quality of the data
The FDS uses odds data from both the pre-match and in-play markets. Many bookmakers
provide a live feed of odds to Sportradar voluntarily. For these bookmakers, no checking of the
accuracy of the odds is necessary – the information comes directly from the source, identically to
how it appears to clients using the particular website. On the other hand, some bookmakers,
particularly Asian bookmakers, do not provide Sportradar with a live feed of odds. For these
other bookmakers, which include some of the World’s biggest operators, Sportradar uses web-
crawlers to scrape the data from the bookmaker’s website.
Web-crawlers are automated pieces of software that scrape information off websites. During any
match being monitored by the FDS, a web-crawler visits each bookmaker’s website and scrapes
the odds every minute, or immediately following a goal or red card event. Web-crawling of
websites which change or update information are notoriously difficult to scrape data from since
small changes in the positioning of information on a webpage will result in the data being
scraped incorrectly. As a consequence of this, information from the FDS crawlers are used in
tandem with automated screenshots of the webpages. These are error free in that they are a
‘photograph’ of what the webpage showed at a certain time.
The FDS uses these screenshots as a backup data source in the event that the web-crawlers fail.
Here we use them to validate the accuracy of the data collected by web-crawlers. Our experiment
is simple: for a sample of matches and leagues and bookmakers, see whether the screenshots
agree with the data scraped from the bookmaker’s website.
Screenshots are taken once per minute, whilst odds are recorded at a higher frequency. As such,
there are sometimes small discrepancies between the value shown on the screenshot and the
value recorded in the scraped data. In cases where the discrepancy lasted for only a few seconds,
we treat the two sources as identical.
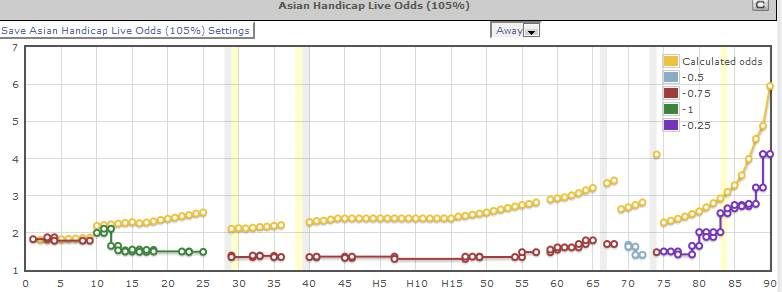
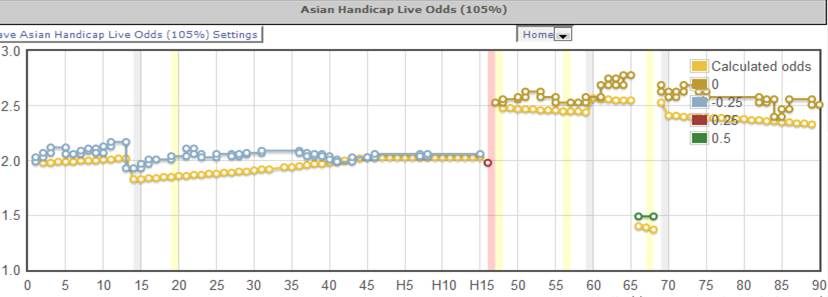
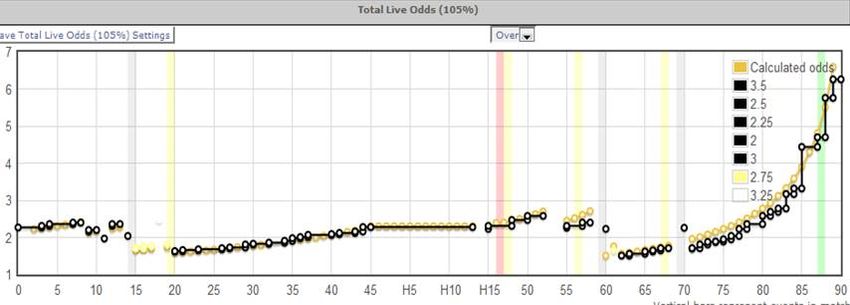
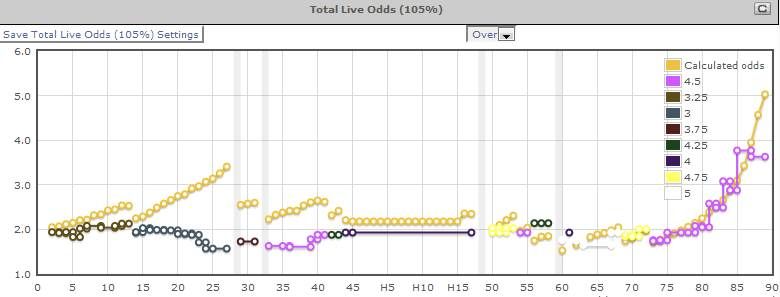
Appendix B presents a table showing the identity of the matches and the time points at which the
screenshot and crawled odds were compared. For each of the 148 matches, data were collected
on either the 1X2 market or the Asian Handicap market. For odds collected on both of these
markets, three pieces of odds data are recorded. For the 1X2 market the information is the odds
available on the home win, draw, and away win match outcomes, whilst for the Asian Handicap
market the information includes the over-under prices, and the amount of handicap offered. Out
15
!!
of 148 individual matches and 444 pieces of information, consistency between the odds on the
screenshot and the odds captured by the web crawler was found in all cases.
To get an idea of how likely this is, suppose there is a 1% chance of an error in the webcrawling
data. Observing no errors in 444 experiments (or 444 out of 444 correct pieces of information)
has a probability of occurring of just 0.0115.
We view this as strong evidence that the web crawlers have been deployed in the FDS to perform
their functions correctly, for example collecting the ‘right’ odds on the webpage. We can be
confident that the automated capture of odds data using web crawlers works virtually as well as
if the relevant operator were supplying odds from its website directly to the FDS.
We also satisfied ourselves that Sportradar has appropriate software in place to detect any failure
of equipment which might occur and appropriate written procedures in place to ensure timely
remedial action. The relevant internal documents are covered by ISO9001 certification.15
2.3 Sports Data
In the FDS, sports data relate to information about events occurring which are solely related to
the teams and players of the football leagues being monitored. Match dates, teams involved, final
scores, timings of goals, team line-ups, details of red and yellow cards (player names and their
timings) are all examples of sports data.
As noted already, accurate sports data are a necessary component of an efficacious system of
monitoring betting markets. Irregular betting activity cannot be identified as such unless it is
compared with what the activity would be expected to look like given the sporting situation.
For many matches, the primary source of live, real time sports data fed into the FDS is the
network of scouts employed by Sportradar. We were advised that, of matches subject to FDS
monitoring in 2015, scouts watched approximately 39% at the ground. The role of scouts is
!!!!!!!!!!!!!!!!!!!!!!!!!!!!!!!!!!!!!!!!!!!!!!!!!!!!!!!!!!!!!
15
ISO9001 certification is awarded by authorised independent auditors who have satisfied themselves that quality
management procedures in the company or institution inspected comply with best practice standards as set out in an
international agreement concluded in 2008. Sportradar’s certification was awarded in July, 2014 with registration
number TIC 15 100 148923. There is annual auditing and certification has to be renewed every three years to ensure
continued compliance with quality management standards.
16
!!
directly to input major match events such as the occurrence of goals and red cards as they occur.
The information they present is therefore immediate. FDS also collects live data for all matches
(scouted and non-scouted) from bookmaker and other external websites by means of livescore
crawlers .
Naturally, there is sometimes a discrepancy between the information for the same event provided
by different sources. This could arise because a website has an error (for example, showing 10-0
instead of 1-0 as the score). More routinely, discrepancies between sources will be present when
one has already registered a new incident such as a goal whereas others have not yet caught up.
For example, one source may display the score as 2-0 when others still have 1-0.
An automated system is in place to select the most reliable current information from the array of
sources, scouts and external, used by the system. Very detailed algorithms apply principles such
as prioritisation of some sources over others on account of a record of greater reliability, filtering
out of information with obvious errors, such as a change in score from 3-1 to 3-5 in one step, and
treatment of the first source reporting a new goal in the match as the best source until there is
reason to suppose otherwise.
While Sportradar has invested heavily to ensure the accuracy of data driving the automated part
of the FDS, It may be noted that data are further checked across sources, and additional
information requested from freelancers, for any match passed on for further consideration as
potentially manipulated. Therefore no decision on whether a match should finally be classified as
suspicious by the FDS can be made before post-match verification of the sports data for that
match. Post-match checking of data and the quality of additional information gathered at this
point will be considered further in the analysis of post-match procedures (Section 5.3 below).
2.4 Synchronisation of Odds and Sports Data
A difficult task in the FDS is that of synchronisation of the odds and sports data. This is essential
to determine whether odds changes occur at an appropriate time, for example just after a goal.
This requires rather precise conformity (with respect to the timing of events) between betting and
sporting data fed into the system.
To synchronise odds and sports data, Sportradar first identifies the ‘time-stamp’ for the start of
the match. To do this relies on some bookmaker’s websites giving a ‘match-clock’ as well as live
odds. Sportradar then backwards calculates the bookmaker’s game start time by taking the
17
!You can also read