State-of-the-Art Report - Visual Computing in Radiation Therapy Planning - VRVis
←
→
Page content transcription
If your browser does not render page correctly, please read the page content below
EUROVIS 2019                                                                                                                Volume 38 (2019), Number 3
R. S. Laramee, S. Oeltze, and M. Sedlmair                                                                                 STAR – State of The Art Report
(Guest Editors)

                                                            State-of-the-Art Report
                                             Visual Computing in Radiation Therapy Planning

                                 M. Schlachter1 , R.G. Raidou2 , L.P. Muren3 , B. Preim4,5 , P.M. Putora6,7 , and K. Bühler1

            1 VRVisResearch Center, Vienna, Austria 2 TU Wien, Austria 3 Department of Medical Physics, Aarhus University Hospital, Denmark
                                     4 University of Magdeburg, Germany 5 Research Campus STIMULATE, Germany
      6 Department of Radiation Oncology, Kantonsspital St. Gallen, Switzerland 7 Department of Radiation Oncology, University of Bern, Switzerland

        Abstract
        Radiation therapy (RT) is one of the major curative approaches for cancer. It is a complex and risky treatment approach, which
        requires precise planning, prior to the administration of the treatment. Visual Computing (VC) is a fundamental component of
        RT planning, providing solutions in all parts of the process—from imaging to delivery. Despite the significant technological
        advancements of RT over the last decades, there are still many challenges to address. This survey provides an overview of
        the compound planning process of RT, and of the ways that VC has supported RT in all its facets. The RT planning process
        is described to enable a basic understanding in the involved data, users and workflow steps. A systematic categorization and
        an extensive analysis of existing literature in the joint VC/RT research is presented, covering the entire planning process. The
        survey concludes with a discussion on lessons learnt, current status, open challenges, and future directions in VC/RT research.
        Categories and Subject Descriptors (according to ACM CCS): J.3 [Computer Graphics]: Life and Medical Sciences—Health,
        Medical information systems

1. Introduction                                                                   ensure adequate irradiation of the tumor target and to spare the
                                                                                  surrounding healthy tissues, as much as possible. To this end, pre-
According to the World Health Organization (WHO), cancer is the
                                                                                  cise delineation of the target tumor and all adjacent organs at risk
second leading cause of death worldwide [Wor18]. In 2018, 18.1
                                                                                  (OARs) is necessary. Dose calculation through simulation is then
million people were globally diagnosed with cancer, while 9.6 mil-
                                                                                  carried out for each individual patient, in order to assess whether a
lion deaths have been attributed to malignancies. For most cancer
                                                                                  sufficient dose to destroy the tumor is achieved, while maintaining
types, radiation therapy (RT) and surgery are widely used for cura-
                                                                                  tolerable doses to the OARs.
tive purposes [DJFB05, ZM16]. RT has been used as cancer treat-
ment for more than a century [Sla12], and has undergone steady                       The treatment process can be internal (e.g., Brachytherapy treat-
development in the past decade [THM∗ 13]. It is used as thera-                    ment) or external (e.g., External Beam Radiation Therapy or
peutic treatment to cure the disease, as adjuvant therapy to pre-                 EBRT) [Was15]. In the former, radioactive sources are positioned
vent tumor recurrence, or as palliative treatment to relieve patients             precisely inside the area to be treated, affecting only a very local-
of symptoms. Often, RT complements surgery, chemotherapy, hor-                    ized region [GPM∗ 02]. In the latter, the radiation source is a lin-
monotherapy, immunotherapy, or a combination of those [Was15].                    ear accelerator (LINAC), and is located outside of the patient. The
The risky and complex nature of RT treatment make it a special                    LINAC accelerates electrons, allowing them to collide with a heavy
field of application within VC, as it requires rather sophisticated               metal target to produce high-energy x-rays, shaped to conform to
combinations of a wide range of VC techniques.                                    the shape of the target volume covering the tumor. The beam is
   RT is based on the use of ionizing rays, such as photon, electron              shaped by a multileaf collimator and is directed to the tumor by a
or proton radiation, to destroy malignant cells. Tumors are treated               gantry rotating around the patient, who lies on a movable treatment
with higher radiation doses, while adjacent healthy organ tissues                 couch. A schematic depiction of a LINAC is presented in Figure 1.
must receive lower doses, to minimize the side effects of radia-                  In this survey, we focus on EBRT, as it is the most widespread treat-
tion [Was15]. The administered radiation dose used in RT is mea-                  ment in current clinical practice—hence, visual computing (VC)
sured in Grays (Gy), and varies depending on the type and stage of                solutions have mostly addressed this.
the cancer, as well as the intent of treatment.
                                                                                     The complex data, the compound processes and the multitude of
   RT involves much higher dose of radiation than diagnostic                      user groups involved in RT make it particularly interesting for sev-
modalities, such as CT and X-ray. Thus, there is a high risk of tis-              eral fields of research [PB13]. These include image processing, vi-
sue damage leading eventually to secondary cancer, and planning is                sualization, VC and machine learning. Currently, there are several
more important than in any other kind of medical treatment. Prior                 reasons which bring RT into the spotlight of clinical and technolog-
to dose administration, the treatment must be carefully planned to                ical research, leading also to new challenging research questions for

 c 2019 The Author(s)
Computer Graphics Forum c 2019 The Eurographics Association and John
Wiley & Sons Ltd. Published by John Wiley & Sons Ltd.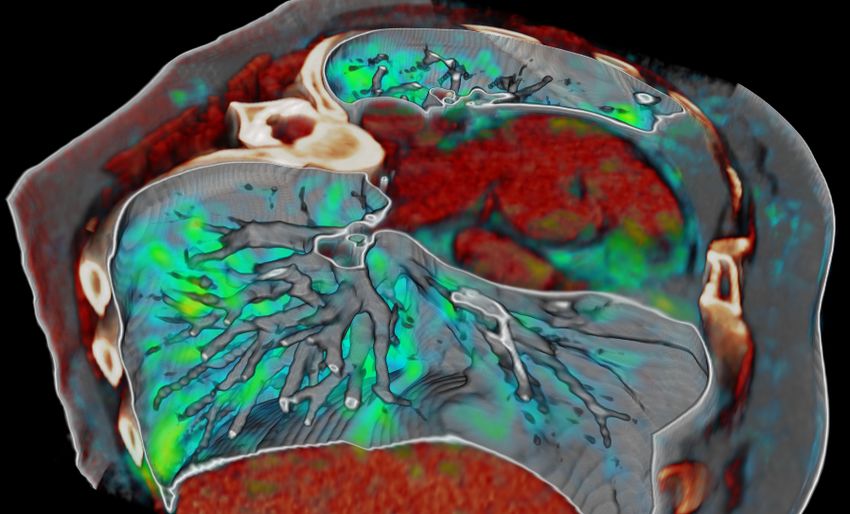
M. Schlachter & R.G. Raidou & L.P. Muren & B. Preim & P.M. Putora & K. Bühler / STAR: Visual Computing in Radiation Therapy Planning

                                Laser                                       RT can be challenging for tumors and organs affected by breath-
             Gantry                           Collimator
                                                                            ing, e.g., the lung [BCTT08, KMB∗ 06]. In particular, for treat-
     X-ray Target                                                           ment methods which involve critically high doses, such as Stereo-
                                                     Digital Position       tactic Body RT (SBRT) for lung cancer, even slight movements
                                                     Indicators
                                                                            cannot be ignored. 4D imaging and deformable registration can
                                                                            be used to model breathing motion [WSVHD08], but these in-
                 Beam Axis
   Laser                                                Laser               troduce uncertainty [SFJ∗ 16]. Uncertainties are also present in
                                                                            segmentation [RBGR18, RMB∗ 16] and (radiobiological) model-
                                                                            ing [RCA∗ 18, RCM∗ 16], to name a few. In particular, within ra-
  Gantry Axis
                                                                            diobiological modeling, the careful quantitative reasoning about the
                                                       Isocenter            probability of tumor control is unique for medical treatment. Thus,
                                                                            uncertainty qualification related to predictions and uncertainty vi-
                                                Patient                     sualization fit in the workflow of RT planning, as opposed to other
                                                Treatment
                                                                            types of medical treatment.
                                 Rotations      Couch
                                                                               Another important aspect is the variety of specialists involved in
Figure 1: Schematic depiction of a linear accelerator (LINAC)               the different steps of the RT workflow, such as radiologists, radia-
used in External Beam Radiation Therapy (EBRT) treatment, with              tion oncologists, medical physicists and dosimetrists. While patient
its major components and employed axes. Rotational and transla-             treatment is the primary goal, users have different benefits from the
tional movements of several parts are depicted with arrows.                 use of VC [PB13]. These may include, e.g., diagnosis, data explo-
                                                                            ration, verification or decision making. Therefore, the needs of dif-
                                                                            ferent users need to be addressed individually, increasing the com-
                                                                            plexity of the visual design process [DNT09].
VC. Recently, there is an increasing demand for more personalized
                                                                               Despite the importance of VC in RT, the last surveys have been
therapy, which will maximize tumor treatment and minimize side
                                                                            published over a decade ago [Eva08,PC00,Pel98,PGC∗ 96,Rob99].
effects [THM∗ 13, TOG06]. This trend requires the development
                                                                            They address only imaging and volume rendering within the appli-
of new means within the VC domain, while targeted patient treat-
                                                                            cation domain of RT, and do not cover the latest advancements.
ment includes more and more often additional patient- and tumor-
                                                                            There has not been any previous effort in systematizing existing
specific information [TOG06]. All this information is complex and
                                                                            literature in the field and in providing recommendations for future
heterogeneous, and new strategies for its visualization, exploration
                                                                            directions for VC in RT. With this survey, we expect to trigger inter-
and analysis need to be designed [Rai17].
                                                                            esting new directions for future work, both in RT applications and
   There is a significant amount of work applied in the various steps       in other domains. Apart from the need for VC strategies to tackle
of the RT workflow, covering a wide range of VC research. De-               challenges in RT planning, we foresee that existing ones for the
veloping novel VC methods to support RT research and RT plan-               RT workflow can be reusable, generalizable or applicable to other
ning requires interdisciplinary strategies—integrating the whole            fields—also non-clinical ones.
VC portfolio from data, image and information fusion [NRS∗ 14,
                                                                            Contributions—The contributions of this survey are:
SFA∗ 17], to interaction [AvHL∗ 17], exploration and visual ana-
lytics [Rai17, RBV17, RMB∗ 16, RvD∗ 15, RvdHvH∗ 14]. The topic              • A comprehensive and comprehensible taxonomy of published
is also manifold, involving different sources of data and uncer-              work in the field of VC, applied to the domain of RT.
tainty, several specialist users, and a variety of applications and         • A discussion, underlining the achievements of VC in RT so far,
challenges—many of which are also applicable to other medical                 highlighting the main challenges and limitations, and envision-
and non-medical domains.                                                      ing applicability for future work.
                                                                            • The identification of key research directions for the future based
   As we will illustrate in the upcoming sections, RT planning
                                                                              on the taxonomy and discussion.
involves multi-modal and multi-valued data [Was15]. Also, each
step of the RT workflow involves heterogeneous sources of infor-            Scope of this work—For the collection of previous work in-
mation. These might relate, for example, to multi-modal registra-           cluded in the taxonomy, we used an extensive search of literature
tion [SFJ∗ 16] and segmentation data [RMB∗ 16], to ensemble data            databases. Results of the literature search were required to cover
from the optimization phase of the dose planning [SRV16], or to             or to be related to visual computing, radiotherapy and its planning.
modeling data from tumor control probability (TCP) [RCM∗ 16]                After the initial literature search, results were removed if they were
and normal tissue complication probability (NTCP) [RBGR18,                  not within the scope. We consider within scope all applications
RCA∗ 18]. Understanding, exploring and analyzing all these data             from the field of VC (visualization, visual analytics and VR/AR
channels can be a demanding and time-consuming task.                        applications) that are related to one or more steps of RT planning.
                                                                            We consider out of scope previous work that was not within the VC
   Additionally, uncertainty [Rai18, RPHL14] is present at all steps
                                                                            and RT planning interface. Details about the literature search and
of the workflow, affecting the accuracy and precision of the final
                                                                            sources are explained in Section 3 and summarized in Table 1.
outcome [BCTT08, KMB∗ 06, vRL02]. Uncertainties, which can-
not be corrected or minimized, need to be addressed and their               Outline—The remainder of this survey is structured as follows. In
impact has to be predicted. For example, motion management in               Section 2, we discuss necessary background notions of the RT do-

                                                                                                                                               c 2019 The Author(s)
                                                                              Computer Graphics Forum c 2019 The Eurographics Association and John Wiley & Sons Ltd.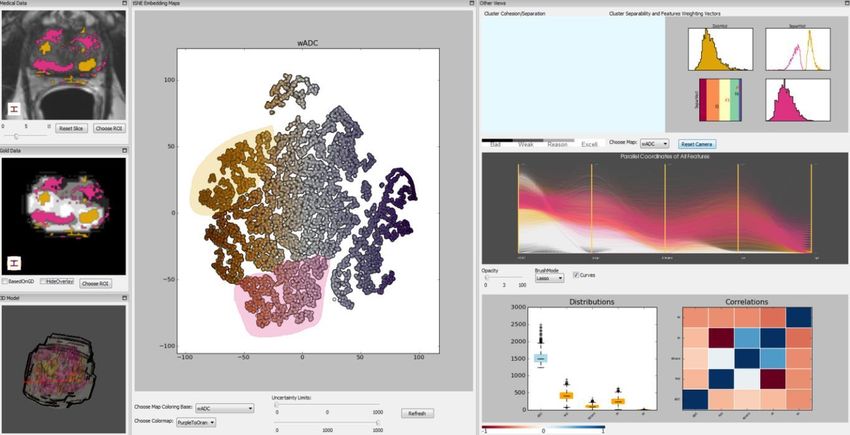
M. Schlachter & R.G. Raidou & L.P. Muren & B. Preim & P.M. Putora & K. Bühler / STAR: Visual Computing in Radiation Therapy Planning

                                                                                                                     Spatial Evaluation         Non-Spatial Evaluation

            Diagnosis                 Imaging            Definition of Target Treatment Plan Design  Dose Plan Review            Image Guided       Setup Verification
            & Referral               Acquisition      Volumes & Organs at Risk & Dose Calculation & Treatment Evaluation          Adaptive RT         & Treatment

                      Data Registration              Data Fusion                         Data Segmentation        Data Exploration & Analysis

Figure 2: The steps of the workflow of RT planning, as adapted from the book of Washington and Leaver [Was15]. Within this survey, we are
concerned with the workflow parts, within the gray margins. Note that most of workflow steps comprise sub-steps, some of which are denoted
in the blue pop-ups.

main. In Section 3, we present the taxonomy scheme and a detailed                                depth workflow analysis has been previously presented by Aselmaa
description of previous work falling within each of the taxonomy                                 et al. [AGL∗ 13].
categories. Furthermore, we discuss evaluation methods and areas
of main concentration of the literature. Section 4 presents an out-                                 After diagnosis and referral, patient images are acquired
look from the RT domain. Section 5 discusses so-far achievements                                 [TAKC09]. Multiple imaging modalities are often employed, as
of VC in RT, as well as present challenges or limitations, and di-                               studies have demonstrated that the combination of different ac-
rections for future work from a joint VC/RT perspective. Section 6                               quisitions can improve detection, diagnosis and staging [BJE∗ 11,
concludes the survey with a summary of this work.                                                BRC∗ 12, CKK∗ 07, HCE∗ 07]. Clinical imaging techniques can be
                                                                                                 classified into anatomic methods, which measure physical proper-
                                                                                                 ties of tissue, such as tissue density acquired from Computed To-
2. Radiation Therapy Planning: Workflow, Data and Users                                          mography (CT), and functional imaging techniques, which mea-
                                                                                                 sure functional characteristics, such as metabolism acquired from
In the past decade, RT has undergone a steady evolution (see Sec-                                Positron Emission Tomography (PET) [Eva08]. In a prostate cancer
tion 4), offering flexibility in radiation dose delivery. The advent of                          case, multi-modal imaging can include CT Imaging, T2-Weighted
new delivery techniques has improved treatment, such as Intensity-                               Magnetic Resonance Imaging (MRI), Diffusion-Weighted Imaging
Modulated Radiation Therapy (IMRT) and more recently Volu-                                       (DWI), Dynamic-Contrast Enhanced MR Imaging (DCE-MRI) and
metric Arc Therapy (VMAT)—both subsets of EBRT. These tech-                                      MR Spectroscopy Imaging (MRSI) [BJE∗ 11, BRC∗ 12, CKK∗ 07,
niques can precisely address tumors, by modulating the intensity of                              HCE∗ 07].
the radiation beam around the tumor volume, while decreasing or
avoiding radiation among the surrounding healthy tissues [Web01].                                   A crucial step of treatment planning is the definition of target
This modulation, i.e., shaping and aiming of radiation beams from                                volumes, i.e., the tumor tissue, and organs at risk (OARs), i.e., vol-
several angles of exposure to cumulatively target the tumor, hap-                                umes representing whole organs or parts which have to be spared
pens in the LINAC by the multileaf collimator, as shown in Fig-                                  during treatment [Nje08]. The delineation (or segmentation) of tar-
ure 1.                                                                                           gets and OARs often employs more than one imaging source, which
                                                                                                 has proven to be advantageous with regards to specificity and sen-
   Still, RT may result in a number of potential side effects de-                                sitivity [LKCG12]. Data fusion for the integration and combination
pending on the dose, fractionation and location. These can range                                 of various information channels is also part of this process, while
from acute skin irritation [Was15] to secondary cancer decades                                   interactive approaches for the exploration and analysis of the data
later [HW03]. To maximize the effectiveness of tumor treatment,                                  are also employed. All aforementioned images need to be regis-
while minimizing the damage to surrounding tissues, the radiation                                tered [ZF03], to be transformed into the same coordinate system as
dose administration must be carefully planned in dedicated soft-                                 the planning CT.
ware [Was15]. RT planning follows a workflow, which can be out-
lined by a series of steps depicted in Figure 2. The time required                                  After the localization of the tumor and adjacent organs, one (or
for the planning procedure differs for each individual patient and                               more) initial treatment plan(s) is (are) designed, using treatment
is specific to the characteristics of the case and the tumor. An in-                             planning software (TPS). Complex constraints and guidelines are

 c 2019 The Author(s)
Computer Graphics Forum c 2019 The Eurographics Association and John Wiley & Sons Ltd.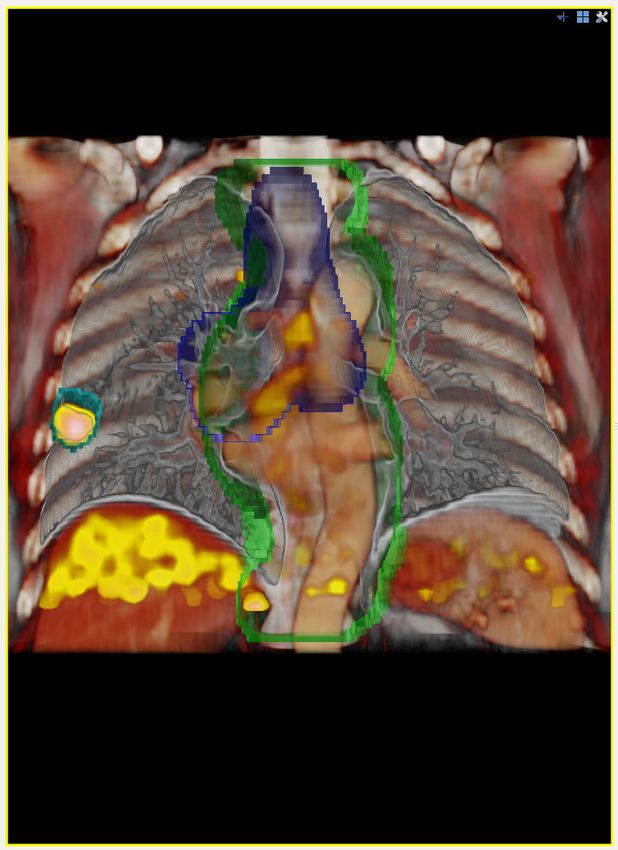
M. Schlachter & R.G. Raidou & L.P. Muren & B. Preim & P.M. Putora & K. Bühler / STAR: Visual Computing in Radiation Therapy Planning

employed to determine the geometric, radiobiological and dosi-               2.2. Data Involved in RT Planning
metric aspects of the treatment—taking into account the OARs,
                                                                             The entire workflow of RT planning is based on the imaging ac-
and optimizing for tumor treatment and for healthy tissue preser-
                                                                             quisitions of the anatomy and pathology of the patient. Yet, each
vation [Was15]. For target volumes, a required minimum dose is
                                                                             step of the workflow incorporates additional information or data
prescribed, whereas OARs should receive doses as low as pos-
                                                                             derived from the imaging acquisitions, as depicted in Figure 2. The
sible [BRC∗ 12, HMP∗ 18]. The tolerance for radiation differs be-
                                                                             final outcome of the workflow is a dose plan, which incorporates
tween organs and depends on their tissue properties. This informa-
                                                                             2D or 3D radiation dose information. During this entire planning
tion is also incorporated to prescribe a level of radiation so that no
                                                                             process several imaging and non-imaging data accumulates around
damage is induced to them.
                                                                             the patient [PPB15].
   The calculated treatment plan(s) will undergo further review and
approval. Dose volume histograms (DVH) [DMB∗ 91] are often
                                                                             2.2.1. Imaging Data
used to summarize the distribution of doses to the target and OARs.
Also, the final prescribed radiation dose will not be administered           In the image acquisition step, the necessary images needed for
all at once. Fractionation [THM∗ 13, Was15] is used in most treat-           radiotherapy planning are acquired from a multitude of sources
ments, where the total dose is spread out in adequate amounts over           [HCE∗ 07]. These can be CT and MRI data, and data derived
time, to allow the recovery of normal cells and to prevent the repair        thereof, depending on the target anatomy. For example, DWI, DCE,
of tumor cells between fractions. The step of radiobiological mod-           MRSI are used for prostate and cervical tumor treatment plan-
eling is conducted for the effectiveness assessment of the selected          ning [BRC∗ 12, BJE∗ 11, CKK∗ 07]. For lung tumors, the use of
RT strategy, involving Tumor Control Probability (TCP) model-                functional imaging, such as (4D) PET/CT, can be advantageous for
ing [WN93] and Normal Tissue Complication Probability (NTCP)                 tumor definition [SKO06]. Brain tumors may additionally require
modeling [MYJ∗ 10]. TCP models are statistical models that quan-             Diffusion Tensor imaging (DTI) [MBC15]. Details on each modal-
tify the probability that a tumor is effectively controlled, i.e. treated,   ity can be found in recent surveys [LSBP18, PBC∗ 16]. During this
given a specific radiation dose, and respectively NTCP models, that          step, the planning CT is acquired, a high quality CT which plays an
normal tissue around the tumor is harmed.                                    important role in the planning. It serves as the reference coordinate
                                                                             system for target definitions, as well as for other images acquired
   Image-Guided Adaptive RT (IGART) requires to further verify
                                                                             using different modalities (registration to the planning CT). Fur-
whether the initial plan is still applicable. Sometimes, changes in
                                                                             thermore, the tissue densities are used for the dose calculation.
the tumor location and shape or anatomical changes of the patient,
e.g. due to weight loss or due to rectal and urinary filling, require
further plan modifications between treatment fractions. At the point         2.2.2. Target Volumes Concept
of treatment delivery, a prior verification step ensures that the pa-        An important concept within RT is the use of Target Volumes, de-
tient is correctly positioned.                                               veloped by the International Commission on Radiation Units &
                                                                             Measurements (ICRU) [Ber07,GLC∗ 04]. Many treatment planning
2.1. Users Involved in RT Planning                                           approaches are specifically targeting one (or more) of these vol-
                                                                             umes, which are explained below. A schematic overview can be
Several clinical experts are involved in the steps of the RT work-           found in Figure 3 and two examples are presented in Figure 4.
flow [AGL∗ 13]. Each specialist has a different role—implying that
VC has also different benefits for them. The most relevant specialist           The volume that contains the visible, macroscopic part of the
groups are:                                                                  tumor (within the limits of the employed imaging technique) is
                                                                             called the Gross Tumor Volume (GTV). The Clinical Target Vol-
1. Radiation oncologists (main responsibles for the prescription,            ume (CTV) contains the GTV and encompasses microscopic ex-
   approval and supervision of the treatment—involved in all steps           tensions into healthy tissues, that are not visible [Ber07, GLC∗ 04].
   of the RT workflow).                                                      The Internal Target Volume (ITV) addresses uncertainties due to or-
2. Medical physicists (scientists who advise on the best treatment           gan motion [JYW99,RSO∗ 96], and is only an intermediate volume
   strategy—involved in Definition of Target Tumor(s) & Organs               that has to be expanded by margins for setup errors [SH02]. The
   at Risk, Treatment Plan Design & Dose Calculation, Dose Plan              ITV concept is not always required, but is common for lung cancer,
   Review & Treatment Evaluation, Image Guided Adaptive RT).                 where breathing motion has to be considered [JHP∗ 15]. The Plan-
3. Radiologists (doctors who specialize in medical imaging ac-               ning Target Volume (PTV) is the volume encompassing the CTV
   quisition and interpretation—involved in Diagnosis & Referral,            (and the ITV if employed), which takes into account the fact that
   Imaging Acquisition, Definition of Target Tumor(s) & Organs at            the CTV and the involved patient anatomy might vary in position,
   Risk).                                                                    shape and size within or between fractions. It accounts specifically
4. Radiotherapists (or therapy radiographers, specialists who op-            for uncertainties, such as patient setup errors [SH02] to ensure that
   erate the treatment machines—involved in Setup Verification &             the CTV will receive the prescribed and planned dose, by adding
   Treatment).                                                               margins to the CTV (or ITV) [Ben08, JYW99, MvM02]. Based on
5. Dosimetrists (main responsible for the careful calculation of the         the PTV, appropriate beam sizes and beam arrangements will be
   dose in the specialized equipment—involved in Treatment Plan              selected to ensure that the prescribed dose is actually delivered to
   Design & Dose Calculation, Dose Plan Review & Treatment                   the CTV [Ber07]. The Treated Volume (TV) is planned to receive at
   Evaluation, Image Guided Adaptive RT).                                    least a dose, appropriate for the purpose of the treatment. It is, thus,

                                                                                                                                                c 2019 The Author(s)
                                                                               Computer Graphics Forum c 2019 The Eurographics Association and John Wiley & Sons Ltd.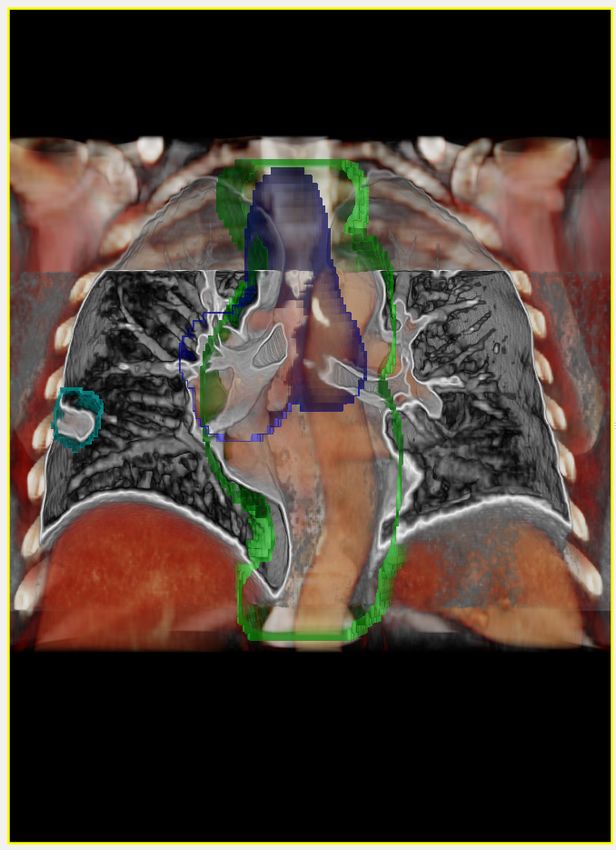
M. Schlachter & R.G. Raidou & L.P. Muren & B. Preim & P.M. Putora & K. Bühler / STAR: Visual Computing in Radiation Therapy Planning

                                                                                         Figure 4: Left: Isodose surface encompassing the ITV. This is a
Figure 3: Volume concepts used in RT planning. The Gross Tu-                             less critical example, due to the location of the tumor (at the lung
mor Volume (GTV), Clinical Target Volume (CTV), Internal Target                          border close to a rib), where the PTV (ITV with setup error margin)
Volume (ITV) and Planning Target Volume (PTV), as well as the                            is not representing the TV well. Right: Example of a difficult case
organs at risk (OAR) are denoted. The Treated Volume (TV) is im-                         (central lung), where the tumor is close to an OAR. The PTV and
plicitly defined (by a dose value) after dose calculation. The PTV                       PRV were overlapping in this case. Images adapted from [SFA∗ 17].
and ITV account for patient setup errors and other sources of inac-
curacy, during the administration of the radiation dose. Planning
Organs at Risk Volume (PRV) and Internal Target Volume (ITV)
are not always defined. A possible configuration of a target close to                    et al. [GS05], as a composition of different concepts, such as er-
an OAR is shown on the right. Overlapping volumes can have an                            ror (outlier or deviation from a true value), imprecision (resolution
impact on the dose calculation, and might lead to insufficient PTV                       of a value compared to the needed resolution), subjectivity (degree
coverage or undesired dose levels for the OAR.                                           of subjective influence in the data) and non-specificity (lack of dis-
                                                                                         tinction for objects). In RT planning, we define uncertainty as any
                                                                                         source which may cause variations in any step of the workflow and
                                                                                         ultimately in the treatment outcome. Uncertainty is an additional
a volume enclosed by an isodose surface corresponding to that pre-                       data source, present at all steps of the planning workflow. The quan-
scribed dose level [Ber07]. For example, if the prescribed dose is 40                    tification and communication of uncertainty is essential for the ac-
Gy, and the minimum dose was 5% below, the TV is then enclosed                           curate interpretation of the outcome, for reducing the existing un-
by a 38 Gy isodose surface.                                                              certainties and risks, and potentially, for improving the outcome.
   Organs at risk (OAR) are normal tissues whose radiation sensi-                           With regard to imaging modalities, both DWI and DCE imag-
tivity may significantly limit the treatment. These can be the spinal                    ing have highly varying sensitivity and specificity for tumor de-
cord in lung tumor treatment or pelvic organs in prostate tumor                          tection [KKP∗ 08, KVCC08, TAKC09], depending on patient char-
treatment. In analogy to the PTV, safety margins can be added                            acteristics, on the tissue zone and on the scanning procedure it-
around the OAR volumes [MvM02], leading to the concept of the                            self. Poor spatial imaging resolution and image distortions, due
Planning Organ at Risk Volume (PRV).                                                     to magnetic field inhomogeneities at the interfaces between dif-
   In clinical reality, Target Volumes and OARs can overlap or even                      ferent tissues are additional issues in DWI [BJE∗ 11, CKK∗ 07,
include each other. A patient with a brain tumor, for example, has                       SFA∗ 05]. In addition to this, pharmacokinetic modeling, which
the target inside the brain, which is an OAR itself. The same applies                    is employed in clinical research for the derivation of additional
to a lung cancer patient, where the lung itself is an OAR. Some                          tissue characteristics from DCE data, is also a source of uncer-
overlaps are more critical than others, such as the brainstem and                        tainty [BRP∗ 04, TAKC09, TBB∗ 99, VTM∗ 12]. Often, to minimize
PTV for brain cases, or trachea and ITV for lung cases. In Figure 4                      uncertainty different imaging modalities are combined [BJE∗ 11,
the left image is on the lung border and the right image is cen-                         BRC∗ 12, CKK∗ 07, HCE∗ 07]. In the delineation of the target vol-
tral and is more critical. Furthermore, determining the margins is                       umes and OARs, uncertainties due to patient motion, or due to
not straightforward and depends on a multitude of factors [vH04].                        changes in the anatomy and pathology of the patient are consid-
Overlaps of target volumes and OARs present a challenge as the                           ered within the aforementioned target volume definitions (Sec-
shape of prescribed dose might not be achieved, and on the other                         tion 2.2.2). In the other steps, uncertainty can be caused by an
side the OARs might receive too high doses in the overlapping re-                        ad-hoc choice, assumptions, stochastic processes or inter-observer
gions as schematically depicted in Figure 3 (right). Including in-                       variability, as discussed in a recent work by Raidou et al. [Rai18].
formation about overlaps during treatment plan evaluation has the                        A more detailed review on uncertainty visualization can be found
potential to improve the overall quality [WRS∗ 09].                                      in the survey by Ristovski et al. [RPHL14].

2.2.3. Uncertainty in RT Planning                                                        2.2.4. Dose Plans and Dose Volume Histograms
RT planning is—among all therapy planning processes—the one                              Dose plans convey 2D or 3D radiation dose information (dose dis-
where uncertainty, validation, and verification are considered es-                       tribution), as generated from treatment planning systems based on
sential by the involved physicians. In literature, there is no widely                    a 3D reconstruction of a planning CT scan. Dose distributions are
accepted definition of uncertainty. A definition is given by Griethe                     scalar data maps, where the values indicate in Gy the radiation dose

 c 2019 The Author(s)
Computer Graphics Forum c 2019 The Eurographics Association and John Wiley & Sons Ltd.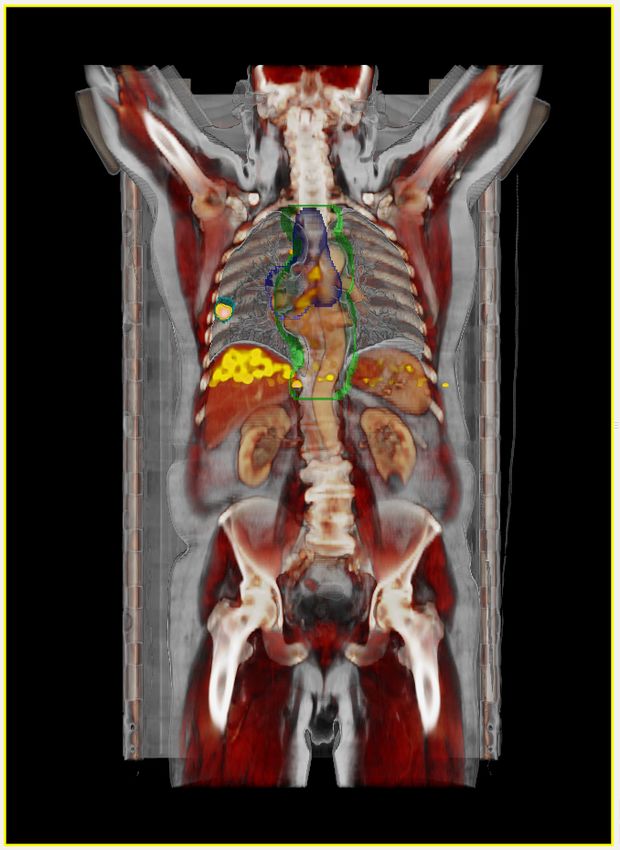
M. Schlachter & R.G. Raidou & L.P. Muren & B. Preim & P.M. Putora & K. Bühler / STAR: Visual Computing in Radiation Therapy Planning
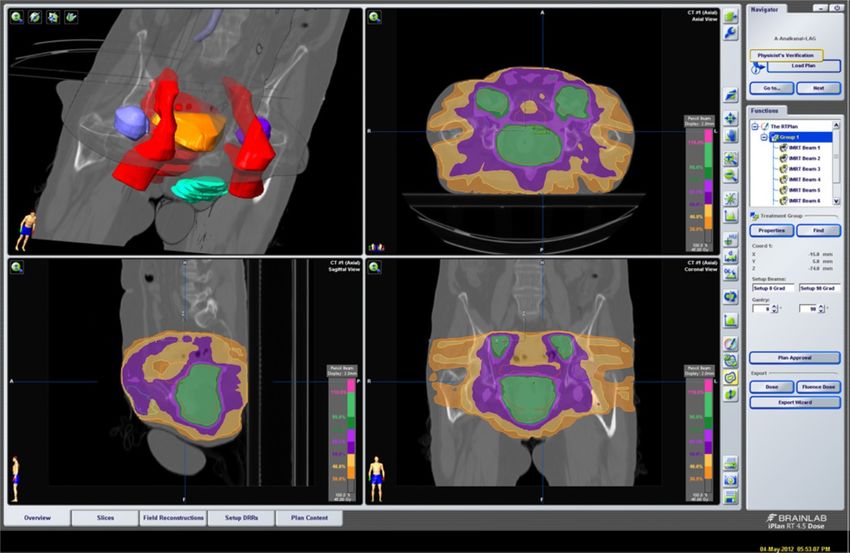
Figure 5: The axial, sagittal and coronal slices together with a 3D
overview to evaluate the simulated dose distribution used to treat Figure 6: The dose-volume histogram indicates which percentage
prostate cancer. The 3D overview (upper left) shows the previously of a structure volume receives a certain dose (x-axis) to treat an
segmented anatomical structures along with the three orthogonal esophageal carcinoma. The orange curve relates to the tumor vol-
slices. The slice views employ isolines and colored regions to dis- ume which indicates that 95% of its volume receive at least 95%
play the dose distribution as percentage of the target radiation in of the target dose, as shown with the 7-mark (Courtesy of Mathias
the tumor (Courtesy of Mathias Walke, Department of Radiation Walke, Department of Radiation Treatment Planning, University of
Treatment Planning, University of Magdeburg, taken from the book Magdeburg, taken from the book of Preim and Botha [PB13]).
of Preim and Botha [PB13]).
directly apply the search term, for instance in Pubmed and IEEE
at each location of the patient—in reference to the space of the plan- Xplore. If this was not possible, multiple searches with potentially
ning CT. An example of a dose plan is shown in Figure 5. Often, broader results were conducted. For instance, the Eurographics
dose plans are regarded together with the so-called dose volume Digital Library search is very limited and three separate searches
histograms (DVH) [DMB∗ 91]. A DVH, as shown in Figure 6, sum- with the terms “radiotherapy”, “radiation therapy”
marizes the 3D dose in a 2D plot, relating radiation dose (horizontal and “radiation treatment” were performed.
axis) to tissue volume (vertical axis). This can be a tumor target or The query results were merged and duplicates were removed,
a healthy organ, and the plot can have a differential or cumulative e.g., Medline and IEEE Xplore both give results from TVCG. All
form. A DVH often includes all targets and OARs involved in the results were considered potentially related, and were further re-
radiotherapy plan, where each structure is represented by a color- duced by removing unrelated or out of scope entries on a one-
encoded line. to-one basis. The initial search yielded 601 candidates: Medline
(464), IEEE (71 additional to Medline), Eurographics Digital Li-
3. Taxonomy and Presentation of Previous Work in VC for RT brary (33), CGF (19), Visual Computer (9) and ACM (5), which
were reduced to 105 papers employed for building the taxonomy.
In this section, previous joint research of VC and RT is discussed. Results were considered as unrelated or out of scope, if they were
First, we provide information about the selection of papers. To nav- only matching the search term due to titles in the reference list or
igate the user through the existing literature, a taxonomy for the author biographies and if they were not within the joint VC and
classification of the papers and the reasoning behind the selection RT scope. Additionally, the papers were required to have a strong
of this taxonomy scheme is presented. Previous related work is, connection to visualization or visual analytics or visual computing
finally, discussed within the provided categorization. within RT research. An example for a discarded paper would be a
clinical study for an RT related topic where the tumor is “visu-
3.1. Literature Search and Sources alized” for demonstration purposes, or a pure imaging technique
article using “visualization” in an imaging sense.
We conducted an extensive search of literature databases. Titles
and keywords used in the literature related to visual computing,
radiotherapy and its planning. This led to the formulation of the 3.2. Taxonomy Description
following general search term: (“visualization” OR “vi-
As discussed in Section 2, RT has several particular characteristics
sualisation” OR “visual computing” OR “visual
with regard to the multitude of involved data, complex and risky
analytics”) AND (“radiotherapy” OR “RT” OR “ra-
processes and users. This requires the incorporation of many dif-
diation therapy” OR “radiation treatment”) AND
ferent strategies from the domain of VC. For example, registration
(“planning” OR “plan”).
or multi-modal visualization might be relevant for different steps
For the literature search, the sources reported in Table 1 were of the workflow, but each step has specific clinical requirements
considered. When possible, logical search operators were used to and targets. Although previous work in the general domain of VC
c 2019 The Author(s)
Computer Graphics Forum c 2019 The Eurographics Association and John Wiley & Sons Ltd.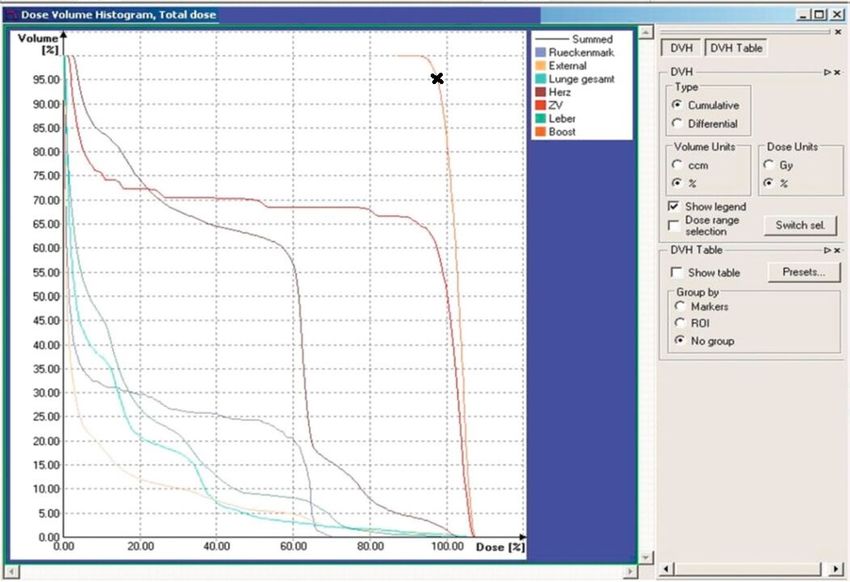
M. Schlachter & R.G. Raidou & L.P. Muren & B. Preim & P.M. Putora & K. Bühler / STAR: Visual Computing in Radiation Therapy Planning

   Table 1: Table representing the literature search and sources.                           This dimension implies also a categorization based on the users
                                                                                            of the methods, as discussed in Section 2.1. It comprises the
   Source                                  Index Multiple                                   following categories:
   Pubmed/Medline                          Various including:
                                           – IEEE TVCG (since 2004)                         • Integrable:
                                           – IEEE TMI (since 1997)                             – Benefits for the practice have been proven.
                                           – IEEE CGA (since 2004)                             – Tackling issues of current clinical practice.
                                           – Journal of CARS (since 2009)                      – Routine implementation is possible today.
                                           – CGF (PMC only)
   IEEE Xplore                             all IEEE                                         • Developmental:
   EG Digital Library                      all EG                                              – Benefits for the practice have not been proven yet.
   ACM Digital Library                     all ACM                                             – Tackling less common issues of clinical practice.
   Computer Graphics Forum                 -                                                   – Routine implementation might be possible in the future.
   The Visual Computer                     -
                                                                                            This category does not imply a “hard” categorization, and some
   Computer Methods in Bio-                -                                                papers are categorized as Integrable/Developmental expressing
   mechanics and Biomedical                                                                 an affinity to Integrable, and vice versa. The categorization was
   Engineering                                                                              made at the (time) point of writing this survey. Thus, it may
                                                                                            change in the upcoming years especially for the Developmental
                                                                                            category, depending on whether approaches become accepted
might also be applicable for RT and is referenced in the upcoming                           and widely used. Please note that this is based on the search
sections whenever relevant, it is more appropriate and clinically                           results as well as the experiences and personal opinions of the
significant to address each of the steps of the workflow separately.                        authors. As it is not possible to discuss the adoption dimension
To this end, we do not focus on a method-based categorization, but                          separately for all the papers included below, we provide a sum-
on a taxonomy which reflects the steps of the clinical workflow. As                         marization at the end of each major step-related subcategory,
the entire radiotherapy treatment process is based on this workflow,                        where we also comment on adoption. A detailed view on the
this division into the clinical steps is anticipated to be more natural                     adoption dimension is provided in Figures 7 and 8.
for readers both from the VC and the RT domain. It is also more
probable that readers of this article are more concerned with one                           For the categorization of the existing literature based on the two
specific part of the entire pipeline. Another important aspect is the                    aforementioned dimensions, the authors of this survey read all pa-
adoption rates of the discussed approaches, in an attempt to iden-                       pers and decided on a one-to-one basis. This categorization has also
tify significant trends and gaps within the current literature. Know-                    been summarized in Figures 7 and 8. A particular aspect that was
ing whether previous work has been (partially) integrated in clini-                      taken into account was whether an evaluation (and what kind of
cal routine is anticipated to give insights into unsolved issues, into                   evaluation) of the presented methods had been conducted. This is
challenging future pathways and into topics that upcoming joint                          documented separately in Section 3.7 and summarized in Table 2.
VC/RT research could tackle. The taxonomy is built upon two di-                          The areas of main concentration of the literature are also identified
mensions:                                                                                and discussed in Section 3.8.

1. Steps of the RT workflow addressed by the proposed methods—
                                                                                         3.3. Target and OAR Definition
   This dimension implies also a clinically-relevant categorization
   based on the available data, upon which the methods were built,                       After all images are acquired, the tumor with its respective volume
   as discussed in Section 2.2. It comprises the following cate-                         definitions and the adjacent OARs are delineated. Multiple sub-
   gories:                                                                               tasks are involved in this step, ranging from data exploration and
                                                                                         analysis, data registration, data fusion to data segmentation (auto-
    • Target and OAR Definition (Section 3.3)
                                                                                         matic or manual). These are crucial steps in the workflow, as the
        –    Data Registration (Section 3.3.1)                                           subsequent treatment design and dose calculation will be directly
        –    Data Fusion (Section 3.3.2)                                                 influenced by any inaccuracies.
        –    Data Segmentation (Section 3.3.3)
        –    Multi-Parametric Data Exploration and Analysis (Sec-                        3.3.1. Data Registration
             tion 3.3.4)
                                                                                         Previous work related to data registration revolves around two ma-
    • Treatment Plan Design and Dose Calculation (Section 3.4)                           jor topics: motion and accuracy assessment, and interactive ap-
    • Dose Plan Review and Treatment Evaluation (Section 3.5)                            proaches for registration.
        – Spatial Evaluation (Section 3.5.1)                                             Approaches Related to Motion and Accuracy Assessment—As
        – Non-Spatial Evaluation (Section 3.5.2)                                         discussed previously, tumor motion represents a challenge in plan-
                                                                                         ning and delivery of radiotherapy [KMB∗ 06]. In lung tumor treat-
    • Planning Strategies for Image Guided Adaptive RT (Sec-
                                                                                         ment, 4D data for treatment planning in the presence of respiratory
      tion 3.6)
                                                                                         motion have been employed to several case studies. Deformable
2. Adoption of the proposed methods within clinical practice—                            image registration (DIR) is an important component [RCCW05].

 c 2019 The Author(s)
Computer Graphics Forum c 2019 The Eurographics Association and John Wiley & Sons Ltd.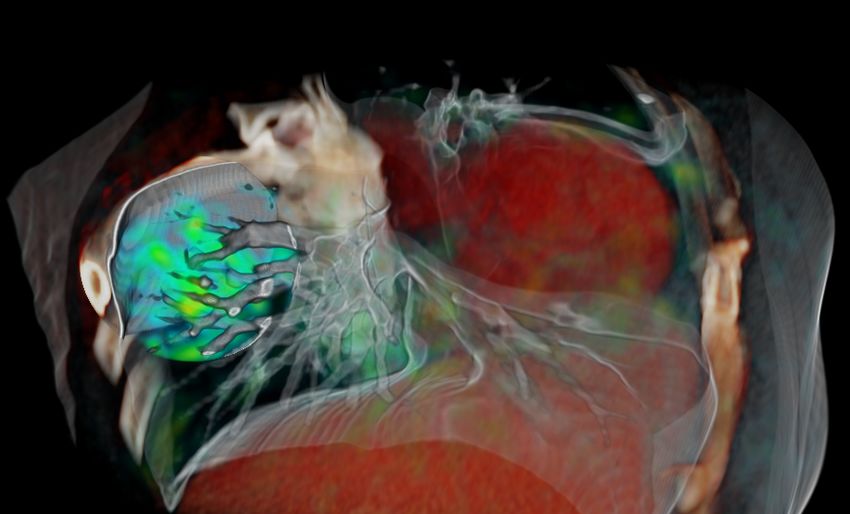
M. Schlachter & R.G. Raidou & L.P. Muren & B. Preim & P.M. Putora & K. Bühler / STAR: Visual Computing in Radiation Therapy Planning

Figure 7: Treemap representation of the first dimension of the taxonomy, related to the Steps of the RT workflow addressed in VC literature
and the Adoption dimension of the taxonomy. Each reference is marked with 1 (first row, green) to indicate Integrable approaches, and with
2
  (second row, yellow) Developmental approaches. We denote by 3 (third row, cyan) Developmental/ Integrable and by 4 (fourth row, orange)
Integrable/ Developmental approaches.

The amount of data generated with 4D imaging significantly in-              for the visualization of motion in 4D-CT lung data, which com-
creases the time needed for image review and target volume delin-           prises simple color intensity projections. Although very simplistic,
eation, and DIR can be used for contour propagation [OJB∗ 07] to            this kind of images are common for the representation of motion or
reduce the workload of manual delineations.                                 deformation during registration and fusion.

   Motion-encompassing methods use DIR to derive a single scan                 Registration is accompanied by uncertainty, primarily related
out of a 4D-CT scan for target delineation, which represents the            to the inherent characteristics of the different imaging modal-
tumor in its time-averaged mid-position [WSVHD08]. Further-                 ities that are co-registered. In addition to this, different regis-
more DIR can be used to model breathing motion. Ehrhardt et                 tration algorithms may bring different types of uncertainty, re-
al. [EWR∗ 08] use DIR for the generation of a mean motion model             lated to localization accuracy or robustness [KBP∗ 07]. This might
of the lung, to predict the breathing motion of a patient without the       be an important aspect to consider, for instance when used for
knowledge of 4D information by matching the model. The motion               dose warping [VLM∗ 15]. The literature on registration methods is
is visualized by color encoding the displacement field magnitudes.          vast [FVW∗ 11,KBD16,MV98,SDP13,VMK∗ 16,ZF03] and differ-
Cover et al. [CLS06] demonstrate the standard approach employed             ent algorithms can be employed, each with different strengths and

                                                                                                                                               c 2019 The Author(s)
                                                                              Computer Graphics Forum c 2019 The Eurographics Association and John Wiley & Sons Ltd.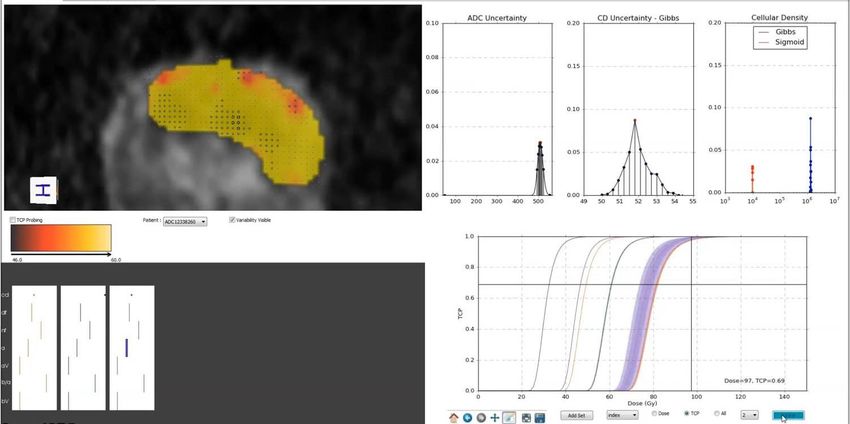
M. Schlachter & R.G. Raidou & L.P. Muren & B. Preim & P.M. Putora & K. Bühler / STAR: Visual Computing in Radiation Therapy Planning

                               Categorization based on the Steps of the RT Workflow
                                                                               18                                                           #papers

                                            12
                                                                       9
                                                               8                          8
                                                                                                                                    7
                           6                                                                                                6
                                                     5                                                    5         5
         4                                                                                        4
                                                                                                                                                    3

                                                                                                                                                                                            Categorization based on Adoption
                   2                                                                                                                        2
                                   1

        (a) (b) (c) (d) (e) (f) (g) (h)                                        (i)       (j)      (k) (m) (n) (o) (p) (q)                           (r)

                                                                                                                                                              Int            27
             2         2       0       0         5       0         0       1        9         1       1       1         0       1       3       0         1

                                                                                                                                                              Dev                      51
             0         0       3       1         4       5         7       8        4         0       1       2         4       5       4       2         1

                                                                                                                                                              D/I   9
             0         0       1       0         3       0         0       0        2         0       1       2         0       0       0       0         0

                                                                                                                                                              I/D       18
                                                                                                                                                                                  #papers
             2         0       2       0         0       0         1       0        3         7       1       0         1       0       0       0         1

                 (1)       (2)             (3)               (4)                        (5)                       (6)
                                   (I)                                 (II)                       (III)                                     (IV)

Figure 8: Heatmap and histogram representations to depict the distribution of previous literature within the two dimensions of the taxon-
omy. Horizontal axis: Categorization according to the addressed Steps of the RT workflow. Vertical axis: Categorization according to the
Adoption of the methods within clinical practice. We also show the hierarchy within the taxonomy. The grayscale color encoding denotes the
increasing number of papers, going from white (0) to black (max). Annotations: (a) Motion and Accuracy Assessment, (b) Interactive Reg-
istration, (c) Data Fusion, (d) Manual Segmentation, (e) (Semi-) Automatic Segmentation, (f) Exploration and Analysis of Imaging-Derived
Features, (g) Tissue Characterization, (h) Treatment Plan Design and Dose Calculation, (i) 2D/3D, (j) VR/AR/Holographic, (k) Simulation of
Delivery, (m) DVH Analysis, (n) Anatomical and Feature Analysis, (o) TCP/NTCP Analysis, (p) Inter-Fraction, (q) Intra-Fraction, (r) Non-
Image Guided for Intra-Fraction Monitoring. (1) Data Registration, (2) Data Fusion, (3) Data Segmentation, (4) Multi-Parametric Data
Exploration and Analysis, (5) Spatial Evaluation, (6) Non-Spatial Evaluation. (I) Target and OAR Definition, (II) Treatment Plan Design and
Dose Calculation, (III) Dose Plan Review and Treatment Evaluation, (IV) Image Guided Adaptive RT.

implications. In particular, the use of non-rigid registration requires                                            color visual representations are used for each image modality, such
the selection of parameters, which can yield results with large vari-                                              as red, green, or blue. The color distribution on the voxel volume
ability [ESS12, RPSWI10]. In other cases, the lack of objective                                                    or a sub-volume can be used as registration criterion, where the ho-
ground truth in the validation of registration creates the need for                                                mogeneity of the color distribution is used as an indicator for an
manual registrations by experts, which introduces uncertainty that                                                 optimal match. Interactive DIR using landmarks to steer the algo-
is related to inter-observer variability.                                                                          rithm has been presented by Cheung et al. [CK09]. Landmarks can
                                                                                                                   be added, removed, and adjusted between repeated registrations.
   The accuracy of the registration method needs to be analyzed                                                    In their approach, landmark pairs were based on visual correspon-
and validated. Visual assessment is one way to verify that the ac-                                                 dences, identified by the user on the images to be registered. The vi-
curacy is sufficient enough for the use in planning. In the study of                                               sualization methods used for showing the quality include checker-
Hamdan et al. [HBR∗ 17] checkerboard visualizations are used to                                                    board display of the fixed and moving images, 3D visualization of
verify the alignment of the registration of MRI and CT images for                                                  the deformation field using glyphs overlaid on a slice of the target
prostate images together with contours. Visualization of DIR qual-                                                 image, and a warped grid to show the transformation warping.
ity using local image dissimilarity has been proposed by Schlachter
et al. [SFJ∗ 16], where the verification is based on voxel-wise cal-                                               3.3.2. Data Fusion
culated dissimilarity value to indicate the match or mismatch. Fur-
thermore, it includes different interaction and visualization features                                             Single modality may not provide enough information with re-
for exploration of candidate regions to simplify the process of vi-                                                spect to tumor tissues, as well as the tissues that surround tar-
sual assessment. This approach is presented in Figure 9.                                                           get organs. Combining different modality images can be a nec-
                                                                                                                   essary tool in cancer treatment [LSBP18, PBC∗ 16]. The specifics
Interactive Registration Approaches—Interactive rigid image                                                        of the integration and combination of various channels of data in-
registration of multiple imaging modalities using a volume-view-                                                   formation is done through multi-modality image fusion. Lawonn
guided system has been developed by Li et al. [LXN∗ 05]. To dis-                                                   et al. [LSBP18] recently authored a survey on the visualization of
tinguish each individual volume in the registration process, mono-                                                 multi-modal medical data. Furthermore, an overview on volume vi-

 c 2019 The Author(s)
Computer Graphics Forum c 2019 The Eurographics Association and John Wiley & Sons Ltd.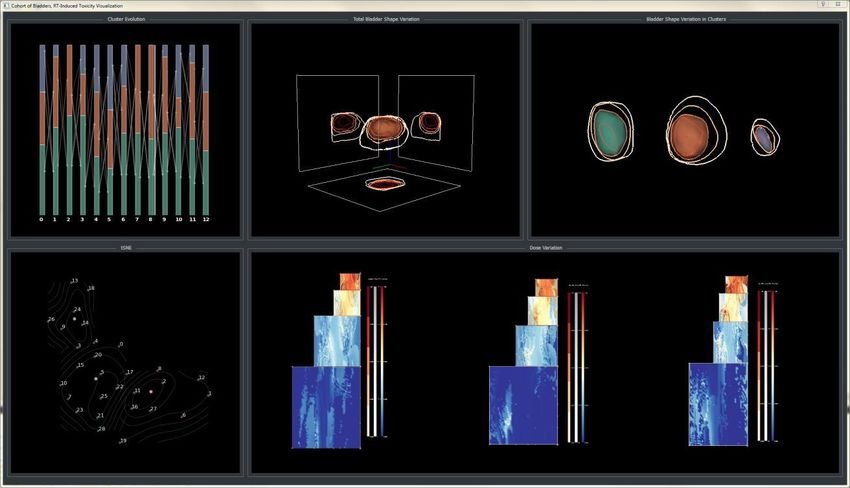
M. Schlachter & R.G. Raidou & L.P. Muren & B. Preim & P.M. Putora & K. Bühler / STAR: Visual Computing in Radiation Therapy Planning

                                                                            formation in the planning process with basic viewing of MRSI data
                                                                            as fixed contours embedded within MRI and CT data. The fusion
                                                                            of multiple MR images (T1, T2 and MRSI) is proposed by Marino
                                                                            et al. [MK11] using a score volume which takes into account each
                                                                            of the three acquisition types. The MRSI score is based on detect-
                                                                            ing areas of increased chemical ratios indicating the possibility of
                                                                            cancer.

                                                                            3.3.3. Data Segmentation
                                                                            For the definition of the tumor target and the surrounding or-
                                                                            gans at risk, conventional approaches involve manual segmenta-
                                                                            tion through expert delineation and (semi-)automatic segmenta-
                                                                            tion methods. An overview on medical image segmentation can be
                                                                            found in Pham et al. [PXP00] or the book of Birkfellner [Bir14],
                                                                            and—with a focus on interaction—by Olabarriaga and Smeulders
Figure 9: Assessment of deformable image registration quality,
                                                                            [OS01]. A review on deep learning in medical imaging segmenta-
measured by local image dissimilarity, and visualized together with
                                                                            tion, focusing on MRI data was recently given by Lundervold and
the original images. Different interaction and rendering modes al-
                                                                            Lundervold [LL18].
low for a detailed inspection in areas, where dissimilarity indicates
errors due to the underlying registration algorithm [SFJ∗ 16].              Approaches Related to Manual Segmentation—Manual delin-
                                                                            eations, although conducted by expert radiologists, might result in
                                                                            errors due to inter-observer variability [PM06]. This well-known
                                                                            problem affects the entire RT workflow [GEH∗ 02].
sualization with a focus on medical applications can be found by
                                                                            Approaches Related to (Semi-)Automatic Segmentation—
Zhang et al. [ZEP10]. Therefore, we focus on data fusion restricted
                                                                            Automated segmentation algorithms can greatly reduce the delin-
to radiation treatment planning. Image fusion, i.e., the combination
                                                                            eation time and the efforts of a human expert. For example, auto-
of various images into a single image, is required for an integrated
                                                                            matic segmentation based on statistical shape modeling has been
interpretation of the complementary information in the underlying
                                                                            proposed by Seim et al. [SKH∗ 08] for the segmentation of pelvic
imaged structures. For example, PET/CT or PET/MRI data can be
                                                                            bones, or by Vik et al. [VBS∗ 12] for the segmentation of pelvic
fused to combine functional and anatomical information [LSBP18].
                                                                            organs. However, when automatic segmentation is employed, the
Often, the different modalities are overlaid and presented with a
                                                                            resulting segmentation needs to be verified, before used for dose
color-encoded scheme. An overview on medical image fusion in
                                                                            calculation. Three main sub-topics can be regarded within this cate-
general is given by James and Dasarathy [JD14].
                                                                            gory: approaches aiding the segmentation of relevant structures, ap-
   An approach that goes beyond the mere color-encoded, overlaid            proaches enhancing the segmentation outcome by post-processing
representation of fusion is proposed by Kim et al. [KCEF07]. The            and approaches assessing the outcome of the segmentation. All
authors propose an entire workflow for interactive multi-volume vi-         three subcategories incorporate user interaction with the segmen-
sualization and the fusion of PET/CT images of lung and brain. The          tations, which has been discussed by Ramkumar et al. [RDK∗ 16].
images are initially segmented using a fuzzy c-means cluster anal-
                                                                               Within the aiding category, de Geus et al. [dW96] propose an ap-
ysis. Subsequently, the resulting segmentation map, together with
                                                                            proach for the detection, modeling and visual stylization of struc-
the initial PET and CT data are rendered, fused and interchanged. In
                                                                            tures of interest from CT images. Stylization, within the work of de
the work of Chavan et al. [CT14], an approach for multi-modality
                                                                            Geus, is defined as a combination of segmentation and 3D visual-
image fusion is employed with the purpose of providing better
                                                                            ization, where the resulting segmentation of the critical structures
visualization (i.e., representation), accurate diagnosis and appro-
                                                                            conforms to the bounding volume of the real shape. Moreover, as-
priate treatment planning. In this work, different fusion rules are
                                                                            sisted contouring can be employed to reduce some of the manual
employed and evaluated against each other in order to determine
                                                                            workload, or adjust the result of automatic segmentations. Zindy et
which are the ones that carries less uncertainty, i.e., noise or vi-
                                                                            al. [ZMBL00] propose assisted contouring based on scattered data
sual artifacts, with a focus on uncertainty minimization. Illustrative
                                                                            interpolation methods. Instead of warping individual contours, a
rendering which combines anatomical information from CT scans
                                                                            surface is interpolated through any data point that has already been
with functional information from PET are found in the work of
                                                                            placed on contour boundaries. This surface can be iteratively re-
Merten et al. [MGLS∗ 16]. Illustrative rendering techniques, com-
                                                                            fined by adding points on the CT slices. Additionally, sketch-based
bining order-independent transparencies with boundary enhance-
                                                                            editing tools for segmentation have been proposed by Heckel et
ments and silhouettes are proved to provide an excellent spatial
                                                                            al. [HMTH13], considering image information for extrapolation,
perception and evaluation of tumor position, metabolic and ther-
                                                                            as well as previous and contradictory inputs. Other, more com-
apeutic agent activity.
                                                                            plex approaches, involve the work of Akino et al. [AOM∗ 14] for
   Additional information has been incorporated with the inclu-             the automatic estimation of tumor motion using segmentation of
sion of MRSI data in the fusion process [NLK∗ 14]. Graves et                cine-MRI, with the detection of feature points. Motion vectors are
al. [GPN∗ 01] present an initial attempt to include 3D MRSI in-             calculated and applied to contours, while a potential ITV is calcu-

                                                                                                                                               c 2019 The Author(s)
                                                                              Computer Graphics Forum c 2019 The Eurographics Association and John Wiley & Sons Ltd.
M. Schlachter & R.G. Raidou & L.P. Muren & B. Preim & P.M. Putora & K. Bühler / STAR: Visual Computing in Radiation Therapy Planning
lated from the accumulation of GTVs. This involves the incorpora- an application that combines advanced interaction, segmentation
tion of motion information from cine-MRI and 4DCT data. Raidou and visualization techniques to explore breast Dynamic Contrast
et al. [RKS∗ 16] employ a visual analytics approach to improve Enhanced (DCE)-MRI data, using well-established interaction and
classifier design for brain lesion detection using features derived rendering techniques. The second work tackles myocardial data,
from diffusion imaging. This semi-automatic approach integrates and, thus, also motion correction. A comprehensive workflow of
the knowledge and skills of specialist users with automatic meth- registration, segmentation and visualization for the exploration of
ods for smart feature selection and for the evaluation of the classi- enhancement curves and parameter distributions in automatically
fication outcome. segmented or user-selected areas is discussed.
Within the enhancement category, smoothing algorithms can be Oeltze et al. [ODH∗ 07] propose a visual analysis tool that en-
considered. Smoothing algorithms allow to reduce artifacts from ables the exploration of the correlations and relations between sev-
mesh generation, but often degrade accuracy. Relevant features eral features and parameters of perfusion data. From contrast-agent
may be removed and distances between adjacent structures get enhancement time-intensity curves (TICs), they derive per-voxel
changed. Li et al. [LHL∗ 10] present fast 3D-reconstruction and vi- parameters that can be used as indicators in the diagnosis of breast
sualization of tumor target and organs at risk from a series of cross- tumors. They employ Principle Component Analysis (PCA) to re-
sectioned contour points. In this approach, after the pre-processing duce the dimensionality of their parameter space, and they use mul-
of the contour points dataset, an iso-surface is extracted and simpli- tiple linked views to enable exploration and analysis. This work
fied. Then, the surface model undergoes a linear transformation and facilitates the localization of specific characteristics of the param-
smoothing. The proposed approach, despite being simple, is accu- eter space in the anatomic and temporal domain. It also enables
rate and fast and the visualization part consists of simple iso-surface a multi-variate analysis of the parameter space and facilitates the
renderings of the involved organ structures. Moench et al. [MAP10] local exploration of the data. A survey of perfusion data analysis
present a modification to common mesh smoothing algorithms to approaches has been published by Preim et al. [POM∗ 09]. This
preserve non-artifact features by focusing on previously identified survey includes applications on breast tumor analysis, and also on
staircase artifacts. To further improve the handling of mesh smooth- the analysis of myocardial, and ischemic data.
ing filters, Moench et al. [MLK∗ 13] introduce model quality graphs
and model quality bars which are evaluated in real-time and pre- An additional layer of complexity to the exploration and analysis
sented to the user to perform parameter adjustments and to provide of perfusion data has been added by Nguyen et al. [NBYR12] and
immediate visual feedback on accuracy and smoothness. Raidou et al. [RvdHvH∗ 14]. For the exploration, analysis and min-
imization of uncertainty, in the form of intra- and inter-modeling-
Within the assessment category, Raidou et al. [RMB∗ 16] pro- induced variability, Nguyen et al. propose an approach that works
pose a visual tool to facilitate the exploration and analysis of the with kinetic PET modeling parameters. To show additional rela-
outcomes and errors of automatic segmentation methods, support- tions between DCE-MRI kinetic modeling-derived parameters and
ing cohort and individual patient investigation for the detailed as- the effect of variability on these, Raidou et al. propose iCoCooN.
sessment of their pelvic organ segmentations. This work has been It is a Visual Analytics tool based on the design of a visual repre-
extended later on by Reiter et al. [RBGR18], in a web-based vi- sentation that integrates perpendicularly Parallel Coordinate Plots
sual analytics approach to facilitate understanding how the shape (PCPs) with Cobweb Charts (CCs or star plots). PCPs display the
and size of pelvic organs affect the accuracy of automatic segmen- variations in all parameters among modeling choices, while CCs
tation methods and to enable quick identification of segmentation present the relations in a whole parameter set for each modeling
errors and their correlation to anatomical features. Schlachter et choice. The tool is equipped with interactive features to support
al. [SFA∗ 17] develop a visualization framework for rapid quality the exploration of all data aspects in a single combined view. Ad-
assessment of segmentation targeting temporal data. The frame- ditionally, interactive brushing facilitates to link the observations
work allows for fusion of 4D multi-modal data sets and joint vi- bi-directionally to the anatomy.
sualization of segmentation data. The focus of the approach was to
allow exploration of the full 4D imaging information, and to of- Tissue Characterization—Beyond the exploration and analysis of
fer interaction and navigation features for a simplification of this the data, there is a significant amount of work on linking the ana-
process. This approach is presented in Figure 10. lyzed data to tissue characteristics and other information, such as
Gleason or PI-RADS scores [Was15]. For many years, tumors have
3.3.4. Multi-Parametric Data Exploration and Analysis been considered homogeneous masses. In reality, tumors are het-
erogeneous tissues, enclosing multiple regions with distinct charac-
Often, the acquired multi-parametric, multi-modal medical imag-
teristics, e.g., necrotic portions without perfusion and highly vascu-
ing data need to be explored and analyzed, in order to derive addi-
larized regions. Incorporating patient-specific intra-tumor tissue in-
tional (biological) information. Two major trends were observed in
formation into radiotherapy planning is potentially important in tu-
the previous work of this topic. The first relates to the exploration
mor diagnosis and in designing more effective treatment strategies,
and analysis of imaging-derived features and the second to tissue
where distinct intra-tumor tissues are irradiated with adequately se-
characterization or classification.
lected radiation doses [GBM∗ 12,GMK∗ 10]. Investigation of tumor
Exploration and Analysis of Imaging-Derived Features—Two heterogeneity at micro-scale supports the general understanding of
early works, with a particular focus on the segmentation and vi- the distribution and type of tumor cells in tissue, and is today done
sualization of MRI perfusion data, have been proposed by Coto using data acquired from invasive procedures, including biopsies
et al. [CGB∗ 05] and Hennemuth [HBK∗ 07]. Coto et al. propose and post-operative inspection of histopathological slices. These are
c 2019 The Author(s)
Computer Graphics Forum c 2019 The Eurographics Association and John Wiley & Sons Ltd.You can also read


