CHANGE MATERIAL INSIGHTS REPORT - Textile Exchange
←
→
Page content transcription
If your browser does not render page correctly, please read the page content below
MATERIAL
CHANGE
INSIGHTS REPORT
      2020

 The state of fiber and
  materials sourcing
Foreword

                                             2020 and COVID-19 will certainly go down in history as a tragedy – and an
                                             awakening on many levels. Working with my team and the industry on this
                                             program fills me with a sense of contribution and urgency. Our job at Textile
                                             Exchange is to make sure the textile and apparel industry is a force for good
                                             over this next decisive decade – and provide the tools it needs. As ever, it's
                                             only through collaboration and gritty determination that we will get to the
                                             place we need to be.

                                             I want to thank and congratulate all participants. The results are truly inspiring
                                             – they not only give us a calculated insight into progress being made, they
                                             also give us hope and inspiration!

                                             All 191 companies that stepped up to join the Material Change Index in 2020
                                             are indeed Companies Creating Material Change.

                                                               Liesl Truscott
                                                               Director of European & Materials Strategy
                                                               Textile Exchange

2   Textile Exchange © 2020   Contents                                                                        Material Change Insights Report•• 3
Contents                                                                                                          Navigating the Report

    State of the Sector█                                                                                        █6   State of the Sector
     Executive Summary█                                                                                         █6   The report opens with the "State of the Sector;" an overview of benchmark findings and inspiring messages
     Key 2020 Takeaways█                                                                                      █10    supported by key 2020 takeaways in numbers and topic summaries. Next comes an introduction to the Material
     Topic Summaries█                                                                                         █14    Change Index, featuring the Leaders Circle, celebrating leading and up-and-coming companies that performed
     2020 Material Change Leaderboard█                                                                        █18    exceptionally well across the holistic Material Change Index (MCI), including Circularity and the Sustainable
                                                                                                                      Development Goals (SDGs). For the first time, the Leaders Circle showcases "big movers" whose scores were
                                                                                                                      the most improved year-on-year. It also welcomes new companies that have either stepped up to the MCI for
    Part A: Analysis█                               █22     Part B: Data Deep Dive█                          █80    the first time this year or have jumped straight in and completed the full MCI survey from the get-go.
    Business Integration█                           █24     Business Integration█                            █82
                                                                                                                      Part A: Analysis
     Strategy█                                       █24     Strategy█                                        █82
     Sustainable Development Goals█                  █28      Sustainable Development Goals█                  █86   Part A contains the main body of the analysis and is organized according to the benchmark framework:
                                                                                                                      Business Integration, Sustainable Development Goals, Circularity, and Material Portfolios including Cotton,
     Circularity█                                    █32      Circularity█                                    █88
                                                                                                                      Polyester, Polyamide, Manmade Cellulosics, Wool, Down, and Leather. Each topic includes the following:
    Materials Portfolio█                            █46     Materials Portfolio█                             █94
     Cotton█                                         █46     Cotton█                                          █94   • Topic summaries: A succinct look at the industry state of play and opportunities for improvement
     Polyester█                                      █50     Polyester█                                       █98   • Top-line numbers: An infographic for each material, providing a profile of the participants, outcomes, and
     Polyamide█                                      █54     Polyamide █                                    █102      impacts of their improved sourcing practices, with a focus on climate change - in collaboration with the
                                                                                                                        Sustainable Apparel Coalition and Higg.
     Manmade Cellulosics█                            █58      Manmade Cellulosics█                          █106
     Wool█                                           █62      Wool█                                         █110    • Company highlights: A snapshot of company actions based on survey submissions, designed to spark
                                                                                                                        inspiration.
     Down█                                           █66      Down█                                         █114
     Leather█                                        █70      Leather█                                      █118    • Analysis highlights: A round-up of the quantitative and qualitative data; bringing important findings from Part
                                                                                                                        B: Data Deep Dive into an analytical narrative.
     Other Materials█                                █74
                                                                                                                      • Extra insights: Additional contributions, analysis, and findings that complement the data.
    Part C: Extra Insights█                                                                                  █122
                                                                                                                      Part B: Data Deep Dive
     Benchmarking Suppliers & Manufacturers█                                                                  █124
                                                                                                                      Part B contains the quantitative data analysis. Highly visual, Part B is organized according to the benchmark
    Part D: About the Benchmark Program█                                                                     █138    framework, mirroring Part A. Part B also includes a representative selection of company comments (presented
     Methodology█                                                                                             █140   as quotes), unattributed but identified by sub sector category.
     Resources█                                                                                               █143
     2020 Participants█                                                                                       █144   Part C: Extra Insights – Pioneering the Suppliers Pilot
     Acknowledgements█                                                                                        █148   Part C provides an overview of the qualitative insights derived from the Material Change Index Pilot for Suppliers.
                                                                                                                      The pilot, an opportunity for suppliers and manufacturers to benchmark in much the same way as brands and
                                                                                                                      retailers, is organized according to themes from the benchmark framework: Strategy and Materiality, Materials
                                                                                                                      Portfolio, Circularity, Climate Change, and the Sustainable Development Goals. Each theme is accompanied by
         Extra Insights
                                                                                                                      'Supplier Spotlights' that highlight the positive steps these pioneering suppliers and manufacturers are taking
          Circularity                                 32                                                             towards producing and sourcing preferred materials.
          Other Materials                             74
          Benchmarking Suppliers & Manufacturers    124                                                              Part D: About the Benchmark Program

                                                                                                                      Further information on the benchmark program.

                                                            Use these icons to navigate to Part A: Analysis                      Use these icons to navigate to Part B: Data Deep Dive

    Cover image: Carlotta Cataldi

4 ••Textile Exchange © 2020         Contents                                                                                                                                                            Material Change Insights Report•• 5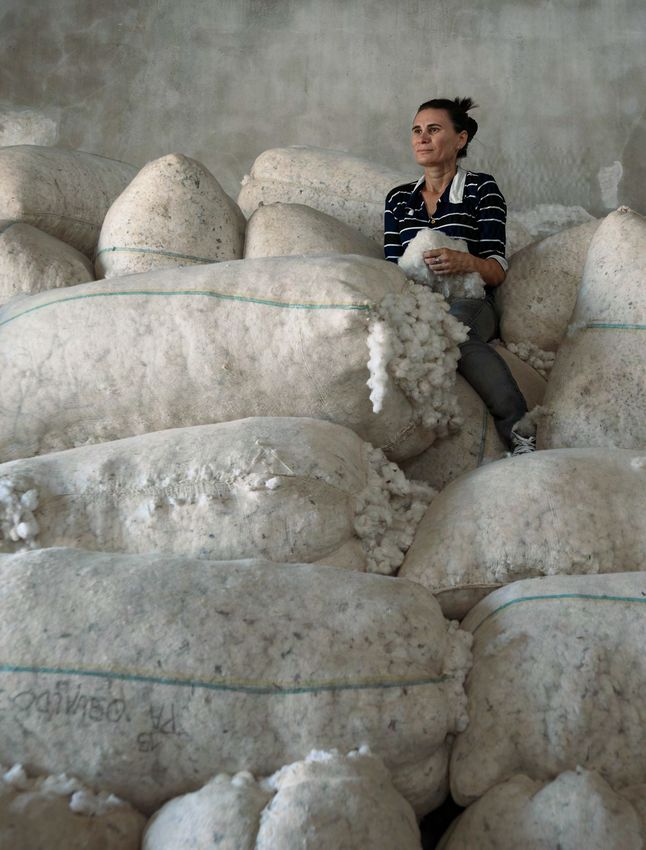
State of the Sector
    Executive Summary                                                                                                    Executive Summary

    5 Index trends - growth boosted by circularity efforts.                                                              5 actions - you can take with Textile Exchange right now.
    #1. Participation up 10%.                                                                                            To reach science-based climate targets of 45% reduced emissions in materials by 2030, we urgently need to:
    191 participants compared to 173 the previous year, greatest participation growth was within the Apparel/
                                                                                                                         #1. Be "deforestation and land conversion-free" for everything.
    Footwear sub-sector, and in terms of survey selection, participation in the full MCI survey grew more than
    modular or progress tracker entries.                                                                                 From cellulose feedstocks to animal fibers, and leather to rubber production. For manmade cellulosics, brands
                                                                                                                         should source from CanopyStyle’s “green shirt” suppliers.
    #2. Index average score up 17%.
                                                                                                                         #2. Source from climate-smart and nature-positive farms.
    The average MCI score was up by 9.8 points (increasing 17% from 65.33 to 72.53), while remaining at the
    Level 3 “Maturing” performance band.                                                                                 Find farms that work to sequester carbon, protect and restore landscapes and biodiversity (both on and off
                                                                                                                         "productive" land). Research and guidance on carbon sequestration, nature-based solutions, and regenerative
    #3. Circularity drives the increase.                                                                                 agriculture is improving but still in its infancy. Look for responsible wool, organic, organic in-conversion, and
                                                                                                                         regenerative organic certified, among others.
    The score for circularity tipped the Circularity Index average from a Level 2 over to a Level 3 (up 16.01 points
    from 34.82 to 50.83). Circularity scores increased on average by 37% with the biggest growth among outdoor/
                                                                                                                         #3. Decouple your materials portfolio from oil.
    sports brands.
                                                                                                                         There are ways to do this that can disrupt conventional business models and materials (although some are
    #4. Preferred materials now 44% of Index portfolio.                                                                  still emerging as solutions); such as, displacing virgin oil-based synthetics by sourcing more recycled and
                                                                                                                         responsibly produced biobased materials, scaling textile-to-textile recycling, and shifting to re-commerce and
    Uptake of preferred materials was up 24%, (from 1.7 million tonnes reported in 2019 to 2.0 million tonnes
                                                                                                                         other service-based models that increase the first life or products.
    reported in 2020) and preferred materials now account for 44% of the Index portfolio (previously, 39%). Preferred
    renewable cotton and recycled polyester accounted for most of this growth. Preferred cotton increased by
                                                                                                                         #4. Address the innovation gap.
    26% (1.3 million to 1.6 million tonnes/63% of cotton uptake) and recycled polyester by 30% (from 0.2 million
    tonnes/18% of polyester uptake to 0.3 million tonnes/21%).                                                           Invest, partner, and pilot R&D and green technology, including biobased and innovative new materials, closed
                                                                                                                         loop production systems, and other innovation that will accelerate, scale, and lead to wider systems change.
    #5. Greenhouse gas savings show some improvement.
                                                                                                                         #5. Invest for multiple returns.
    While the volumes of preferred materials increased, the impact on carbon emissions requires more evidence.
    This is because much of the uptake growth is coming from the increased use of Better Cotton (BCI) and there is       Your return on investment must create prosperity and a better world for all - doing good, not just less bad.
    currently no life cycle assessment (LCA) data to back climate improvements. The most evidence of reduction is        We call this “ROI2” - Return on Investment x Return on Impact. Value sharing and inclusive wealth creation
    linked to the use of recycled polyester. Savings there were 0.7 million tonnes CO2eq, a 16% saving over a fully      incentivizes and rewards the right action. Making sure there is a just transition towards a new economy will also

    0+0+
      0+83 0+
           0+74 0+
                0+70 0+
                     0+67 0+66
    conventional polyester use.                                                                                          be key to reaching global goals.

                                                                                                                         While we cannot yet put hard carbon metrics against all the above, we know enough to act positively. A “no
    5 materials-related business risks – biodiversity tops the list.                                                     regrets” approach to action is important (but be mindful of not overstating claims and greenwashing). We also
                                                                                                                         know it will take multiple good acts to move the industry forward (it will not be a one size fits all). So, alongside
                                                                                                                         action, we must commit to science-based improvements, transparency, and dialogue - and, most of all,
                                                                                                                         collaboration.

                                                                                                                         10 years – This is our decisive decade.
           Biodiversity Loss/    Climate Change        Human Rights             Water              Chemicals             Our results show progress, but the transition towards a kinder and more sustainable world needs to happen
           Land Use Change            74%                  70%                  67%                  66%                 fast. This means our industry must be socially just, nature positive, and circular – and make real change - within
                 83%
                                                                                                                         the next 10 years.
    Awareness of environmental, social, and governance (ESG) risk has increased sharply over the past year and
    not least in relation to raw materials. We highlighted the direct connection between biodiversity loss and climate   Join us in Creating Material Change.
    change in our last report and, while climate change was the top-rated risk in the 2019 benchmark, in 2020
    biodiversity loss has taken over, rising from 6th to 1st position.

6 ••Textile Exchange © 2020           Contents                                                                                                                                                                Material Change Insights Report•• 7
State of the Sector
    Executive Summary                                                                                                            Executive Summary

    5 Insights – Be inspired.
    #1. Ambition is in fashion.
    Business is driving a race to the top with leading companies stepping up on ambitious target setting. At 88%,
    a clear majority of participating companies have now set 100% uptake targets for preferred materials and 45%
    have set circular targets into corporate agendas.

    #2. From selling goods to selling Good.
    When a surfwear brand's website is all about ocean conservation rather than selling clothes, AND it commits to
    100% recycled or more sustainable materials, we know the system is shifting. Piping Hot, an Australian surfwear
    brand, focuses its sustainability strategy by asking itself how we can continue to surf for generations to come.
    Backing up its ambition with action and results, Piping Hot has moved up from a Level 2 in 2019 to a Level 3
    this year.

    #3. People and planet at the heart of corporate mission.
    Beyond the business targets, action has become a moral imperative for leaders, joining the dots between
    interconnected crises. Companies now have a materials mission. Whether it is focused on climate change,
    nature loss, or the mountains of waste driving the cause, leaders know their business depends upon integrating
    solutions to these problems. With tangible efforts being made both upstream into supplier communities and
    within the neighborhoods of their customers, business is IN and FOR society.

    #4. Finding their superpower.
    Companies are finding their own path to making an impact, while keeping their eyes on the goal. Leverage and
    scale might work for some companies, while agility and intimacy may work for others. First movers can develop
    an innovation and others can follow with scale; there can be complementary fits between a new startup and an
    iconic brand. We are seeing a shift from siloing issues to thinking about system shifts, with the Insights Report
    playing a role to surface and share these individual learnings that can benefit everyone.

    #5. Committed to improvement. Together.
    Collecting data and reporting is central to transparency. Textile Exchange works hard to keep everyone on track
    and accountable. We provide the framework, the yardstick, and the support. Beyond just providing the data
    template, we train, educate, and support companies completing the benchmark with workshops, training, and
    connecting members to each other. The virtuous cycle of benchmarking and knowledge-sharing allows the
    entire industry to benefit - so we're committed to continuing this support.

                                                                                            Photo (right): Veja (Cotton bales)

8 ••Textile Exchange © 2020           Contents                                                                                                       Material Change Insights Report•• 9
State of the Sector
    Key 2020 Takeaways                                                                                                        Key 2020 Takeaways

       Five big trends                                                                                                         Preferred materials uptake by region

                                                                                                                               Europe accounted for 70% of global preferred materials uptake in 2019.
                                                                                  Uptake of preferred
                         Material Change Index
           17                                                       44%
                 %                                                                materials now account for
                         scores increased on                                      44% of the Index portfolio
                         average by 17%.                                          (previously, 39%).
                                                                                                                                                              North
                                                                                                                                                                                            Europe
                                                                                                                                                                                            70%
                                                                                                                                                             America

                                                                                                                                                              29%
                               125%                   Companies in the MCI Level 4 Leading band
                                                      increased from 16 in 2019 to 36 in 2020.

                                                                                                                                                                                                      Africa
                                                                                                                                                                           Latin
                                                                                                                                                                          America
State of the Sector
    Key 2020 Takeaways                                                                                                                                                                           Key 2020 Takeaways

                          Snapshot of preferred materials                                                                                                                                         Positive environmental impacts achieved through preferred materials sourcing

                                                                                  Cotton                                  Polyester           Manmade Cellulosics                    Polyamide
                    100%                       100%                      55% of total portfolio                             33%                          7%                            4%          1.37 million tonnes CO2eq                       28 billion megajoules                              643 billion liters
                                                                                                                                                                                                  of greenhouse gas emissions saved                 of fossil fuel energy saved                         of water saved
                                                                       37% conventional cotton
    Share of preferred

                               56%
                                                                             1% recycled cotton
                                                                                                                                                                        69%
                                                                                                                                                79%
                                8%                                                                                                                                              98%

                                                                   62% preferred, renewable cotton
                               36%                                                                                                                                       31%
                                                                                                                                                21%                             2%
                                                                                                                                                                                                  Equivalent to driving 5.4 billion kms         Equivalent to powering 631,014                Equivalent to the water needs of
                         0%             100%   0%           10%          20%           30%           40%           50%            60%         70%           80%          90%           100%
                                                                                                                                                                                                       in an average sized car                      US homes for one year                      587 million people for one year
                          Total portfolio                                                            Material-specific breakdown                                  Wool           Down
                                                                                                                                                                  1%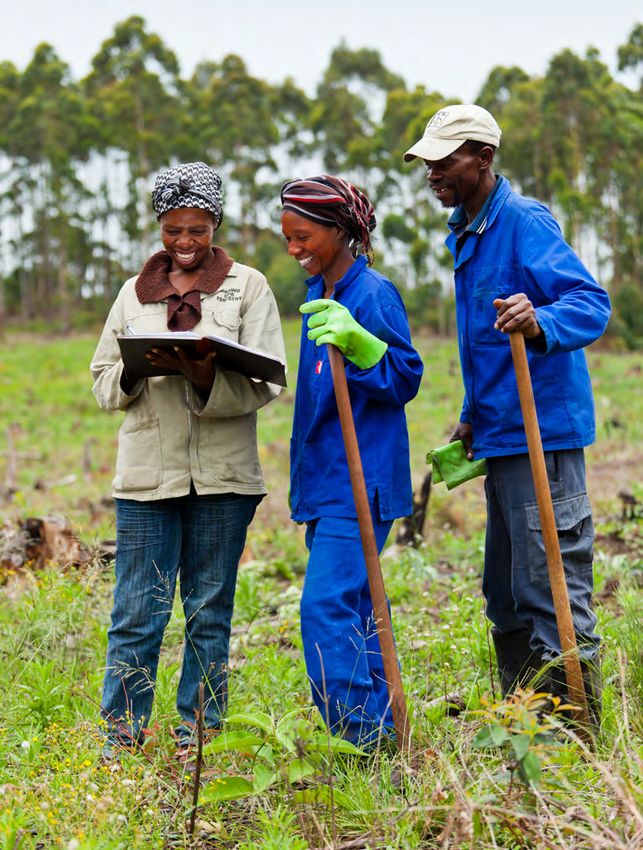
State of the Sector
    Topic Summaries                                                                                                         Topic Summaries

        Strategy                                                                                                                Polyester

    State of play                                                Areas to improve                                           State of play                                            Areas to improve
    Material strategies are the norm, cotton-focused,            With material strategies in full flow, now is the time     Certified recycled polyester is on the rise and slowly   More focus is needed to accelerate the transition to
    and increasingly aligning with company strategy              to sharpen customer-facing communications by               displacing conventional, with as many brands using       recycled polyester, preferably from post-consumer
    and SDGs. Approaches to materiality assessments              publicizing targets and using them as an engagement        conventional as are using preferred programs. GRS        textiles and socially responsible collection programs.
    are inconsistent but arrive at similar priority themes:      tool from over-the-till conversations with customers to    is the most widely adopted certification. Most brands    Brands should aspire to certify their entire supply
    addressing climate change, biodiversity, and human           third-party validated sustainability reports.              are set on a “100% more sustainable” target, but         chains and monitor impacts through data provided
    rights.                                                                                                                 these are not widely publicized.                         from their own supply chain.

        Sustainable Development Goals                                                                                           Polyamide

    State of play                                                Areas to improve                                           State of play                                            Areas to improve
    Companies increasingly recognize the SDGs as a               There is significant room to formally write the SDGs       As a lesser used fiber, polyamide uptake is              Given widespread public concern about plastic,
    common language with which to unite intentions.              into strategies. Increasing supply chain transparency      overwhelmingly conventional, despite half of brands      taking action on polyamide is an untapped
    Whether the SDGs are leading brands' strategic               would facilitate prioritization and target setting. To     sourcing recycled polyamide (mostly GRS certified).      engagement opportunity. This starts with investing
    direction, or they simply align with their existing goals,   improve confidence, and cross-industry collaboration       Traceability, direct intervention, and investment are    in exploring sustainable alternatives – a few industry
    most brands recognize the important themes to                and investment in issues that matter, brands could         low.                                                     programs exist to do this - and setting targets.
    which they need to contribute. However, measuring            also consider what role they can play in engaging
    progress is not easy.                                        stakeholders, including investors, in this global
                                                                 language.                                                      Manmade Cellulosics

                                                                                                                            State of play                                            Areas to improve
                                                                                                                            Deforestation and pollution remain the top-cited risks   Investment and stakeholder collaboration are needed
        Circularity
                                                                                                                            from fiber production. The most significant advances     to improve transparency in feedstock sourcing. The
    State of play                                                Areas to improve                                           are in the sustainability of pulp and fiber production   pace of change is linked to sourcing from a few
    A circularity agenda is proving to be an essential part      Business models are starting to shift but there needs      and exploring alternative feedstock options.             key leading suppliers rather than having industry
    of every company’s strategy, with companies setting          to be more scale. Companies are investing in circular                                                               sustainability standards for pulp and fiber production.
    measurable targets to help them focus. Resource              design, however, next is to go beyond “longevity/                                                                   Developments in ZDHC guidelines are addressing
    efficiency through supply chain management is                durability” to capture innovative design principles                                                                 these areas for improvement.
    the most advanced area of implementation, which              such as recyclability. Line of sight into destinations
    generally has its origins in good business efficiencies.     and volumes of post-consumer waste needs to
                                                                 improve to better understand risk and opportunity.             Wool

                                                                                                                            State of play                                            Areas to improve
                                                                                                                            Conventional wool dominates, and recycled wool is        Half of brands are yet to set SMART targets,
        Cotton
                                                                                                                            the most common preferred program despite minimal        which is key to improving the uptake of
    State of play                                                Areas to improve                                           uptake. Though many brands employ "non-mulesing"         preferred wool programs. Further investment is
    Cotton is the focus fiber for investments, uptake            A focus on mapping supply chain to farm location           policies, direct interventions remain low to monitor     needed in direct intervention and/or certification
    commitments, and supply chain mapping. Preferred             level will enable more direct intervention and impact      the effectiveness of policies. More brands now use       to ensure the efficacy of risk management
    renewable cotton is in growth, with preferred                monitoring. Full supply chain certification will improve   certification to manage processing risks but this is     at farm level, where the top risks lie.
    materials programs widespread. Recycled uptake               operations and consumer engagement. There                  often where certification stops.
    remains static. More companies are reporting positive        is untapped potential around recycled cotton -
    impacts, but most are based on generic industry              investment in innovation and greater collaboration are
    data.                                                        needed to boost and scale.

14 ••Textile Exchange © 2020            Contents                                                                                                                                                          Material Change Insights Report•• 15
State of the Sector
    Topic Summaries                                                                                                           Topic Summaries

        Down

    State of play                                           Areas to improve
    Most brands have reached their “100% more               A reliance on certified down has left direct
    sustainable down” target, relying on certified          intervention and regional supply chain mapping low
    down to mitigate the highest rated risks,               priority. With greater supply chain transparency back
    which are at farm level. Responsible Down               to farm level, brands can more accurately assess,
    Standard (RDS) is the widest used program,              monitor, and intervene to mitigate key risks and
    and Downpass has the highest uptake.                    enable contact directly with suppliers.

       Leather

    State of play                                           Areas to improve
    Brands are gradually mapping their leather supply       Many leather-dominant brands, who are already
    chain and most manage to identify suppliers back        engaged in working on the sustainability of their
    to tanning level. Only a few have managed to map        supply chain, are investing a lot of resources in
    their leather supply back to farm level. Very few       traceability and setting targets to fully trace their
    brands use robust traceability systems, and there is    leather supply chain. This will enable companies to
    no certified traceability scheme available for virgin   implement direct interventions at farm level; mitigation
    leather. Brands rely on policy from suppliers to        more effective than relying on policies provided to
    manage risks at farm level. Half of the respondents     suppliers at a higher tier.
    are sourcing from Leather Working Group (LWG)
    suppliers, and many have targets to increase their
    sourcing from LWG suppliers.

                                                                                          Photo (right): Veja (Peru cotton)

16 ••Textile Exchange © 2020          Contents                                                                                                  Material Change Insights Report•• 17
State of the Sector
    2020 Material Change Leaderboard                                                                                      2020 Material Change Leaderboard

    The Material Change Index                                                                                             Participation in 2020

    Textile Exchange's Material Change Index (MCI) is a voluntary benchmark that tracks the apparel and textile           The chart shows a distribution of the 2020 participants’ overall achievement within our set “bandings.” MCI
    sector's progress toward more sustainable materials sourcing, as well as alignment with global efforts like the       Level 1 also includes companies submitting modular surveys. Progress Trackers do not receive index scores,
    Sustainable Development Goals and the transition to a circular economy. As a voluntary benchmark, the MCI             but their reported volumes are incorporated into the uptake accounting and contribute to the Material Impact
    is based on companies' willingness to be transparent and disclose their materials uptake and management               Dashboard.
    practices - in order to learn from each other and promote inclusive progress.

    The MCI Family of Indices                                                                                                                    40
    The Material Change Index (MCI) is the cornerstone of the “MCI family of indices.” The MCI incorporates scores                                                                                          3
    achieved across the full benchmark framework: Strategy and integration, Circularity, and the portfolio of priority                           35                                                                            4
    materials, i.e., comprising over 10% of their material use by volume, and/or assessed as holding high risk and/or
    opportunity potential (see definition in the methodology). The MCI family of indices includes a number of related                            30
    indices: Circularity, SDGs, and Material Portfolio Indices for Cotton, Polyester, Polyamide, Manmade Cellulosics,

                                                                                                                          MCI participants (%)
    Wool, Down, and Leather. Companies can benchmark themselves within “non-priority” materials, but scores do                                   25
    not contribute to their overall MCI result.
                                                                                                                                                 20
    Methodology
                                                                                                                                                                     1
    Our methodology is continually refined through consultation with a wide range of stakeholders, including our                                 15
    participating companies. Our program and processes are externally assured by ELEVATE in accordance with
    Global Reporting Initiative (GRI) guidelines, bringing increased credibility and confidence in the results as the
    program grows in size and importance. See Part D for further details and links to resources.
                                                                                                                                                 10                                     2
    Performance Bandings
                                                                                                                                                  5

    MCI family of Indices results are assigned to one of four performance bands.                                                                  0
                                                                                                                                                      Progress   MCI Level 1       MCI Level 2        MCI Level 3         MCI Level 4
                                                                                                                                                       Tracker   Developing        Establishing        Maturing            Leading
                   Developing                                                    Establishing
                                                                                                                                                                  (Modular)
          1        This level is for companies that are
                   laying the foundation of their programs
                                                                       2         This level is for companies that are
                                                                                 strengthening their programs and
                   and scored 25 or less out of 100                              scored 26-50 out of 100 possible         Material Change Leaderboard
                   possible points.                                              points.
                                                                                                                          The Material Change Index produces the public Material Change Leaderboard and includes all participants
                                                                                                                          taking part in the MCI, either by completing the full MCI, modules within the MCI family of indices, or the
                                                                                                                          progress tracker – and that agree to be publicly listed. Note, companies are allowed to participate anonymously,
                   Maturing                                                      Leading                                  especially at the beginning of their benchmarking journey, if they so choose.

          3        This level is for companies with
                   emerging leadership that scored 51-75
                                                                       4         This level is for companies that are
                                                                                 pioneering industry transformation and   Textile Exchange introduced the public-facing Material Change Leaderboard in 2019 to provide a more holistic
                   out of 100 possible points.                                   scored 76-100 out of 100 possible        and contemporary assessment of leadership than the volume-based focus of the past. The MCI is based on
                                                                                 points.                                  a company's management practices (including risk assessment, transparency, investment, target setting, and
                                                                                                                          impact measurement) as well as the adoption rate of preferred fibers and materials. In this way it reflects both
                                                                                                                          intention and action. See the Material Change Index – Leaderboard for 2020.
            The Modular symbol recognizes companies who have completed one or more fiber modules.

            The Progress Tracker symbol recognizes companies who have not completed material modules but
            who do submit progress data.

18 ••Textile Exchange © 2020           Contents                                                                                                                                                           Material Change Insights Report•• 19
State of the Sector
2020 Material Change Leaderboard 2020 Material Change Leaderboard
Material Change Index – Leaders' Circle 2020 MCI Big Movers
The 2020 Material Change Leaders Circle includes companies that have achieved a Level 4 Leading position in These 10 companies made the greatest improvement in the MCI from 2019 to 2020.
the 2020 Material Change Index (MCI) and/or have made achievements in other ways (as listed).
MCI Big Movers
MCI Level 4 Leading
C&J Clark Limited Kuyichi B.V.
36 companies reached a level 4 Leading in the MCI this year – indicating exceptional progress by this group of Columbia Sportswear Company ORSAY GmbH
frontrunners across the board from embedding strategy, expansion and growth in preferred materials portfolios,
Darn Tough Vermont Outerknown
and actioning circularity agendas.
Deckers Brands Piping Hot Australia Pty Ltd.
KappAhl Sveridge AB Royal Robbins LLC
MCI Level 4 Leading
adidas AG Inditex Group NIKE, Inc.
ARMEDANGELS KALANI-home Norrøna Sport MCI New Entries
Boll & Branch Kathmandu Limited Nudie Jeans These 22 companies completed the MCI (full survey) for the first time.
C&A Kering Outerknown
Coop Group Knickey Patagonia MCI New Entries
Coyuchi, Inc. Kuyichi BV prAna Benetton Group Naturepedic Organic Mattresses
DECATHLON SA Levi Strauss & Co. PUMA SE Dickies, a division of VF Outdoor, LLC* New Balance
Dedicated Sweden AB Lindex PVH Corp. ECOfashion Corp Next Plc.
EILEEN FISHER, INC. Loomstate, LLC Smartwool Gina Tricot Reformation
Gap Inc. Mantis World Limited Stanley/Stella SA Hanky Panky Sanctuary Innerwear
H&M Group Marks and Spencer Tchibo GmbH IVY & OAK Scania Truck Gear
IKEA of Sweden AB MUD Jeans International BV Veja Fair Trade SARL Joules Smartwool, a division of VF Outdoor, LLC
Kering The Cotton Group
SDG Level 4 leaders Circularity Level 4 leaders Lojas Renner The North Face
Moose Knuckles VARNER
These 13 companies reached a level 4 in the SDG Index. These 9 companies reached a level 4 in circularity.
Mulberry Zalando
SDG Level 4 leaders Circularity Level 4 leaders
C&A C&A MCI Suppliers Pilot
Deckers Brands H&M Group These 16 companies are pioneers by piloting the MCI for suppliers and manufacturers.
Dickies, a division of VF Outdoor, LLC Knickey
H&M Group MUD Jeans International BV MCI Suppliers Pilot
IKEA of Sweden AB Nudie Jeans Anubha Industries Private Limited Sulochana Cotton Spinning Mills Pvt. Ltd
Inditex Group Outerknown Birla Cellulose, India Sustainable Down Source
Kering Patagonia Crestex The Schneider Group
Levi Strauss & Co prAna Eastman Unifi, Inc.
MUD Jeans International BV The North Face, a division of VF Outdoor, LLC Egedeniz Textile Waste2Wear
Outerknown Lenzing AG Welspun India Limited
PUMA SE Orimpex Textiles WestPoint Home LLC
PVH Corp. Sapphire Textile Mills Limited World Textile Sourcing (WTS)
Smartwool, a division of VF Outdoor, LLC
20 ••Textile Exchange © 2020 Contents Material Change Insights Report•• 21Part A:
Analysis
22 ••Textile Exchange © 2020 Contents Material Change Insights Report•• 23Index average
Business Integration 3
Strategy Strategy
State of play Areas to improve
Material strategies are the norm, cotton-focused, With material strategies in full flow, now is the time
and increasingly aligning with company strategy to sharpen customer-facing communications by
and SDGs. Approaches to materiality assessments publicizing targets and using them as an engagement
are inconsistent but arrive at similar priority themes: tool from over-the-till conversations with customers to
addressing climate change, biodiversity, and human third-party validated sustainability reports.
rights.
Company Highlights
• A fashion brand has shown how financial and environmental sustainability go hand in hand by
addressing overproduction. They have reduced production, improved the sustainability of materials,
and increased the cost to the consumer. Turnover has increased, waste reduced, and environmental
and social impacts improved.
• A luxury fashion brand has partnered with a gaming company to help engage consumers in its
sustainable digital fashion line. Players can select outfits from a sustainable range and on entering
rooms containing the outfits their 'mood' goes up.
• A fashion brand will not work with suppliers until they have declared their suppliers’ subcontractors
(Tier 2) and fiber producers (Tier 3). Another prerequisite is a commitment to meeting their sourcing
policy, and a willingness to work transparently and collaboratively with the brand to guarantee
compliance with those requirements.
• One company inspires its 38,000+ employees to incorporate biodiversity into their daily lives,
through diverse activities such as bee-keeping clubs, citizen science projects, online biodiversity, and
sustainability training and games.
• To assess materiality, one jeans brand assesses impact through third-party consultant Life Cycle
Assessments (LCAs) of current and potential materials, incorporating regional supplier, processing,
and scarcity factors to ensure accuracy. They weigh up all material choices against their long-term
sustainability commitments, ROI potential, reputational value, and stakeholder concerns to ensure
alignment. They then identify and assess risks through periodic formal assessments including
materiality assessments, supply chain risk assessments, and life cycle analyses.
• One outdoor brand's founder, now 80 years old, takes a proactive approach to raise awareness
about social and environmental issues - going as far as helping to sue Donald Trump!
Photo (right): SAPPI (Project Khulisa)
24 ••Textile Exchange © 2020 Contents Material Change Insights Report•• 25Business Integration
Strategy Strategy
Analysis Highlights Deep dive into data Analysis Highlights Deep dive into data
1. Strategy - More targets - mostly for cotton; public commitments & SDGs helping 5. Customer Engagement - Inclusion of SDGs and collaboration across internal teams would support
Nearly all respondents (99%) have a materials strategy, and great annual progress has been made deeper customer engagement on sustainability topics
aligning with corporate strategy (91% - up 15% YOY). This overall increase is mostly accountable to There is widespread customer engagement but to varying degrees among brands and retailers. 98% of
company alignment with the UN Sustainable Development Goals (SDGs), the strategic north star for 45% respondents publish information about sustainable sourcing, mostly through their website (90%), and own
of respondents (up 10% YOY) - see page 28. Popularity in public commitments to global agendas on-product labels (83%), and to a lesser extent (53%) through standardized third-party certification. The
has grown 8% within the reporting year to 66%, with a 10% rise in our respondents signing the Science majority (68%) of respondents are not yet considering engaging customers on SDGs. Although 77% of
Based Target initiative (34%), now top of the list followed by the Fashion Industry Charter (33%), and brands engage their customers through social media campaigns; closer alignment between sustainability
UN Global Compact (28%). Cotton is the most popular fiber for which to set a “100% more sustainable” and marketing, communications and sales teams would increase the reach of sustainability messaging on
target, chosen by 78 companies, followed by manmade cellulosics (42 companies), down (35), polyester important sustainability topics including sourcing, certification and SDGs.
(34), wool (25), leather (22), and polyamide (16).
6. Reporting - Widespread, but depth and assurance of information varies
2. Leadership - Leadership could be improved through more senior level accountability, vocal support 52% of participants make themselves publicly accountable by sharing progress against targets, and
and advocacy 18% share general information only. Sustainability reports are published by 72% of respondents, with
For the majority of companies, the CEO (50%) or Board (10%) holds accountability for fiber and materials 17% reporting in the company's financial report and 16% as part of an integrated report. Reporting to
strategy, setting the “tone at the top”. However, there is room for more vocal support and advocacy at a recognized framework is an investment in time and resource made by 15% of respondents (mostly
this level given 91% of companies’ fiber and materials strategies are aligned with corporate strategy. the larger sized, publicly owned companies), and 15% engage a third-party to review reports using a
85% of CEOs displayed leadership in the reporting year; 63% in an annual report statement (and not all standardized framework. 35% of participants seek data assurance by independent third parties, 36% rely
companies had these), 53% through corporate advocacy, and 30% by presenting at a major conference. on internal reviews, and 12% do not validate data at all.
3. Internal Engagement - Room for development with consumer-facing staff, and incentives
For 88% of respondents, responsibilities for fiber and materials strategy extend beyond the sustainability
department. Implied departments include product design (89%), sourcing (88%), marketing/
communications (77%), and sales (59%). This is evidenced through training (90%), job descriptions (86%),
and key performance indicators (KPIs) (68%). Brands are making progress assigning more responsibility
to C-Suite and Board members, up 7% (55%) and 10% (43%) respectively on last year. Although we see
responsibilities shifting towards core business activities, which indicates that sustainability is becoming
more embedded in the company’s strategy and operations including through inclusion in job descriptions
(86%) and KPIs (68%), in 60% of cases delivery is not incentivized or rewarded.
4. Materiality - Generic data and supplier/NGO/staff input informing most assessments
85% of companies considered environmental and socioeconomic risk factors for all or the majority of their
fibers. We observed that companies struggled to clearly identify and/or prioritize risks and opportunities
for this question; perhaps calling for more uniformity or support in this area. Through mostly qualitative
reviews (78%) and materiality assessments (59%), the most commonly cited risks across their materials
portfolio were biodiversity loss/ land use change (83%), climate change (74%), and human rights (70%),
with integrity the lowest-rated risk (23%) by comparison. Companies consult widely on their materials
strategy, but external consultation from suppliers (87%) and NGOs (78%) were the most prized inputs
alongside employees (78%). To inform strategy-making, generic industry data using the Sustainable
Apparel Coalition’s Higg MSI (59% - up 12% YOY) and generic LCAs (53%) were favored over supply
chain-specific data i.e., supplier LCAs (41%), own tools (36%), and self-commissioned LCAs (29%).
26 ••Textile Exchange © 2020 Contents Material Change Insights Report•• 27Index average
Business Integration 3
Sustainable Development Goals Sustainable Development Goals
State of play Areas to improve
Companies increasingly recognize the SDGs as a There is significant room to formally write the SDGs
common language with which to unite intentions. into strategies. Increasing supply chain transparency
Whether the SDGs are leading brands' strategic would facilitate prioritization and target setting. To
direction, or they simply align with their existing goals, improve confidence, and cross-industry collaboration
most brands recognize the important themes to and investment in issues that matter, brands could
which they need to contribute. However, measuring also consider what role they can play in engaging
progress is not easy. stakeholders, including investors, in this global
language.
Company Highlights
• A jeans brand addresses SDGs 1, 3, 4, 5, and 8 with its employee wellbeing practices, and volunteer
work through its worker well-being initiative. The brand's goal is that by 2020, 80 percent of its
product volume would be produced in locations that have worker well-being programs in place,
reaching 200,000 workers.
• One company has identified, through its materiality matrix, its main priorities that align the Group with
the UN SDGs. As defined by the company's 2025 Sustainability Strategy, each of these priorities has
assigned to it quantitative targets to be reached by 2025.
• A large fashion brand has prioritized SDG 12 - Responsible Consumption and Production. The
company is committed to achieving the sustainable management and efficient use of natural
resources, to adopting sustainable practices, and to integrating sustainability information into the
reporting cycle.
• A small fashion brand has selected a majority of SDGs where they have a positive impact. Parallel
to this, internal trainings are conducted with relevant employees and data is collected along the
value chain to compare the company goals with the SDGs. Furthermore, in 2020 they started to
communicate SDGs actively with B2B customers.
Photo (right): SAPPI (Mapumalanga, environmental awareness)
28 ••Textile Exchange © 2020 Contents Material Change Insights Report•• 29Business Integration
Sustainable Development Goals Sustainable Development Goals
Analysis Highlights Deep dive into data Analysis Highlights Deep dive into data
Alignment - Strategy themes are converging with SDGs Customer Engagement - Weaving in slowly to external comms
Most companies (88%) recognize that their strategies align with the UN Sustainable Development Goals Interestingly, brands are more committed to communicating the SDGs externally than internally, with 34%
(SDGs), a promising sign that the textile industry is increasingly uniting on key issues of global importance. doing so - up 10% YOY. This is a promising indication that consistent language is being used to help
However, only half of brands (45% - up 12% YOY) have actually formalized this connection as part of consumers to make connections between sustainable textiles and global issues.
their corporate/materials strategy. Half (48%) have simply identified where their strategy aligns with one or
more SDG. Great progress would be formalizing strategies to align with the SDGs. Reporting - One fifth reporting substantially on SDGs
A third of brands (62%) integrate the SDGs into their company reporting to an extent; 21% excel by
Tracking progress - Transparency may be stalling efforts to track progress reporting targets and progress against targets. One fashion brand's annual report features an interactive
18% have set targets relating to one or more SDG, and an additional 22% go as far as tracking outcomes diagram featuring all of its SDG priorities. When you click on each SDG, a box-out reveals the targets,
and impacts. Target setting and impact monitoring is low though e.g., 29% set targets for Goal 12 progress against targets, and how they are achieving this.
(Sustainable Consumption and Production), and 35% are tracking outcomes and impacts. Setting and
measuring targets was most challenging for Goal 14 - Life Below Water; Goal 10 - Reduced Inequality;
Goal 6 - Clean Water and Sanitization; and Goal 2 - Zero Hunger (i.e., these SDGs were prioritized but
only in a few cases were targets set and impacts monitored).
Prioritization - Environmental and economic focus
The top SDG priorities were Goal 12 - Responsible Consumption and Production (84% selected this);
Goal 13 - Climate Action (76%); and Goal 8 - Decent Work and Economic Growth (67%). Goal 1 - No
poverty is the fastest rising priority (up 5% YOY to 35%) but is in 12th place.
Investment - Significantly more brands investing
Financial investment in addressing the SDGs, over and above the cost of purchasing preferred materials,
has become significantly more widespread than last year (45% - up 20% YOY). Of the 41 respondents
who are investing, 7% invest through innovative investment schemes such as green bonds, an area
where options are rapidly evolving in the financial sector. However, the majority contribute financially
through corporate investments (23%) e.g., a project to eliminate chemical use from the cotton supply
chain in the Cauvery River Basin; the planting of trees in Africa to reduce deforestation and boost
employment; and helping suppliers to seek funding to reduce water and energy usage.
Leadership - Still finding its way
There is a scattered distribution of accountability for the SDGs, at C-Suite/ Board level (29%), senior
management (29%), while over a quarter (27%) did not hold anyone accountable to the SDGs.
Employee Programs - Still low engagement, a huge opportunity for company culture
Of the respondents, 27% are either already talking or are starting to talk to employees about the SDGs
and integrate activities that encourage employees to consider their own contributions. Given this figure is
far lower than the number of companies who are aligning with the SDGs, it represents a huge opportunity
which could help deliver on targets, develop positive company culture, and contribute to staff retention
programs. More work and direction is possibly needed to help companies discover options and bridges
between existing corporate programs, such as volunteering and the SDGs.
30 ••Textile Exchange © 2020 Contents Material Change Insights Report•• 31Index average
Extra Insight 3
Circularity Circularity
State of play Areas to improve
A circularity agenda is proving to be an essential part Business models are starting to shift but there needs
of every company’s strategy, with companies setting to be more scale. Companies are investing in circular
measurable targets to help them focus. Resource design, however, next is to go beyond “longevity/
efficiency through supply chain management is durability” to capture innovative design principles
the most advanced area of implementation, which such as recyclability. Line of sight into destinations
generally has its origins in good business efficiencies. and volumes of post-consumer waste needs to
improve to better understand risk and opportunity.
Introduction
In 2020, Textile Exchange aligned the circularity As we head into this next decisive decade,
section of the Material Change Index (MCI) with the Textiles 2030 will accelerate the industry’s move
Ellen MacArthur Foundation’s Vision of a Circular
towards circular use of textile products and
Economy for Fashion and, together with Textiles
materials – reducing pressure on our climate
2030, produced a revised module and accompanying
Circularity Companion Guide. The Ellen MacArthur and natural capital. Collaboration will be key, so
Foundation is a leader in driving a circular economy the initiative brings together organisations from
and works with business, academia, policymakers, across the clothing and textiles sector to work
and institutions to mobilise systems solutions at towards ambitious targets for GHG and water
scale, globally. Textiles 2030 is a partnership of footprint. Textile Exchange and Textiles 2030
leading businesses for sustainability across clothing
support this sector alignment and we believe
retail, supply, reuse and recycling committed to fast-
tracking the UK Circular Economy. Both organizations consistent and aligned reporting are key to
bringing a wealth of knowledge and vision to the making this happen.
Material Change Index.
Dr. David Moon, WRAP
The section was completed by 83 companies
(totaling 145 when including subsidiaries covered) as
part of their MCI submission. Overall, a spectacular Working with Textile Exchange to align the
improvement was made, with scores increasing on Material Change Index with our Vision of a
average by 37% across the board and shifting the Circular Economy for Fashion is an exciting step
sector from a Level 2 (Establishing) position to a Level
towards adopting a common industry language
3 (Maturing). Notably, the outdoor/sports sub-sector
made the greatest progress.
that can inform measuring progress and setting
goals. It means we can better identify where the
The following insights on circularity, takes a deeper industry needs to collectively take action and
dive into this rapidly evolving topic, exploring the where we can celebrate success.
results of the 2020 benchmark, including a rich
collection of company highlights. Laura Balmond, Make Fashion Circular
Photo (right): Donnie Heddon, Patagonia (Quest for circularity)
32 ••Textile Exchange © 2020 Contents Material Change Insights Report•• 33Extra Insight
Circularity Circularity
Circular strategy
Company Highlights
Strategy – Commonplace, if at the beginning stages
• For one apparel/footwear company, 2019 was essentially a year of planning culminating in a new set
Back in 2017, 29% of participants had a circularity strategy (and 52% under development). A year later, it was
of corporate goals. Its 2019 efforts focused largely on increasing the use of recycled materials and
up to 43% and by 2019, doubled to 86%. With almost every MCI participant either having a strategy (87%) or
development of new recycled/circular materials. Further activities included expanding its footwear
developing one (12%), circularity is becoming embedded in business. However, many participants emphasized
repair program to cover more regions and models, building capabilities to support apparel repair and
that it is still early days. There were 3-4 key areas of focus: the use of recycled materials (80%), extending
re-commerce, and various supply chain efforts related to production efficiency, and waste reduction/
product life (72%), and resource efficiency, waste prevention, and diversion (64%). Reuse (59%) and textile
diversion.
collection (57%) were also popular elements. Lagging was designing for disassembly (40%), technical (41%),
and biological (25%) cyclability. • An outdoor company has set internal goals to divert all cutting waste from landfill by 2025, ensure
100% of its own waste (post-industrial and post-consumer) is used for high value, durable products
Alignment with Sustainable Development Goals – a third align with these by 2030, and have an end-of-life solution for every product it sells.
35% of participants are aligning their circularity strategy with the SDGs, mostly SDG 12 - Responsible
• One large holding company has standard operating procedures (SOPs) in place that outline
Production and Consumption and SDG 13 - Climate Action. 11% of participants are going the extra mile and
appropriate steps to take in case of excess inventory. This SOP is in line with the EPA Waste
making SDG target-level commitments.
Hierarchy and is referenced to ensure that products are sourced with waste prevention in mind.
For the company, this can take different forms including, reusing or donating items, buying in bulk,
Leadership – becoming more senior
reducing packaging, redesigning products, and reducing toxicity. Source reduction is also taken into
Completely different story this year. In 2019, only 9% of participants said accountability for their circularity
account in the manufacturing process. Ultimately, the company is focused on reuse, upcycling and
strategy sat with senior leadership. This year, 29% said accountability sits with the C-suite and 10% said the
down cycling and then finally recycling keeping the most environmentally preferred strategies in mind.
Board. Oversight is most likely to be with directors or senior managers (43%) and seldom left to middle level
managers to tackle alone (10%). Operationally, circularity tends to be integrated into sustainability team remits, • One jeans company reported a specifically marketed range which contains 40% post-consumer
but is also likely to be supported by, or part of, a cross-functional approach. recycled denim. This company has also invested in building out the regenerative organic supply chain
by agreeing to purchase in-conversion organic cotton from smallholder farmers. In addition, it has
Decoupling consumption from economic growth – interest in decoupling growing increased its uptake of hemp, a renewable fiber which is researched to be less water and chemical
There was a significant hike in the number of companies working to decouple economic growth from resource intensive than cotton in the cultivation stages. The company joined Fashion for Good to invest in
use, from 24% to 69% (YOY). Intensity reduction i.e., the reduction of virgin materials used relative to economic start-ups that are focusing on all areas of circularity from field to store.
growth, went from 19% of participants to 27%, while absolute reduction in materials use went from 5% to 14%. • One footwear company is prioritizing SDG 13 - Climate Action and SDG 12 - Responsible
Sourcing virgin renewable materials with regenerative qualities attracted a response from 22% participants. Consumption and Production. Other targets include setting a science-based target to reduce
greenhouse gas emissions by 2030, and sourcing only materials with a minimum of 50% recycled
Target setting – most targets around use of recycled feedstock content. The company has also set a target to launch a fully circular product by 2030.
48% of participants reported to have set one or more SMART target (Specific, Measurable, Achievable,
Realistic, and Timebound) for circularity. Use of recycled content (34%) is the most common, followed by design • An apparel company is partnering with the Hong Kong Research Institute of Textiles and Apparel to
for durability/longevity (25%), design for recyclability and disassembly (24%), post-consumer textile collection, move from a linear model to a circular model across the lifecycle of its textiles. The funded research
and use of safe chemistry (both at 23%). is in two important areas: separation of spandex from used garments and denim decolorization for
recycling.
Investment – three quarters funding innovation and technology
Corporate investment in circularity, both financial (59%) and in-kind (67%), is reportedly higher this year at 82%
of participants compared to 66% the year before. From the financial data provided by 23 companies (28% of
participants), 91% were investing in circular innovation and technology, 52% collaborations, 35% supply chain,
and 35% internal operations and capacity building, totaling just over USD 20 million. Approximately 75% of the
spend went to circular innovation and technology. 18% said outcomes are open source.
Corporate reporting – communicating commitments and activities increase
Reporting on circularity in the public domain has gone up from 50% to 73% (YOY) indicating a growth in
confidence and organization. General messaging is at 54% and commitments are at 53% (previously 38% and
32%, respectively). Reporting on progress is behind at 34% and, while strategy is being embedded, as noted
earlier, only 29% said they made their circularity strategy publicly available. In terms of public communications,
participants' comments suggest an increase in the near future.
34 ••Textile Exchange © 2020 Contents Material Change Insights Report•• 35Extra Insight
Circularity Circularity
Business models
Company Highlights
Service models – rental services constitute 74% of units reported
• In 2018, one apparel/footwear company announced that it was stopping, with immediate effect, the
Extending the first life of a product through alternative business models is definitely an area to watch. “Business
practice of destroying unsaleable finished products. During that year, the brand expanded existing
as usual” was (and continues to be) disrupted by the COVID 19 pandemic, resulting in sink or swim for some
reuse, repair, donation, and recycling routes, while developing new partnerships and revaluating
businesses. Arguably COVID sped up the route to market of “plans in progress” and for some there was no
solutions. The following year, the company handled around 15,000 repair and replacement-part
choice but to innovate and accelerate their fledgling alternatives. Responses to our survey have started to reflect
enquiries for products ranging from well-loved leather goods to vintage items. The company also
early signs of change, and this is likely to continue. Watch this space!
donated over 19,000 items of business clothing as part of its long-term partnerships with charities
such as Smart Works (an organization that is dressing and coaching unemployed women for job
Companies extending the first life of products through service provision and other models to maintain value in
success).
the first life of a product went from 62% up to 69%. In terms of “life-extending” offerings, repair services are still
the most common (34%), re-commerce and upcycling, both at 27% of respondents, and companies offering • One large retailer extended the life of its products either through re-commerce or by donating or
rental services went up from 12% to 18% (YOY). 35% of participants said they were customizing their business selling its overstock to B2B partners. In 2019, the company reported to have extended the life of one
models through “other methods”. Examples put forward included product bring-back and exchange schemes, million products through these channels and is currently aligning its new business approach with its
encouraging responsible product care through education, and even supplying washing accessories [to increase circularity strategy.
first life], and tips for customers so they can “do-it-yourself” home repair. Due to the high response to “other”,
• A company that makes uniforms (among other products) provides a garment take back initiative, and
Textile Exchange will be reviewing and improving this question and the guidance provided.
designs for re-personalization of uniforms.
It is early days for quantifying the commercial success of service-based business models, and companies were • One apparel company reported being in the pilot phase of starting up its circular business models,
either not able to report, or not comfortable reporting against the quantifiable metrics in the survey. Out of the with second hand as a starting point. For the company, the aim is to learn enough so that it can start
three options (share of business turnover, share of business displaced, and number of units) it was “number of strategizing around growth and profitability from circular business models through the selling of used
units” that had the best response rate. 14% of companies could provide metrics, resulting in over 6 million units garments.
reported, with rental being the most commonly reported service application. • One high-end fashion company integrates multiple techniques to extend a garments life, including
mending, overdyeing, re-utilizing in felting or garment reconstruction.
• An outdoor company has begun helping its customers to connect with others for them to trade and
sell their branded used products. The company wants its products to last at least 30 years.
• A fashion brand has published a guide and video tutorials for its customers that explain how to repair,
and extend the life of garments by taking better care of them.
• One apparel brand described how it encourages customers to carry out proper care at home and
offers customers biodegradable laundry products for hand washing, and lingerie wash bags for
machine washing.
• A smaller brand trains its customer care team to suggest repair techniques to customers contacting
them regarding product defects that are easily repairable (e.g., loose button, open seam, etc.). Since
the company is not yet able to offer in-house repair services, the customer is offered compensation
(e.g., partial refund, gift card towards future purchase etc.) to help encourage them to facilitate repair.
The company reports that, to date, customers have been very receptive to this and the service has
greatly reduced the number of replacements being issued.
Photo: EILEEN FISHER (Renew)
36 ••Textile Exchange © 2020 Contents Material Change Insights Report•• 37You can also read