www.episcopalchurch.org/racial-justice-audit - The Episcopal ...
←
→
Page content transcription
If your browser does not render page correctly, please read the page content below
www.episcopalchurch.org/racial-justice-audit

RACIAL JUSTICE AUDIT
of Episcopal Leadership   1

To those who have lost their lives to the violence of racism;

                          to those who have given their lives to justice;

                      and in memory of Diane D’Souza (1960-2020),
                        founding Director of The Mission Institute.

RACIAL JUSTICE AUDIT
of Episcopal Leadership                                                       2
O God of unchangeable power and eternal light: Look favorably on your whole Church, that wonderful
          and sacred mystery; by the effectual working of your providence, carry out in tranquility the plan of
          salvation; let the whole world see and know that things which were cast down are being raised up, and
          things which had grown old are being made new, and that all things are being brought to their
          perfection by him through whom all things were made, your Son Jesus Christ our Lord; who lives and
          reigns with you, in the unity of the Holy Spirit, one God, for ever and ever. Amen.1

Dear Sibling in Christ,
Thank you for choosing to read this report.
This work is not ours alone. We rest on the efforts of countless saints on Earth who, for the sake of their
love of God and of God’s Church, have worked tirelessly to advance the cause of racial justice in their
lifetimes. We rest on the efforts of all those who have known that the church is not immune to the racism in
our world, and that it stings even deeper in this community of God, where all are called to be known and
loved. We rest on the efforts of the abundance of lay persons, clergy people, theologians, scholars, activists,
seekers, students, and others who have asked questions, looked to the margins, and sought to manifest Love
more fully within this community.
To them, and to all others on whose labor our work rests, we extend a profound offering of gratitude.
In these pages you will find the culmination of nearly two years of research. This report is not an academic
paper or a scientific study, but rather an attempt at conveying some of the multitudes of truths that exist in
the Church. It is also an exercise in narrative recording. Christianity was born into a tradition of storytelling,
passed down through generations. We participate in that tradition in these pages, conveying and interpreting
the words and stories of over 1,300 Church leaders. It is an enormous privilege to be bestowed with this
responsibility.
We hold an abiding belief that we are called to know not only with our minds, but also with our bodies and
hearts. We invite you to step into your full being, knowing that God has bestowed each of us with wide and
deep intelligences. You might take a few moments in grounding practice, or simply lift your head from these
pages and take a few deep breaths, slowly and intentionally.
This report is not a destination, but rather a stepping stone on the path towards Beloved Community. Ours is
the opportunity and the responsibility to be co-creators of that realm of Love, in which things that were cast
down are being raised up, and things which had grown old are being made new, and...all things are being
brought to their perfection. May God bless you greatly on this journey.
In God’s abundant blessing,
Luke Abdow, Donna Bivens, Rev. Katie Ernst, Rev. Dr. Elizabeth Magill, and Rev. Ema Rosero-Nordalm
The Mission Institute

1   https://episcopalchurch.org/files/book-of-common-prayer-2006_0.pdf

RACIAL JUSTICE AUDIT
of Episcopal Leadership                                                                                              3
TABLE OF CONTENTS
Background 6
Process and Methodology 7
Theological Reflection 10
Historical Context of this Racial Justice Audit 12
Beloved Community: Who Are We? 14
Response Rate 14
Overarching Demographics 14
Definition of Race 23
Definition of Racism 23
Experiencing Discrimination 24
Witnessing Discrimination 26
A few snapshots from particular leadership bodies: 27
House of Bishops 27
The Episcopal Church Staff 28
House of Deputies 28
Executive Council 28
Narrative Interviews Demographics 30
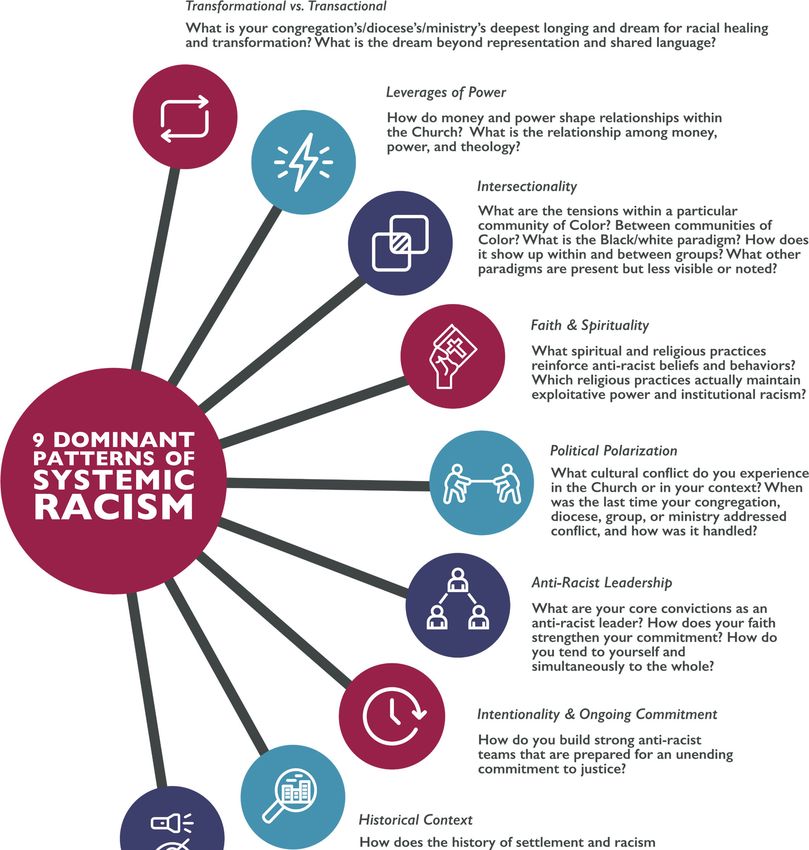
Dominant Patterns: Frameworks & Theories 31
Nine Dominant Patterns of Systemic Racism 33
Dichotomy of Racism: Hyper-Visibility vs. Invisibility 33
Quotes 34
Reflection 35
Leverages of Power & Impact on Anti-Racism Work 36
Quotes 36
Reflection 37
Anti-Racism Work as Transformational vs. Transactional 39
Quotes 39
Reflection 41
Faith & Spirituality & Anti-Racism 42
Quotes 42
Reflection 43
Anti-Racism Work, Intentionality & Ongoing Commitment 44
RACIAL JUSTICE AUDIT
of Episcopal Leadership 4
Quotes                                                             44
        Reflection                                                         45
      Intersectionality within & Outside of People of Color Spaces         46
        Quotes                                                             46
        Reflection                                                         47
      Racism Rooted in Historical Context                                  48
        Quotes                                                             48
        Reflection                                                         49
      Political Polarization of Racial Justice                             50
        Quotes                                                             50
        Reflection                                                         50
      Anti-Racist Leadership                                               52
        Quotes                                                             52
        Reflection                                                         53
    Where Do We Go From Here?                                              54
    Nine Dominant Patterns & Living into the Questions                     55
    Recommendations for The Episcopal Church                               55
    Addenda                                                                57
      Addendum A: Tensions                                                 57
        Capitalization                                                     57
        Black, Indigenous, and People of Color vs. People of Color         57
      Addendum B: Challenges and Limitations of the Racial Justice Audit   58
      Addendum C: The Voices Continue                                      60
      Addendum D: Glossary of Terms                                        70

RACIAL JUSTICE AUDIT
of Episcopal Leadership                                                         5
BACKGROUND
The work of racial justice in The Episcopal Church is not new to this triennium or the previous, nor to the
Church's current leadership. Please see the Historical Context of this Racial Audit section for a fuller account
of the history of the movement towards racial justice in The Episcopal Church.

This racial audit was born out of General Convention 2015 Resolution A182: Address Systemic Racial
Injustice. In this Resolution, the 78th General Convention urged, “the Executive Council to conduct its own
internal audit to assess to what extent, if at all, racial disparities and systemic racial injustices exist within the
Church.”2

Also in 2015, the General Convention passed Resolution C019: Work for Racial Justice and Reconciliation. In
this Resolution, the Convention requested that, “the Joint Standing Committee on Program, Budget and
Finance consider a budget allocation of $1.2 million for the Triennium for the implementation of this
resolution.”3 It also charged Presiding Bishop Michael Curry and House of Deputies President Gay Clark
Jennings with leading the Church in this critical work.

Working with these two resolutions, church leadership and a host of partners birthed “Becoming Beloved
Community: The Episcopal Church’s Long-Term Commitment to Racial Healing, Reconciliation, and Justice”
(BBC). This vision document and related resources invited Episcopalians to approach the lifelong journey of
racial healing as if walking a labyrinth that moves through four quadrants: Telling the Truth about the Church
and Race, Proclaiming the Dream of Beloved Community, Practicing Jesus's Way of Healing Love, and
Repairing the Breach in Society and Institutions.4

In 2018 the Mission Institute was contracted by the offices of the Presiding Bishop and President of the House
of Deputies to complete a racial audit of Episcopal Church leadership. This audit is a response to the first
discipline of Becoming Beloved Community: Telling the Truth about the Church and Race. Episcopal
leadership first approached the Mission Institute about this project because of similar racial audit and research
work previously conducted in the Diocese of Massachusetts.

Thus, the research completed and the subsequent report have focused on exposing truths within the Church.
The central questions have been, who comprises the leadership of The Episcopal Church, and what is their
experience of race and racism in their leadership roles?

2
  https://episcopalarchives.org/cgi-bin/acts/acts_resolution.pl?resolution=2015-A182
3
  https://www.episcopalarchives.org/cgi-bin/acts/acts_resolution-complete.pl?resolution=2015-C019. A total of $2 million was
ultimately allocated and later spread across two triennia.
4
  https://episcopalchurch.org/files/becoming_beloved_community_summary_0.pdf

RACIAL JUSTICE AUDIT
of Episcopal Leadership                                                                                                        6

PROCESS AND METHODOLOGY
The goal of this research has not been to determine whether or not systemic racism exists in The Episcopal
Church, but rather to examine its effects and the dynamics by which it is maintained in the Church structure.
It was critical to approach this objective with openness, rather than starting with pre-existing assumptions and
conclusions. To this end, we have employed the guiding tools of grounded theory5 and the theoretical
framework of critical race theory6.

This racial audit has attempted to magnify the voices of People of Color7 (POC) in the Church, while also
maintaining a spotlight on the systems and structures created and maintained by the white dominant culture89.

This research is situated in a particular moment in the history of the Church, and in the sociopolitical realities
of the world. It attempts to offer a snapshot of the truth of race and racism in The Episcopal Church from
2018 to 2020. Any claims made in these pages come with an understanding that, as our communities and
institutions change and evolve, so must our tactics in the pursuit of justice and liberation.

While statistics are important to this research and speak to some truth about the state of the Church, they do
not tell the entire story. In particular, statistics can work to mask People of Color's experience, by
transforming human reality into a set of numbers that privileges majorities and averages. The researchers
maintained a commitment in their methodology to looking towards the margins and hearing stories. This is
motivated in part by a biblically grounded belief in the power and truth of storytelling, and its importance in
the process of telling the truth about the Church and race.

The audit was conducted in two sections: a survey tool, to collect both quantitative and qualitative data, and a
series of interviews, to collect additional qualitative data. These two distinct data collection tools were used
with different leadership bodies of The Episcopal Church: the House of Bishops, the House of Deputies, the
Executive Council, staff of the Episcopal Church Center, and leaders from a sampling of dioceses from across
the denomination, including several in Latin America.

The surveys were designed by a multi-racial team and were offered in both Spanish and English. The surveys
were designed by the Mission Institute, and then edited in consultation with The Episcopal Church's Racial
Reconciliation staff team and with leaders in each of the bodies to be surveyed, primarily for matters that
concerned the ecclesial authority and particularities of each body. The surveys were released to the
appropriate bodies successively by the Racial Reconciliation staff team, with an invitation letter from either or

5
  For more information on grounded theory, see Glaser, Barney G., and Anselm L. Strauss. 1967. The Discovery of Grounded Theory:
Strategies for Qualitative Research.
6
  In short, critical race theory is a social and theoretical framework that understands race as a lens through which to seek
understanding of the world. It insists, like critical theory at large, that social problems are created by structures and institutions,
rather than by individuals. Numerous scholars have contributed to the work of critical race theory, including Derrick Bell, Kimberle
Williams Crenshaw, Richard Delgado, and others.
7
  The phrase People of Color was intentionally chosen to describe a group of diverse people who do not identify as white. There
was considerable conversation by the researchers on whether People of Color or Black, Indigenous, and People of Color (BIPOC)
should be used. Please see the Tensions and Glossary of Terms sections for more reasoning.
8
  Refer to the Tensions section to explore why the researchers chose to not capitalize white and to capitalize Black and People of
Color.
9
  Throughout this report, the terms “white dominant culture”, “white dominating culture”, and “white supremacy culture” are used
interchangeably. We have chosen to favor white dominant/dominating culture to more accurately try to describe what is taking
place: an active dominating of other peoples and cultures. Whichever phrase is used is trying to convene the same principle. Please
see the Glossary of Terms for a definition.

RACIAL JUSTICE AUDIT
of Episcopal Leadership                                                                                                                   7

both the Presiding Bishop and President of the House of Deputies, depending on the particular leadership
body.

Regarding the representative sampling of dioceses, three dioceses in each of the Church's nine provinces were
initially invited. The dioceses were selected in close consultation with the Church Pension Group, giving
careful attention to a range of factors, including diocesan size, geographic location, socioeconomic
environment, urban and rural contexts, and more. Within each diocese, surveys were sent to members of the
diocesan staff, Diocesan Council, Trustees, Commission on Ministry, Standing Committee, or the equivalent
bodies. After some adjustment due to participation rates, the following group of dioceses actually participated
in the survey and interview process:

 Arizona                                                             Minnesota
 California                                                          Mississippi
 Central New York                                                    North Carolina
 Colombia                                                            Northern Michigan
 Colorado                                                            Northwest Pennsylvania
 Connecticut                                                         San Joaquin
 Convocation of Churches in Europe (volunteered)                     South Dakota
 Honduras                                                            Southeast Florida
 Indianapolis                                                        Southern Virginia
 Kansas                                                              Spokane
 Long Island                                                         Texas
 Los Angeles                                                         Vermont
 Maryland                                                            Western Massachusetts
 Milwaukee                                                           Western New York

Across the previously named churchwide leadership bodies and also in the above dioceses, the survey was
sent to nearly 3,000 people. In total, 1,326 individuals completed the survey, yielding a response rate of 45%.10

The survey addresses a variety of demographic categories, including race, age, order of ministry, gender,
sexual orientation, socioeconomic class background, current socioeconomic class, education, and ability.
These data provide important insight into the makeup of Church leadership. The survey also asked a number
of questions about experience with racism and other forms of discrimination, both personally and as a witness.

Upon completion of the survey, participants were invited to express their willingness to participate in an
interview with a team from the Mission Institute. This self-selection was digitally separate from the survey
itself, thus maintaining the anonymity of survey respondents. Before the COVID-19 pandemic, interview teams
from the Mission Institute traveled to gatherings of three of the five leadership bodies researched: the meeting
of the House of Bishops in Minneapolis on September 2019, the meeting of the Executive Council in
Montgomery, Alabama, in October 2019, and The Episcopal Church offices in New York City in December
2019. After the start of the COVID-19 pandemic in March 2020, interviews were transferred to Zoom, and
conducted by a two-person team from the Mission Institute. The diocesan leadership interviews were
conducted on Zoom. Interviews with members of the House of Deputies were also taken from research of a
similar nature previously conducted by the Mission Institute at the meeting of the General Convention in
2018. This decision was made in consultation with the Church's Racial Reconciliation staff.

10
     See “Beloved Community, Who Are We?” for a more detailed breakdown of response rates by leadership body.

RACIAL JUSTICE AUDIT
of Episcopal Leadership                                                                                         8
When self-selecting to be interviewed, participants only shared their name, location, and whether or not they
identified as a Person of Color. More people self-selected to be interviewed than were able to be interviewed.
In selecting interviewees, the Mission Institute placed an emphasis on maintaining racial diversity.
Interviews were intended to surface stories and patterns about race and racism across the Church, as well as
difficult or surprising truths. Interviews lasted for 45-60 minutes. Relying on grounded theory, the interviews
posed open-ended questions. The researchers’ goal was not to impose their own understandings of systemic
racism, but to listen deeply and get a sense of how each individual understands racism and its meaning for the
Church. They invited participants to reflect upon how they understood and defined racism, and where they
saw it playing a role within their Church leadership context.
Aspects of grounded theory, community-based participatory research practices, and complex adaptive systems
theory supported the analysis of the collected data. Foundational theological statements of The Episcopal
Church, such as the Baptismal Covenant and the Catechism, also helped to guide the analysis. The initial raw
data collected by the survey tool were presented to a group of colleagues from across The Episcopal Church;
the insights and discussions informed the analytical directions of the research team. Certain stratifications of
the data proved particularly useful and insightful, including stratifying by race, order of ministry, and leadership
body.
The Mission Institute team used the tool of adaptive action11 to see and understand data from the interviews
and the write-in, descriptive sections of the survey. This included going through the qualitative data, paying
attention to what showed up most often, rather than what was interesting to the researchers. Over 50
patterns emerged, and these were narrowed to a group of nine of the most frequent and dominant patterns.
The team proceeded to ask certain questions about the patterns:
How do these patterns show up?
Why might these patterns exist?
What do the patterns reveal about who has access to key decision-making and power and who
does not?
Where might previous patterns possibly be changing?
What claims might we make about the church in response to these data?
What questions are we left with?
What are the theological implications of these data?
To come to a deeper understanding of what was emerging, a number of resources and conceptual frameworks
proved useful. Please see the Dominant Patterns: Frameworks and Theories section for further details.
11
For more information on adaptive action, see https://www.hsdinstitute.org/resources/adaptive-action.html
RACIAL JUSTICE AUDIT
of Episcopal Leadership 9THEOLOGICAL REFLECTION
Hope is forged out of the biblical call to dig deep into our innards to tell the truth of what we
see, feel, hear, and experience. And it reminds us that we must always show up in the face of
relentless evil, particularly in such times when it appears so normal and natural in our midst.12
We are not alone. We do not come to this place out of nowhere. We have our ancestors, our traditions, our
stories, our rituals, our sacraments, our enfleshed God made known through Jesus, and we have our collective
hope. Theologically speaking, hope is complicated. Hope, especially in white dominant spaces, has been used
to soothe weary souls; it has been used to escape painful realities; it has been used as a promise to pacify truth
tellers and prophets. It has also been used as an agent of transformation, resilience, and the promise of God’s
faithfulness. The latter is the hope we seek to move from and lift up in the following pages.
Hope is paradoxical in nature. While we must hope, we are afraid to hope. Hope is full of
possibilities and yet brimming with dangers. Hope interrupts the mundane and the comfortable
while protesting prophetic fury. Hope is that which scares us and yet prepares us to confront
the atrocities of life.13
It is from this paradoxical place that we speak of hope. It is hope filled with tension. The women who followed
Jesus knew it well. With him, they experienced hope in the flesh - a hope that performed miracles, fed
thousands, healed the sick, and raised the dead. It was a hope rooted in the promises of God’s providence and
deliverance out of bondage and death. Hope enabled the women to watch and sit at the foot of our crucified
God, who was their child, their friend, and their family. Being with Jesus in his life, practicing a discipline of
hope,14 prepared them to stay near to the pain of suffering and death. It was this discipline and promise that
propelled them to the tomb, to tend and care for Jesus’ body. Once there, the women yet again witnessed the
promise that life conquers death, love casts out fear, and another reality is possible.
With their yearning cries of lament and hope and cries for freedom and redemption - they created a bridge
that extended back to the cries of Hagar and Hannah, to Deborah and Moses, to Job and John the Baptist. The
bridge propels forward to the cries of Mamie Till15, and mothers separated from their children at the U.S.-
Mexico border, to Malcolm X and Martin Luther King Jr., to Ida B. Wells and Verna Dozier. We hear the cries
and the hopes today in the voices of those who fill the street seeking justice and in the silence of the breaking
of the bread.
The same hope brings us, the Church, to this moment and this racial justice audit. Taking a cue from the
women who surrounded Jesus in his life, death, and resurrection, we turn and face the reality of injustice and
liberation in our midst. The women at the cross not only resided with Jesus in his pain, they also shone a light
on the tools of empire, evil, and sin that killed him. Likewise, the following pages lift up personal stories of
racial injustice and harm done and felt in the Church, and they also point us to the very system (practices,
behaviors, and values) that perpetuates harm and white supremacy. The women were rooted in love for Jesus,
the one with whom they had experienced power, miracles, dignity, and transformation. So too the stories you
will read speak of power, leadership, and joy even in the face of difficult truths.
12
Townes, E. M. (1970, January 01). "Lament and Hope: Defying This Hot Mess." Retrieved November 23, 2020, from
https://reflections.yale.edu/article/resistance-and-blessing-women-ministry-and-yds/lament-and-hope-defying-hot-mess.
13
Crawford, A. E. (2002). Hope in the holler: A womanist theology. Louisville, KY: Westminster John Knox Press.
14
An idea inspired by Prison-Industrial Complex abolitionist Mariame Kaba
15
Mother of Emmett Till, a Black teen lynched in 1955
RACIAL JUSTICE AUDIT
of Episcopal Leadership 10Hope empowers us to keep on keeping on, even in the face of disappointment. It gives us strength
and yet exposes us to vulnerability. Hope charges us to risk something for the sake of transformed
life for ourselves and our communities. Hope refuses to acquiesce to the status quo or powers
that be by answering life with life.16
Hope, known through Jesus, began when Mary felt her child, soon to be born out of wedlock, leap inside of
her. Hope began in the dirt-filled manger, amidst the animals, to a family on the run seeking refuge. Hope
continued to cry out through Jesus’s tears at the news of his friend's death. It was manifested in the
Syrophoenician women challenging Jesus and in Jesus changing his mind. Hope was made known with every
loving and truth-filled challenge of the empire and local religious officials. It poured out through Jesus’s lament
in Gethsemane as his disciples slept. Hope was manifested in the women at the cross and in Thomas’s doubt.
Hope is enfleshed in death not having the final word. Hope charges us to risk something for the sake of a
transformed life for ourselves and our communities.
It is our sincere longing that you will hear these stories from a place of paradoxical and tension-filled hope.
This report is hope in the flesh. Among these stories you will discover power and beauty. There is pain and
rage. There are examples of transformed systems and systems doing harm. Deep, abiding joy and love are
woven throughout. May our hope create a bridge that extends back into ancestral times and extends forward
into a transformed reality yet to be known, a beloved community we create together.
16
Crawford, 2002
RACIAL JUSTICE AUDIT
of Episcopal Leadership 11HISTORICAL CONTEXT OF THIS RACIAL JUSTICE AUDIT
Episcopalians of Color have been, in one way or another, fighting and demanding that the institution and white
leaders recognize their dignity and gifts since the establishment of The Episcopal Church. However, the first
formal resolution brought to the Convention floor instructing the Church to look into internal issues of racial
justice occurred in 1958, asking Episcopalians to “work actively to eliminate racial discrimination in the life of
our Church….”17 Since then many pastoral letters, various trainings, and resolutions have been published,
funded, and voted on. As a result, leaders have engaged a host of actions, including designing anti-racist
programs, exploring and implementing policies that prioritize the hire and appointment of People of Color,
and speaking honestly about how Native American communities, Black communities, and Asian communities
experience racism.
In 1991 a racism audit was conducted of nearly 1,500 bishops, deputies, Episcopal Church Women delegates,
and visitors. The audit concluded that a clear pattern of institutional racism existed at every level of the
Church.18 This realization led the Presiding Bishop at the time to request that all resolutions on racism be
prioritized, resulting in the following resolutions:
● 1991-A085 Instruct Interim Bodies to Examine Effects of Forms of Discrimination
● 1991-D113 Address Institutional Church Racism in the Next Three Triennia
● 1991-A199 Urge Each Diocese to Conduct an Audit on Institutional Racism
● 1991-D043 Urge Dioceses to Commit to Ending Racism
● 1991-A082 Require Racial and Ethnic Representation on Interim Bodies
● 1991-A090 Reduce Discrimination in Clergy Deployment
● 1991-B051 Call for the Removal of Racism from the Life of the Nation
A pastoral letter declaring racism a sin was sent out by the House of Bishops in 1994. In response a new
covenant addressing racism was adopted by the 1994 Convention. Even with all this momentum, these
initiatives were not implemented churchwide, resulting in a rather dispirited recommitment in 1997. The 2000
General Convention renewed a commitment to addressing racism for another triennium. In 2006 the
Executive Council was tasked to develop study material, resulting in the Seeing the Face of God in Each Other
manual. Dioceses were encouraged to look at the legacy of the Doctrine of Discovery and the ways The
Episcopal Church and its many institutions benefited from slavery. By 2009 churchwide efforts to address
racism stalled, in part because of budget and staff cuts that made it difficult to sustain the program.
Recommitment to training and the effects of racism was affirmed in 2012.
Between the General Conventions in 2015 and 2018, more than 25 Acts of Convention addressed various
forms of racism and engagement in anti-racism work. These covered areas like police violence, incarceration,
youth curricula, reconciliation, internal audit, immigration, and environmental racism. As mentioned in the
Background section, our mandate to conduct this racial justice audit came from the 2015 Resolutions A182 and
C019. Situating the current racial justice audit in this context reveals a few patterns.
1. Mandates and resolutions addressing internal racism have been consistent for over 60 years.
2. Even though we have come far in addressing racism within the Church, we still have a long way to go.
3. Finally, our approach to addressing racism has overwhelmingly been one of education and eradication.
17
https://www.episcopalarchives.org/sites/default/files/anti-racism/anti-racism-training/ResRep_Anti-
RacismTraining_AEC03202015.pdf
18
Ibid.
RACIAL JUSTICE AUDIT
of Episcopal Leadership 12This last pattern is not bad in and of itself; however it is clear that white supremacy and racism are embedded in the history and DNA of The Episcopal Church. The history of engaging this work beckons us to engage going forward in a way that is systematic and non-linear, and in a way that moves beyond education and formation. Further exploration of next steps and recommendations are addressed in the Where Do We Go from Here section of the report. RACIAL JUSTICE AUDIT of Episcopal Leadership 13
BELOVED COMMUNITY: WHO ARE WE?
Below is a summary of the quantitative data collected in the survey. As you read this section, consider the
following questions:

    ➔   What stands out to you? What is important in these data?
    ➔   What questions does it leave you with?
    ➔   What patterns do you see?
    ➔   What are the implications of these data for racial justice work? For The Episcopal Church as a whole?

Response Rate
The overall response rate to the survey was 45%. The breakdown of the different leadership bodies was as
follows:
    ● House of Bishops had a 32% response rate
    ● House of Deputies had a 26% response rate
    ● Executive Council had a 78% response rate
    ● The Episcopal Church Center Staff had a 51% response rate
    ● Diocesan Leadership - which included members of Diocesan Staff, Standing Committees, Commissions
       on Ministry, Trustees, Diocesan Councils or the equivalent bodies in a total of 27 dioceses - had an
       average response rate of 60%

Overarching Demographics

Race
The survey respondents are predominantly white: 77% identify as white and 22% as People of Color (see
Figure 1).19 There is a vast racial diversity within leaders of Color who responded (see Figure 2). When asked
which racial identifies they hold, leaders of Color selected20:

    ● Latino/a/x, Hispanic American,                            Fig. 1: Total Respondents by Racial Category
      Mestizo or Afrodescendiente (37%)                                            n=1326
    ● Black (31%)
    ● U.S. African Descent (15%)                                                         0.3%
    ● Afro-Caribbean (12%)
    ● African Immigrant (4%)                                                                     22%
    ● Indigenous, Native American, or
      Alaskan Native (19%)
    ● East Asian or Asian American (9%)
    ● South Asian or Indian American (2%)
                                                                                   78%
    ● Hawaiian or Pacific Islander (1%)
    ● Middle Eastern or Arab American
      (3%)
    ● Euro-American or white (31%)
                                                                               POC       White         Other

19 Around 1% of respondents did not identify as either People of Color or white, thus the total does not add up to 100%.
20 Respondents were asked to select all choices with which they identify. The percentages will not add up to 100 because many
people selected multiple responses.

RACIAL JUSTICE AUDIT
of Episcopal Leadership                                                                                                         14
Therefore, leadership of Color is not a monolith; it holds complexity, particularity, and diversity within itself.
Fig. 2: Diversity of POC Leadership
n=296
5% 1%
3%
19% 2%
19%
9%
31% 13%
15% 32%
12%
4%
5%
Indigenous, Native American, or Alaskan Native Hawaiian or Pacific Islander
Middle Eastern or Arab American South Asian or Indian American
East Asian or Asian American Euro‐American
Latino/a/x, Hispanic American, or Mestizo Latino/a/x, Hispanic American, or Afrodescendiente
Afro‐Caribbean African immigrant
U.S. African Descent Black
White Not listed (please specify)
RACIAL JUSTICE AUDIT
of Episcopal Leadership 15Order of Ministry
Leadership is shared by lay persons and clergy. Some 49% of the leaders who took the survey identify as
members of the clergy (6% Deacon, 34% Priest, 9% Bishop) and 51% as laypeople. If you break this leadership
down by race, more white people are in seats of power and paid ministry, while People of Color are
somewhat over-represented in volunteer, less advantaged roles (see Figure 3).
➔ Breakdown by race overall:
◆ Lay: 24% People of Color // 76% white
◆ Deacon: 24% People of Color // 74% white
◆ Priest: 20% People of Color // 80% white
◆ Bishop: 16% People of Color // 84% white
Fig. 3: Order of Ministry of
Another trend is that - of the group that responded to the Church Leadership
survey – lay leaders of Color make up a higher proportion n=1315
of all leaders of Color (57%) than white lay leaders do of all
800
white leaders (51%). In other words, leadership of Color
skews towards lay leadership, whereas white leadership is 600
closer to an even distribution of leaders who are clergy and 400
laity. This might have implications, as ordained leadership 200
often has greater formal and informal power in the Church, 0
and usually includes financial compensation and greater Layperson Deacon Priest Bishop
agency.
POC White
RACIAL JUSTICE AUDIT
of Episcopal Leadership 16Age
The respondents are predominantly 56-70 year olds (45%), followed by those older than 71 (21%) and 41-55
year olds (21%). Ten percent of the leadership is between 26-40 years of age. Around 1% of leadership who
responded to the survey falls below the age of 25 (see Figure 4).
➔ Breakdown by race:
◆ 25 and under: 27% People of Color // 73% white
◆ 26-40: 27% People of Color // 72% white
◆ 41-55: 29% People of Color // 71% white
◆ 56-70: 20% People of Color // 80% white
◆ 71+: 18% People of Color // 82% white
Furthermore, we see that leadership of Color skews younger, with 48% of leaders of Color being under 55, as
compared to 31% of white leaders.
Fig. 4: Age of Church Leadership
n=1322
700
600
500
400
300
200
100
0
25 or under 26‐40 41‐55 56‐70 71+
POC White
RACIAL JUSTICE AUDIT
of Episcopal Leadership 17Gender
The leaders who responded lean slightly heavily towards female at 54%, with 46% identifying as male. Only
.76% identify as transgender, non-binary, or genderqueer. When looking at the breakdown by race, the
difference remains relatively static (see Figure 5).
➔ People of Color:
◆ 55% female
◆ 45% male
➔ White:
◆ 53% female
◆ 46% male
◆ 1% trans, non-binary, genderqueer
When looking at the individual breakdown of gender representation by leadership bodies, some statistics
stand out. Executive Council and Episcopal Church Center staff appear to have a higher percentage of female
members. The House of Bishops stands out, as only 20% of respondents are female, which is 33% less than the
average across total surveyed leadership. Therefore, even though females represent a majority in most
leadership bodies, they are drastically underrepresented in the House of Bishops.
➔ Breakdown by leadership body:
◆ Dioceses: 56% female // 43% // .79% transgender/nonbinary/genderqueer
◆ Executive Council: 62% female // 39% male // 0% transgender/nonbinary/genderqueer
◆ Episcopal Church Center staff: 62% female // 33% male // 3%
transgender/nonbinary/genderqueer
◆ House of Deputies: 52% female // 47% male // .44% transgender/nonbinary/genderqueer
◆ House of Bishops: 20% female // 79% male // 0% transgender/nonbinary/genderqueer
When looking at gender breakdown between lay and ordained leadership, males make up a higher percentage
of ordained leaders, with 10% more ordained males than ordained females. Lay leadership has a higher
percentage of females than males; lay females make up a 25% larger share of the total surveyed leadership. It
appears that gender representation skews more male as one moves into traditional places of power, financial
resources, and agency (ordained ministry overall and particularly bishops).
➔ Breakdown between lay and
Fig. 5: Gender of Church Leadership ordained:
n=1312 ◆ Lay: 62% female // 37% male // 1%
transgender/nonbinary/genderqueer
800 ◆ Ordained: 45% female // 55% male //
.48% transgender/nonbinary/genderqueer
600
400
200
0
Female Male Transgender / Non‐
binary / Genderqueer
POC White
RACIAL JUSTICE AUDIT
of Episcopal Leadership 18Sexual Orientation
Overall, the leadership bodies of The Episcopal Church are predominately straight, with 87% of respondents
identifying as straight/heterosexual and 13% identifying as LGBTQ (lesbian, gay, bisexual, transgender and
queer). There is a slight increase of straight/heterosexual representation in leadership of Color, with 89%
identifying as straight and 11% identifying as LGBTQ.
➔ Breakdown by race:
◆ Lesbian/Gay/Homosexual/Bisexual/Queer (13% of total): 18% People of Color // 82% white
◆ Straight/Heterosexual (87%): 23% People of Color // 77% white
RACIAL JUSTICE AUDIT
of Episcopal Leadership 19Level of Education
Of Episcopal Church leaders who responded to the survey, 69% have a master’s or doctoral degree and 22%
have bachelor’s degrees. When looking at the breakdown by race, we see that 57% of leaders who are People
of Color have master’s or doctoral degrees compared to 73% of white leadership.
➔ Breakdown by race:
◆ High school diploma or equivalent (1% of total): 33% People of Color // 67% white
◆ Trade/technical/vocational training (1%): 40% People of Color // 60% white
◆ Some college (5%): 31% People of Color // 69% white
◆ Associate’s degree (2%): 36% People of Color // 64% white
◆ Bachelor’s degree (22%): 30% People of Color // 70% white
◆ Master’s degree (52%): 19% People of Color // 80% white
◆ Doctorate (18%): 16% People of Color // 84% white
RACIAL JUSTICE AUDIT
of Episcopal Leadership 20Socioeconomic Class Background
Of Church leaders who responded to the survey, 63% self-identify as having grown up middle class. 82% of
those who grew up middle class are white and 18% are People of Color. Overall, only 4% of Church leaders
self-identified as having grown up in poverty. Leaders of Color makeup 62% percent and white people make
up 38% of those who identified as having grown up in poverty. There is a general downward trend of
representation of People of Color in higher socioeconomic classes (see Figure 6).
➔ Breakdown by race:
◆ Poverty level (4% of total): 62% People of Color // 38% white
◆ Working Class (24%): 31% People of Color // 69% white
◆ Middle Class (63%): 18% People of Color // 82% white
◆ Upper Class (9%): 7% People of Color // 92% white
Fig. 6: Socioeconomic Class Background of Church Leadership
n=1296
800
700
600
500
400
300
200
100
0
Poverty level Working class Middle class Upper class
POC White
RACIAL JUSTICE AUDIT
of Episcopal Leadership 21Current Socioeconomic Class
72% of The Episcopal Church leadership surveyed currently identifies as middle class, 9% more than identify as
having been raised middle class. There is a general trend overall and also within People of Color and white
people of upward mobility. However, there is a higher percentage of People of Color who are currently
working class, making up 43%, while 21% of People of Color identify in the middle class. In other words, 2 of
10 survey respondents who identify currently in the middle class are People of Color. Furthermore only 1 out
of 10 people who identify as upper class are People of Color.
When we look at socioeconomic class difference within racial groups, we see that the majority of People of
Color identify as middle class (71%). The same is true for white people, the majority of whom identify as
middle class (73%). Of leadership of Color, 21% place themselves in the working class compared to 7% of
white people. Further, 7% of leadership of Color place themselves in the upper class category, compared to
19% of white leaders. Therefore, it appears that white people skew towards higher socioeconomic class
categories and People of Color skew towards lower socioeconomic class categories (see Figure 7).
➔ Breakdown by race
◆ Poverty Level (.62% of total): 37.5% People of Color // 62% white
◆ Working Class (10%): 43.7% People of Color // 56% white
◆ Middle Class (73%): 21.05% People of Color // 79% white
◆ Upper Class (16%): 9.62% People of Color // 90% white
Fig. 7: Current Socioeconomic Class of Church Leadership
n=1284
800
700
600
500
400
300
200
100
0
Poverty level Working class Middle class Upper class
POC White
RACIAL JUSTICE AUDIT
of Episcopal Leadership 22Immigration and Family History Of leaders of Color who responded to the survey, 34% were not born in the US, representing 58% of total leadership born outside of the US. Also amongst leaders of Color, 60% were born in the US, representing 16% of total leadership born in the US. These data demonstrate that a high proportion of leaders born outside of the US are People of Color. Simultaneously, leaders of Color born in the US represent a small proportion of total leaders born in the US, when compared to the proportion of leaders of Color overall. It is important to note here that The Episcopal Church is an international denomination, and leaders were surveyed from across all nine Provinces, including some dioceses located outside of the US. Of respondents who live in dioceses outside of the US, 62% are People of Color. Of those who immigrated to the US during their lifetime, 66% are People of Color. In total, 28% of leaders of Color surveyed either do not live in the US or immigrated to the US after birth (14% do not live in the US, and 15% immigrated after birth). This is compared with 5% of white leaders who either do not live in the US or immigrated to the US after birth. Overall among leaders of Color, 60% were born in the US. Among white leaders, 92% were born in the US. The data show that People of Color in Episcopal leadership are a diverse group both racially and geographically. The high percentage of leaders of Color who live outside the US or are immigrants to the US is significant, as the Church charts the path forward towards Beloved Community. Definition of Race Within Episcopal leadership, 41% of respondents define race as a combination of biology/genetics, physical characteristics, human made categories of people, and ethnicity or culture. Amongst the overall leadership, 20% define race solely as biology/genetics. Similarly, 21% define race solely as a human made category. Notably, a higher percentage of white people (24%) define race as a human-made category, as compared to only 12% of People of Color who define it that way. Definition of Racism Overall, 77% of The Episcopal Church leadership surveyed define racism as a combination of racial prejudice or discrimination, a system that grants power to one social group, and racialized violence or hatred. The vast majority of Episcopal leadership appears to share the same definition of racism. This is crucial and shows that leadership can clearly define the complexity of racism both systemically and interpersonally. Often a foundational barrier to the work of anti-racism is the basic differences of understanding/defining racism. This shows that, at least intellectually, Church leaders have a similar understanding of racism. RACIAL JUSTICE AUDIT of Episcopal Leadership 23
Experiencing Discrimination

To what extent have you experienced the following things in your time as a Church leader?
(all respondents)

                                                                    Not at all    Occasionally   Frequently
 You were treated with less courtesy or respect than other Church
                                                                    778 // 62%     434 // 34%      49 // 4%
 leaders.
 You did not feel supported in your ministry and leadership.        809 // 64%     381 // 30%      68 // 5%
 You received feedback on how you speak, dress, or interact with
                                                                    954 // 76%     272 // 22%      35 // 3%
 people.
 People acted as if they thought you were not smart.                 962 // 77%    263 // 21%      32 // 3%
 People acted as if they were afraid of you.                        1044 // 83%    198 // 16%      17 // 1%
 People acted as if they thought you were dishonest.                1147 // 91%    100 // 8%       12 // 1%
 People did not have knowledge about or were not curious about
                                                                    805 // 64%     351 // 28%      97 // 8%
 your culture and context.
 You were called names or insulted.                                 1140 // 91%    100 // 8%       17 // 1%
 You were intimidated, harassed, or suppressed.                     1078 // 86%    151 // 12%      25 // 2%
 People acted as if you knew less about finances.                    979 // 78%    228 // 18%      46 // 4%

To what extent have you experienced the following things in your time as a Church leader?
(People of Color only)

                                                                    Not at all    Occasionally   Frequently
 You were treated with less courtesy or respect than other
                                                                    166 // 60%      98 // 36%      12 // 4%
 Church leaders.
 You did not feel supported in your ministry and leadership.        175 // 64%      76 // 28%      21 // 8%
 You received feedback on how you speak, dress, or interact with
                                                                    196 // 71%      70 // 25%      9 // 3%
 people.
 People acted as if they thought you were not smart.                193 // 71%      67 // 25%      11 // 4%
 People acted as if they were afraid of you.                        225 // 82%      43 // 16%       6 // 2%
 People acted as if they thought you were dishonest.                237 // 87%      29 // 11%      7 // 3%
 People did not have knowledge about or were not curious about
                                                                    120 // 44%     113 // 42%     39 // 14%
 your culture and context.
 You were called names or insulted.                                 245 // 90%      23 // 8%       4 // 1%
 You were intimidated, harassed, or suppressed.                     228 // 84%      36 // 13%       7 // 3%
 People acted as if you knew less about finances.                   197 // 73%      59 // 22%      15 // 6%

RACIAL JUSTICE AUDIT
of Episcopal Leadership                                                                                       24
To what extent have you experienced the following things in your time as a Church leader?
(white people only)
Not at all Occasionally Frequently
You were treated with less courtesy or respect than other
626 // 64% 319 // 33% 36 // 4%
Church leaders.
You did not feel supported in your ministry and leadership. 649 // 66% 288 // 29% 45 // 5%
You received feedback on how you speak, dress, or interact with
761 // 77% 195 // 20% 26 // 3%
people.
People acted as if they thought you were not smart. 779 // 79% 182 // 19% 21 // 2%
People acted as if they were afraid of you. 817 // 83% 154 // 16% 10 // 1%
People acted as if they thought you were dishonest. 911 // 93% 66 // 7% 5 // 1%
People did not have knowledge about or were not curious about
692 // 71% 231 // 24% 54 // 6%
your culture and context.
You were called names or insulted. 898 // 92% 71 // 7% 11 // 1%
You were intimidated, harassed, or suppressed. 855 // 87% 107 // 11% 17 // 2%
People acted as if you knew less about finances. 782 // 80% 167 // 17% 29 // 3%
Some highlights:
➔ Overall, 43% of leaders of Color cite race, ethnicity, or national origin as the main reason for their
experience. This is compared with white leaders who attribute their experience primarily to gender or
sex (30%) or age (12%) but less so their race (11%).
➔ Even though white people do not generally attribute these experiences to race or ethnicity, it is worth
exploring the frequency at which white people experience discrimination. This context of occasional
and frequent discrimination is important in considering how the white dominant culture of the
Church sets norms, enforces behavior, and maintains power structures.
➔ Compared to white leaders, leaders of Color are twice as likely to frequently experience the following:
people treating them as if they weren’t smart, people acting as if they are afraid of them, and people
acting as if they know less about finances.
➔ Leaders of Color are nearly three times as likely as white people to frequently experience people not
having knowledge or curiosity about their culture.
RACIAL JUSTICE AUDIT
of Episcopal Leadership 25Witnessing Discrimination
To what extent have you witnessed the following things in your time as a Church leader?
(all respondents)
Not at all Occasionally Frequently
A Person of Color being treated with less courtesy or respect
892 // 72% 311 // 25% 36 // 3%
than other people.
A Person of Color receiving less support than other people in a
907 // 74% 275 // 22% 46 // 4%
similar role.
A Person of Color receiving feedback on how they speak, dress,
1036 // 84% 175 // 14% 21 // 2%
or interact with people.
People acting as if they think a Person of Color is not smart. 960 // 78% 245 // 20% 33 // 3%
People acting as if they are afraid of a Person of Color. 1024 // 83% 189 // 15% 16 // 1%
People acting as if they think a Person of Color is dishonest. 1105 // 90% 113 // 9% 10 // 1%
People not having knowledge about or not being curious about
655 // 53% 452 // 37% 127 // 10%
a Person of Color's different culture and context.
A Person of Color being called names or insulted. 1146 // 93% 74 // 6% 10 // 1%
A Person of Color being intimidated, harassed, or suppressed. 1065 // 87% 146 // 12% 17 // 1%
People acting as if a Person of Color knows less about finances. 1025 // 84% 172 // 14% 29 // 2%
To what extent have you witnessed the following things in your time as a Church leader?
(People of Color only)
Not at all Occasionally Frequently
A Person of Color being treated with less courtesy or respect
169 // 62% 86 // 32% 18 // 7%
than other people.
A Person of Color receiving less support than other people in a
168 // 62% 81 // 30% 21 // 8%
similar role.
A Person of Color receiving feedback on how they speak, dress,
206 // 76% 51 // 19% 13 // 5%
or interact with people.
People acting as if they think a Person of Color is not smart. 178 // 65% 79 // 29% 15 // 6%
People acting as if they are afraid of a Person of Color. 203 // 76% 56 // 21% 8 // 3%
People acting as if they think a Person of Color is dishonest. 215 // 81% 45 // 17% 6 // 2%
People not having knowledge about or not being curious about
135 // 50% 99 // 37% 36 // 13%
a Person of Color's different culture and context.
A Person of Color being called names or insulted. 236 // 87% 26 // 10% 8 // 3%
A Person of Color being intimidated, harassed, or suppressed. 215 // 80% 44 // 16% 10 // 4%
People acting as if a Person of Color knows less about finances. 195 // 73% 59 // 22% 14 // 5%
RACIAL JUSTICE AUDIT
of Episcopal Leadership 26To what extent have you witnessed the following things in your time as a Church leader?
(white people only)
Not at all Occasionally Frequently
A Person of Color being treated with less courtesy or respect
721 // 75% 224 // 23% 17 // 2%
than other people.
A Person of Color receiving less support than other people in a
737 // 77% 193 // 20% 24 // 3%
similar role.
A Person of Color receiving feedback on how they speak, dress,
828 // 86% 122 // 13% 8 // 1%
or interact with people.
People acting as if they think a Person of Color is not smart. 781 // 81% 164 // 17% 17 // 2%
People acting as if they are afraid of a Person of Color. 820 // 86% 131 // 14% 7 // 1%
People acting as if they think a Person of Color is dishonest. 889 // 93% 65 // 7% 4 // 0.4%
People not having knowledge about or not being curious about
520 // 54% 351 // 37% 89 // 9%
a Person of Color's different culture and context.
A Person of Color being called names or insulted. 907 // 95% 47 // 5% 2 // 0.2%
A Person of Color being intimidated, harassed, or suppressed. 848 // 89% 101 // 11% 6 // 1%
People acting as if a Person of Color knows less about finances. 828 // 87% 112 // 12% 14 // 1%
There is a discrepancy between what white people witness and what People of Color experience. When
witnessing discrimination, white respondents name that ancestry, national origin, or race was the main reason
for the discrimination 48% of the time, while leaders of Color name it 51% of the time. But when we look at
rates of frequently and occasionally experiencing discrimination, People of Color consistently respond with
frequencies of discrimination that are higher than that which white people report to witness. The data would
suggest that acts of racism are going unnoticed by white people.
There is a general trend of both experiencing and witnessing people not having knowledge or curiosity about a
different culture or context, often at rates of 40% or higher. This would seem to indicate that we often fail in
relationships with one another. Engaging across difference and building relationships of mutuality and respect
are fundamental to the work of racial justice and healing, but we appear to lack them in our actual relations
with one another. This is notable considering that much of The Episcopal Church’s recent anti-racism
formation has focused on building relationships across differences and having difficult conversations.
A few snapshots from particular leadership bodies:
House of Bishops
➔ Of bishops surveyed in the House of Bishops, 16% are People of Color, all of whom are active
➔ Of the bishops of Color, 36% of them were not born in the US, which is much higher than the overall
rate of 13% of leaders born outside of the US, but it is consistent with the statistic of 34% of People of
Color across all respondents being born outside of the US.
➔ In general, white bishops have been serving for longer than bishops of Color:
◆ 72% of bishops of Color have been serving for ten years or less
◆ 29% of bishops of Color have been serving for more than ten years
◆ 59% of white bishops have been serving for ten years or less
◆ 41% of white bishops have been serving for more than ten years.
➔ During the process of becoming a bishop, navigating diocesan culture and structure proves particularly
difficult for People of Color. The survey asked respondents to identify whether they felt included,
neutral, or marginalized in this process. Of bishops of Color, 64% say that they felt either neutral or
RACIAL JUSTICE AUDIT
of Episcopal Leadership 27marginalized in this navigation, while only 36% said they felt included. Only 29% of white bishops said
they felt neutral or marginalized in this, while the rest report they felt included.
The Episcopal Church Staff
➔ 32% of The Episcopal Church staff surveyed are People of Color
➔ Among those surveyed, there is a higher rate of ordained staff members of Color than white staff. 33%
of staff of Color are ordained, as compared to 22% of white staff.
➔ Respondents were asked if they felt either included, neutral, or marginalized in the process of
becoming a member of the staff. There isn’t a significant difference in the experience of People of
Color and white staff persons; if anything, in certain experiences, white people report higher rates of
marginalization.
◆ White staff persons surveyed report higher rates of marginalization in the following
experiences:
● Finding the job posting
● Interview process
● Orientation and training
● Support from supervisor and other staff members
◆ People of Color surveyed report higher rates of marginalization in the following categories:
● Submitting job application
● Communication with hiring team
● Transition to new position
● Navigating the churchwide culture and structure
◆ While the report didn’t demonstrate great variation in the experience of outright
marginalization, we do see greater difference in reports of inclusion, with higher rates of white
people expressing feeling included in the process of being hired for The Episcopal Church staff.
House of Deputies
➔ 19% of deputies surveyed are People of Color21
➔ Of the deputies of Color who responded, 70% are laypeople and 30% are ordained. Of the white
deputies, 50% are lay people and 50% are clergy.
➔ Two experiences of discrimination stand out for deputies of Color
◆ People acted as if you were not as good as they are
● 45% of People of Color said “occasionally” or “frequently”
◆ People did not have knowledge or were not curious about your culture or context
● 68% of People of Color said “occasionally” or “frequently”
Executive Council
➔ 61% of Executive Council member of Color who responded said that they felt either “marginalized” or
“neutral” about the mentoring and support provided during the election process. 78% of white
members said that they felt “included”.
➔ It is interesting to note that when asked about forms of discrimination that they have witnessed against
People of Color, white respondents never chose “frequently”, whereas at least one (and up to three)
People of Color respondents chose “frequently” in all but one category. In that singular category - a
Council Member of Color being called names or insulted - two People of Color said they had
witnessed it "occasionally." All of the white respondents selected “not at all”.
21 The House of Deputies also maintains reports regarding the demographic makeup of its membership. We encourage further
analysis that takes these self-reported facts about this large leadership body into account.
RACIAL JUSTICE AUDIT
of Episcopal Leadership 28◆ Presuming that the Executive Council respondents have been at the same meetings and
gatherings of the Council, the data demonstrate a difference in perception and noticing of the
same occurrences of discriminatory behavior. This is consistent with the findings of the
disparities between People of Color experiencing discrimination and white people witnessing
discrimination in the overall leadership.
RACIAL JUSTICE AUDIT
of Episcopal Leadership 29NARRATIVE INTERVIEWS DEMOGRAPHICS
Total Interviews: Race:
64 narrative interviews across different leadership People of Color - 47 (73%)
bodies White - 16 (25%)
Breakdown by leadership bodies: Gender:
Dioceses - 25 (39%) Female - 27 (42%)
House of Deputies - 16 (25%) ● 19 People of Color (70%)
Executive Council - 5 (8%) ● 8 white (30%)
House of Bishops - 12 (19%) Male - 36 (56.25%)
The Episcopal Church Churchwide Staff - 6 (9%) ● 28 People of Color (78%)
● 8 white (22%)
RACIAL JUSTICE AUDIT
of Episcopal Leadership 30DOMINANT PATTERNS22: FRAMEWORKS & THEORIES As we engaged the dominant patterns, the following theories and frameworks accompanied our approach and are the foundation to our analysis. Baptismal Covenant and Catechism23 Racism is pervasive and fundamental to the context and location of those we interviewed and surveyed. Whether it showed up through anti-blackness, colonization, and/or xenophobia, racism was present, insidious, and sinful. Therefore, we look to the Baptismal Covenant as a foundational covenant that calls Episcopalians to treat all human beings with respect and dignity and to pursue peace and justice in the footsteps of Jesus. It also calls us to repent and turn back to God when (not if, but when) we sin. According to The Episcopal Church's Outline of the Faith (or Catechism), sin is seeking “our own will instead of the will of God, thus distorting our relationship with God, with other people, and with all creation.”24 Racism profoundly distorts our relationship with God, with others, and with all of Creation. This sin and distortion leads to oppression and loss of liberty, and it leaves all of us in need of redemption. Understanding racism as a sin means that racism is something that is inevitable and is embedded in our very structures, consciousness, and practices. Furthermore, if racism is a sin, we understand that it isn’t a matter of if but when we will fall short and enact behaviors and beliefs rooted in racism. We do not assume that we will never sin, for sin is part of the human condition. We are careful to walk gently and to do no harm, but we are only human and will ultimately fall short of our hopes and desires. It is then that we repent, turn back to God, and repair the harm done. Prophets have a special role in this dynamic, as they call us back to God and remind us of our collective need for redemption, the kind that sets us free from evil, sin, and death. White Dominating Culture or White Supremacy Culture25 Oftentimes what keeps harmful systems and behaviors in place are the hidden norms and standards that get passed off as normal, respectable, good, and just the way things are. These hidden norms are what make up white dominating culture. In anti-racism work, attention is often given to the harmful effects of these behaviors and beliefs. This is important, but if it is done without looking at the very behaviors and practices that dominate and harm, then the work will ultimately be less effective or not have a lasting effect. Therefore, we choose to enter anti-racism work through a lens that is keenly aware of how and where white dominating culture operates and sustains racism explicitly and more importantly implicitly. White dominating culture values some ways – ways that are more familiar and come more naturally to those from a white, Western tradition – of thinking, behaving, deciding, and knowing, while devaluing or rendering invisible other ways. And it does this without ever having to explicitly say so.26 Complex Adaptive Systems Racism is a complex adaptive system with multiple individual parts that affect the whole. On their own these parts can seem like individual “bad apples” but in fact they operate out of collective system of culture, practices, and behavior that is often chaotic and complex. Therefore, one’s approach to engaging racism requires a a complex and agile response with multiple approaches, influences, and pattern recognition. Once patterns are lifted up and recognized, particular attention is placed on making sense of these patterns, asking so what then moving on to what now, focus is put on areas of influence within the system. Complex adaptive 22 Refer back to the process section for how the researches arrived at these dominant patterns. 23 https://episcopalchurch.org/baptismal-covenant 24 https://www.bcponline.org/Misc/catechism.html 25 See the Glossary of Terms section for a definition of White Dominant/Supremacy Culture. 26 https://www.racialequitytools.org/resourcefiles/2_Gulati_AB3.pdf RACIAL JUSTICE AUDIT of Episcopal Leadership 31
You can also read