Impact Report 2020 - Tesla
←
→
Page content transcription
If your browser does not render page correctly, please read the page content below
Impact Report
2020

      1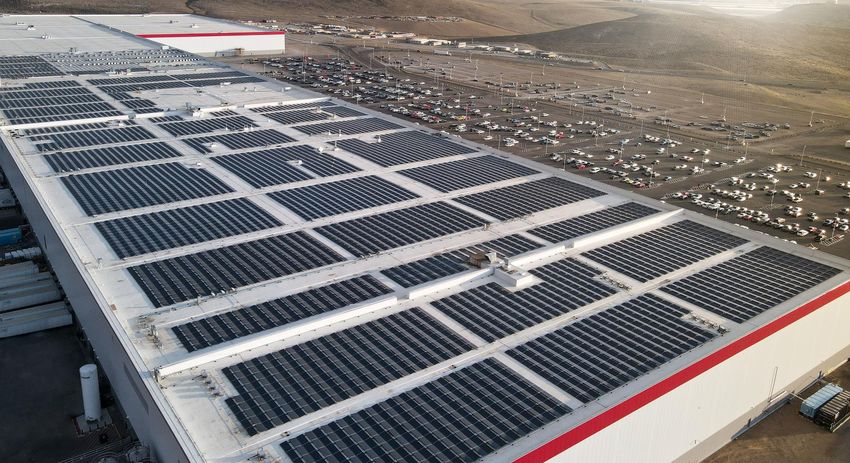
Introduction               The very purpose of Tesla’s existence is to accelerate the world’s transition
Focusing on What Matters   to sustainable energy.

                           The objective of an Environmental, Social and Governance (ESG) impact           affordability and accessibility of our products. All these themes will be
                           report is to disclose the impact a company has on those three areas, as well    covered in this year’s Impact Report.
                           as to present, to the extent possible, data and other information qualifying
                           and quantifying that impact.                                                    Tesla aspires to do the right thing, and we are constantly looking for ways
                                                                                                           to do better. If you have suggestions about how our company can improve
                           At Tesla, we strive to be the best on every metric relevant to our mission to   in any way, feel free to send your ideas to impactreport@tesla.com.
                           accelerate the world’s transition to sustainable energy. In order to maximize
                           our impact, we plan to continue increasing our production volumes and the       Finally, it is important to note that current ESG evaluation methodologies
                           accessibility of our products. In more concrete terms, this means that by       tend to use a generic template to analyze every manufacturing company’s
                           2030 we are aiming to sell 20 million electric vehicles per year (compared      carbon footprint. Vehicle use phase, which realistically accounts for 80-
                           to 0.5 million in 2020) as well as to deploy 1,500 GWh of energy storage        90% of total automotive emissions (included in Scope 3 of ESG reporting)
                           per year (compared to 3 GWh in 2020).                                           is repeatedly underreported. As use phase reporting guidelines remain
                                                                                                           vague, OEMs often use unrealistic assumptions for lifetime mileage and
                           If we were to achieve such a vehicle delivery milestone through a               unrealistic fuel consumption figures rather than real-world figures. As a
                           consistent growth rate, the total Tesla vehicle fleet would surpass tens of     result, it is not uncommon for the carbon footprint of the use phase to be
                           millions of vehicles by 2030 and each of those vehicles could save tons of      underreported by up to 50%.
                           CO2 from being emitted every year of usage.
                                                                                                           Our estimates in this report use real-world mileage and real-world energy
                           Furthermore, each product we make must be continuously improved at              consumption data sourced from our fleet of over one million cars on the
                           each step of its lifecycle: from manufacturing to consumer use to recycling.    road to calculate greenhouse gas (GHG) savings. We believe that reporting
                           We must also improve every metric, including the energy and water used to       use phase emissions based on real-world fleet data should become an ESG
                           make our products, how safe our customers and employees are and the             standard.

             2
Materiality Analysis   We conducted our first-ever materiality analysis, the results of which
                       identified key areas that our stakeholders said they cared about and are
                       reflected in the content of this year’s Impact Report.

                       To conduct the materiality analysis, we surveyed key stakeholders for Tesla,   Our stakeholders also want us to use industry best practices in a variety of
                       including Tesla’s Board of Directors, operational leadership, employees,       ways – from human rights, to mining and recycling, to vehicle capacity
                       suppliers, investors and customers, as well as state and local policymakers,   expansion and new factory construction.
                       to understand which ESG topics these groups find most relevant to our
                       business. Environmental impact is a front-and-center theme for                 Our discussions of each of these themes are listed in our Table of Contents
                       stakeholders, who are advocating for emissions reductions in both our          on the next page, and we dive into the details throughout this report. More
                       manufacturing processes and the charging of Tesla vehicles.                    information about our materiality survey can be found on page 84.

               3
Focusing on What Matters 02   Environmental Impact 10                                Supply Chain 44
                              Lifecycle Analysis of Tesla Vehicles vs. Average ICE   Responsible Material Sourcing
Materiality Analysis 03
                              NOx, Particulates and Other Pollutants                 Cobalt Sourcing
                              Tesla Semi
Measuring What Matters 06                                                            Battery Materials Sourcing
                              Battery Recycling
                              Waste Generated per Vehicle Manufactured               People and Culture 54
                              Water Used per Vehicle Manufactured
                                                                                     Our Response to COVID-19
                              Emissions Credits
                                                                                     Our Environmental, Health and Safety Strategy
                              Net Energy Impact of Our Products
                                                                                     Safety Improvements
                                                                                     Rewarding the Individual
                              Product Impact 32                                      Community Engagement
                                                                                     Culture of Diversity, Equity and Inclusion
                              Product Affordability (Price Equivalency)
                                                                                     Corporate Governance
                              Product Usage and Usability
                              Active Safety
                              Passive Safety
                              Tesla Safety Awards                                    Summary 81
                              Fire Safety
                              Cybersecurity
                                                                                     Appendix 84
                              Resilience of the Grid
In 2020, the global fleet of Tesla vehicles and solar panels

enabled our customers to avoid emitting

5.0 million metric tons of CO2e

The 3.5 million metric tons of vehicle CO2e savings estimate is based on the net CO2e savings during the use phase of a Tesla vehicle compared to an ICE vehicle with a real-world fuel
economy of ~25 mpg. The 1.5 million metric tons of solar CO2e savings estimate is based on CO2e avoided through generation of zero-emission electricity from Tesla solar panels.
Distribution of our deliveries
                      5        (both vehicle and solar), grid mix at the country, state and province level and upstream emissions are reflected in these figures.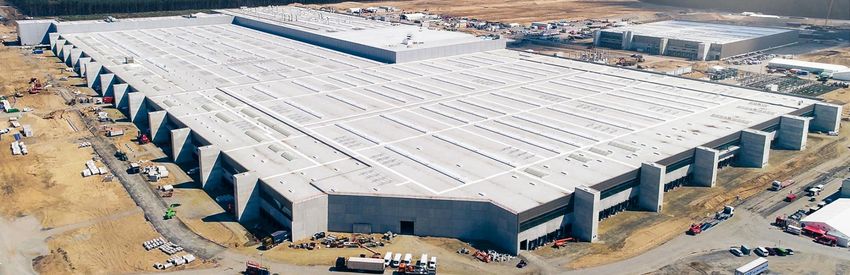
Measuring What Matters
Tesla vehicles’ all-in emissions per mile Capacity retention of Tesla vehicle batteries Our upcoming factories will set a new standard
are significantly lower than ICE vehicles’ averages ~90% after 200,000 miles of usage for low energy and water usage per vehicle
Average Lifecycle Emissions in U.S. (gCO2e/mi) Tesla Model S/X Battery Capacity Retention per Water Withdrawal Intensity in Vehicle Manufacturing
Distance Traveled (m3/vehicle)
500 100% 5
400 80% 4 Cell Manufacturing
300 60% 3
200 40% 2
100 20% 1
0 0% 0
Model 3 Model 3 Model 3 Model 3 Avg. Mid-Size 0 25 50 75 100 125 150 175 200 GF BMW GF Tesla FCA Industry VW Ford PSA GM Toyota Daimler
Ridesharing Use Personal Use Ridesharing Use Personal Use Premium ICE Berlin Texas (2020) Avg. Group (cars)
(est.)* (est.)*
(solar charged) (solar charged) (grid charged) (grid charged) Distance Traveled (thousands of miles)
Manufacturing Phase Use Phase Standard Deviation Retention
Global energy generation from Tesla-installed Commodities we use are sourced responsibly
We are a majority-minority company
solar panels far outpaces our total energy use and as locally as possible
Cumulative Energy Produced by Tesla Solar Panels vs Tesla 2020 Supply Chain List of Miners & Refiners for Purchased Cobalt Materials
Underrepresented Communities
25,000
Consumed by Tesla Factories Cobalt Miner & Refiner
Battery Supply Representation in our U.S. Workforce
Chain Sourced from RMI
Supplier
20,000 DRC Classification*
Yes Umicore Finland Oy (Finland) Conformant 20% 10% 24% 7% 32%
15,000 Murrin Murrin Nickel Cobalt Plant
No Conformant
(Australia) Additional
Gigafactory Asian Black Hispanic White
10,000 Nevada and No Norilsk Nickel Harjavalta Oy (Finland) Active Groups
Fremont
Harima Refinery, Sumitomo Metal
external cell No Conformant
Mining (Japan)
5,000 sourcing
Underrepresented Communities in Leadership
No Sumitomo Metal Mining (Japan) Active
Representation in our U.S. Workforce
0 Guandong Fangyuan Environment Co.
No Not Listed
Ltd. (China)
24% 4% 4% 1% 59%
-5,000 Yes Kamoto Copper Company (DRC) Conformant
Gigafactory
2012 2013 2014 2015 2016 2017 2018 2019 2020 Shanghai Guizhou CNGR Resource Recycling Additional
Yes Active
Industry Development Co., Ltd. (China) Asian Black Hispanic White
Groups
Energy Consumed (GWh; fossil)* Energy Consumed (GWh; clean)* Fremont in- Yes Kamoto Copper Company (DRC) Conformant
Energy Produced (GWh) house cell
Quzhou Huayou Cobalt New Material
production Yes Active
Co., Ltd. (China)
6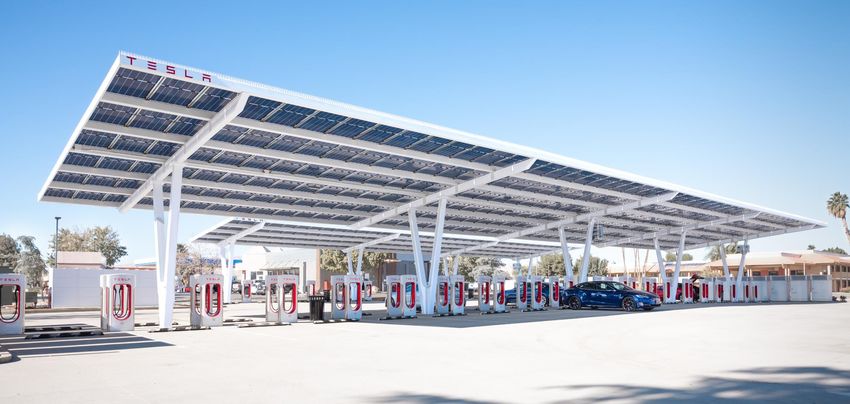
Driven by Sustainability      Sustainability drives us at Tesla. And not just our products—it drives our values and mission as a company. It’s at the core of
Mission and Tesla Ecosystem   everything we do and is what motivates us in our work. It also matters greatly to our customers, employees and shareholders.
                              Our products and services are focused on transportation and energy production and storage—traditionally some of the biggest
                              polluters both in the U.S. and globally.

                              To achieve a zero-emissions future, we have implemented several programs and initiatives at our global manufacturing facilities
                              and in the communities in which we operate. These programs provide clean energy to local schools, nonprofits and everything
                              in between.

                                                              Global                                                                   U.S.
                                                  Greenhouse Gas (GHG) Emissions                                          Greenhouse Gas (GHG) Emissions
                                                        by Economic Sector                                                      by Economic Sector

                                                                                                            Agriculture, Forestry &       Other
                                                             Other
                                                                                                               Other Land Use              9%
                                                              12%
                                                                                                                      3%                                        Electricity &
                                                                                                                                                                    Heat
                                              Building                            Electricity &                                                                 Production*
                                                6%                                    Heat                                                                          35%
                                                                                  Production*
                                                                                      31%                      Building
                                                                                                                 11%

                              Agriculture, Forestry
                               & Other Land Use
                                      15%
                                                                                                               Industry
                                                                                                                 12%

                                                      Industry
                                                        19%                  Transportation*
                                                                                  17%                                                                 Transportation*
                                                                                                                                                           30%

              7                                                                                            *Tesla-related sectors. Source: World Resources Institute
Driven by Sustainability      Addressing climate change through an entire ecosystem
Mission and Tesla Ecosystem
                              Climate change is reaching alarming levels globally due in large part to emissions from burning fossil fuels for transportation
                              and electricity generation. The world cannot reduce CO2 emissions without addressing both energy generation and
                              consumption. And the world cannot address its energy habits without first directly reducing emissions in the transportation and
                              energy sectors.

                              We are designing and manufacturing a complete energy and transportation ecosystem. We not only develop the technology
                              behind this ecosystem, but we also focus heavily on the affordability of our products that comprise it. We seek to achieve this
                              through our R&D and software development efforts as well as through our continuous drive to develop advanced manufacturing
                              capabilities. This is not only the right thing to do, but it also makes economic sense.

              8
Driven by Sustainability   Management involvement
Management and Oversight
                           Our ESG Sustainability Council, made up of leaders from across Tesla, collects data and prepares the analysis and content of
                           this report. The Sustainability Council also regularly presents this information to Tesla’s Board of Directors for review.

                           Board of Directors oversight

                           The Board of Directors serves as a prudent fiduciary for shareholders and oversees the management of Tesla’s business –
                           including oversight of Tesla’s ESG impacts, initiatives and priorities. With those responsibilities in mind, the Board sets high
                           standards for Tesla and its employees, officers and directors. Implicit in this approach is the importance of sound corporate
                           governance.

             9
Environmental
Impact

    10
Introduction In this section of the Impact Report, we will go over the details and calculations of the lifetime environmental impact of our
products.
Our lifecycle analysis (LCA) combines Scope 1 and 2, and material Scope 3 emissions* for a Fremont-made Model 3
While we are implementing processes to be able to measure and report Scope 1, 2 and 3 emissions on an enterprise level
starting with our 2021 report, for the purpose of this report, we have conducted an LCA which includes the vast majority of
Scope 1, 2 and 3 emissions, including the vehicle manufacturing phase, emissions from our supply chain, vehicle use and end-of-
life for a Fremont-made Model 3. While not a perfect measure, given the importance of the Model 3 and its high volume of
deliveries since 2018, it is a good proxy for understanding the emissions impact of our vehicle business. The details and
5,340 miles boundaries of this LCA analysis are described on page 90. Our goal is to eventually produce an LCA for each of our products in
The manufacturing process of a Model 3 currently results in slightly
addition to reporting our Scope 1, 2 and 3 emissions.
higher GHG emissions than an equivalent combustion engine vehicle.
However, based on the global weighted average grid mix, a Model 3
has lower lifetime emissions than an equivalent ICE after driving 5,340 EVs undeniably generate less lifetime greenhouse gas emissions than ICE vehicles
miles.
We are often asked if electric vehicles (EVs) are more sustainable than internal combustion engine (ICE) vehicles. The
environmental impact of zero-emission transport and energy products, like the products that Tesla produces and sells, is
undeniably more positive than the GHG-emitting alternatives. This becomes more pronounced when determining the lifetime
impact of EVs versus ICE vehicles, which requires looking at the entire lifecycle—from raw materials to use phase emissions to
disposal—and not just at vehicle usage emissions.
Variables often overlooked by other lifecycle studies:
• Using Worldwide Harmonized Light Vehicle Test Procedure (WLTP) or Environmental Protection Agency (EPA) fuel/energy
consumption data (both of which overestimate fuel-economy and underestimate emissions) rather than real-world data;
• Not considering the higher energy efficiency of Tesla’s powertrains;
• Assuming the average EV needs a battery replacement at some point in its life;
• Not considering emissions generated through the oil refining and the transportation process; and
• Using outdated data for the carbon impact of cell manufacturing.
We try to address these considerations and complexities in deriving a more accurate calculation in the following lifecycle
analysis.
11 *For a definition of Scope 1, 2 and 3 emissions see page 90 of this report.Lifecycle Analysis of Tesla EVs vs. Using only real-world data, not official NEDC, WLPT or EPA* consumption data
Equivalent ICE Vehicles
The most important variable in a lifecycle analysis of an automobile is real-world fuel consumption or electricity consumption,
as applicable, which impacts the use phase of the lifecycle. Various efficiency testing cycles such as NEDC, WLTP or EPA do not
truly represent real-world fuel or energy consumption. Therefore, for the purpose of this analysis, we used average energy
consumption over the more than 10 billion miles Tesla Model 3s have travelled as of December 31, 2020, including energy losses
during the charging process. For ICE vehicles, we used real-world fuel consumption data provided by Consumer Reports, which
reports model year 2020 mid-size premium sedans achieve 24.8 MPG on average. This translates to ~400 grams of CO2 per mile
once we account for emissions generated through the extraction, refining and shipment of oil.
The carbon impact of ICE vehicles remains the same every year of use, but for EVs, it should improve every year
Based on publicly available sales and fleet data, we estimate that an average vehicle in the U.S. is driven slightly less than
12,000 miles per year for about 17 years before it is scrapped. Furthermore, as an ICE vehicle ages, its fuel efficiency only
69 tons remains stable if serviced properly. On the other hand, electricity generation to charge EVs has become “greener” over time
with the addition of cleaner energy sources to the grid. Thus, emissions generated through EV charging should continue to
Lifetime CO2e emitted by an average internal combustion engine
vehicle (model year 2020) sold in the U.S. through its use phase, decline over time.
excluding CO2e emitted during the oil refining phase.
On the following pages, we will show the per mile lifecycle emissions of a current Fremont-made Model 3
This includes emissions from upstream supply chain, direct emissions from manufacturing and electricity consumption, and use
phase emissions when charged from a grid with a generation mix that reflects the geographic distribution of Model 3 deliveries
in each of the U.S., Europe and China. Below are the lifecycle emissions scenarios we show, and the assumptions used in each of
the charts on the following pages:
• What emissions per mile could be if a Model 3 were used for ridesharing over one million miles using cell chemistry from
Tesla energy products.
• What emissions per mile could be if a Model 3 were principally charged at home using a solar system and energy storage.
• What emissions per mile could be if a Model 3 were used for ridesharing over one million miles using cell chemistry from our
energy products and if it were only charged using a solar system and energy storage.
• The reference ICE vehicle is based on the average mid-size premium sedan in the U.S.
• Charging a Model 3 using solar panels and a Powerwall adds emissions to the manufacturing phase while reducing use phase
emissions to as low as zero when 100% of charging is done using that system.
• We assume no additional renewable energy capacity on the grid during the life of the vehicle given the shape of the
renewable energy adoption curve is still very much up for debate.
12 * NEDC = New European Driving Cycle; WLPT = Worldwide Harmonised Light Vehicles Test Procedure; EPA = U.S. Environmental Protection AgencyEV vs. ICE Vehicle Emissions per Mile The electricity grid keeps getting cleaner, while emissions from ICE vehicles do not
United States
While the makeup of the electricity grid varies from region to region, charging EVs is becoming less carbon intensive every year.
In the U.S., coal has historically been the dominant energy source for generating electricity. However, in the last decade, coal
power has declined significantly as regions turn to cleaner energy sources, such as wind and solar. Energy generated
by renewable sources has grown rapidly—in 2021, wind, solar and battery storage are expected to account for an estimated 81%
of new electricity generation capacity in the U.S. Many U.S. states (such as New York, referenced in the chart below) have been
making significant investments in renewable energy, as these sustainable options become more cost competitive compared to
fossil fuel resources.
To put this in perspective, average GHG emissions from charging one New York-based Tesla vehicle equates to the emissions
from an ICE vehicle with a fuel economy of 135 MPG (no such vehicle is on the market). Even when charging a Tesla in Michigan,
where approximately 60% of energy comes from natural gas and coal, the emissions from our vehicles still equates to the
emissions from an ICE vehicle with 59 real-world MPG (considerably more in terms of EPA rated MPG). As more regions adopt
sustainable energy solutions to generate power, emissions related to charging an EV from the grid will decrease even further.
EV customers can increase their renewable energy mix by installing solar panels or a Solar Roof and an energy storage solution,
such as Powerwall, in their homes. This dramatically reduces the lifetime carbon footprint of an EV, even when accounting for
the carbon footprint of both the solar panel/Solar Roof and Powerwall manufacturing and upstream supply chain.
Average Lifecycle Emissions in U.S. (gCO2e/mi)* Average Lifecycle Emissions in New York State (gCO2e/mi)
500 500
400 400
300 300
Shift to
200 greener 200
grid
100 100
0 0
Model 3 Model 3 Model 3 Model 3 Avg. Mid-Size Model 3 Model 3 Model 3 Model 3 Avg. Mid-Size
Ridesharing Use Personal Use Ridesharing Use Personal Use Premium ICE Ridesharing Use Personal Use Ridesharing Use Personal Use Premium ICE
(solar charged) (solar charged) (grid charged) (grid charged) (solar charged) (solar charged) (grid charged) (grid charged)
Manufacturing Phase Use Phase Manufacturing Phase Use Phase
13 *gCO2e/mi = grams of CO2-equivalent per mile drivenEV vs. ICE Vehicle Emissions per Mile A cleaner grid in Europe means a bigger emissions gap between Model 3 and a comparable ICE vehicle
European Union, U.K. & EFTA
In Europe, the U.K. and EFTA (Iceland, Liechtenstein, Norway and Switzerland), larger portions of energy generation come from
either renewable sources or nuclear, which means that in Europe the use phase emissions gap between ICEs and EVs is even
wider than it is in the U.S.
On the other hand, since an average European driver covers fewer miles per year than a U.S. driver, emissions from the
manufacturing phase are divided by fewer miles. While in the U.S., an average vehicle covers 200,000 miles before getting
scrapped, in Europe, total mileage is closer to 150,000 miles.
We used Austria as an example of how use phase emissions should evolve once the European grid becomes greener. As seen in
the chart on the right, in Austria, all-in lifecycle emissions of a personal, grid-charged Model 3 are more than 4x lower than all-in
lifecycle emissions of an equivalent ICE vehicle.
Average Lifecycle Emissions in Europe (gCO2e/mi) Average Lifecycle Emissions in Austria (gCO2e/mi)
500 500
400 400
300 300
Shift to
200 greener 200
grid
100 100
0 0
Model 3 Model 3 Model 3 Model 3 Avg. Mid-Size Model 3 Model 3 Model 3 Model 3 Avg. Mid-Size
Ridesharing Use Personal Use Ridesharing Use Personal Use Premium ICE Ridesharing Use Personal Use Ridesharing Use Personal Use Premium ICE
(solar charged) (solar charged) (grid charged) (grid charged) (solar charged) (solar charged) (grid charged) (grid charged)
Manufacturing Phase Use Phase Manufacturing Phase Use Phase
14EV vs. ICE Vehicle Emissions per Mile Despite a higher-emissions grid in China, Model 3 still has lower emissions than comparable ICE vehicles
China
In China, much of the grid is powered by coal. That said, even in this scenario, charging a Tesla Model 3 from the grid is still less
emission intensive than running an ICE vehicle. Just like in Europe, we have assumed a vehicle lifetime of 150,000 miles.
We are expecting the grid mix in China to improve dramatically over time as China remains a dominant deployer and
manufacturer of renewable energy. Sichuan Province (with a population of 81 million) is a great example of this. In this province,
given the high percentage of renewable energy penetration, charging an EV from the grid is less polluting than charging an EV
in most global countries or states.
In conclusion, even as of 2020, charging a Tesla Model 3 in any of our major markets is more environmentally friendly than
burning gasoline. Considering that vehicles are used for 17 to 20 years before getting scrapped, it is reasonable to assume that
in the coming years, the gap in emissions per mile between EVs and ICEs will only get wider.
Average Lifecycle Emissions in China (gCO2e/mi) Average Lifecycle Emissions in Sichuan Province (gCO2e/mi)
500 500
400 400
300 300
Shift to
200 greener 200
grid
100 100
0 0
Model 3 Model 3 Model 3 Model 3 Avg. Mid-Size Model 3 Model 3 Model 3 Model 3 Avg. Mid-Size
Ridesharing Use Personal Use Ridesharing Use Personal Use Premium ICE Ridesharing Use Personal Use Ridesharing Use Personal Use Premium ICE
(solar charged) (solar charged) (grid charged) (grid charged) (solar charged) (solar charged) (grid charged) (grid charged)
Manufacturing Phase Use Phase Manufacturing Phase Use Phase
15Reducing Carbon Footprint Even Further Efficiency of a Prius, performance of a Porsche
Improving Powertrain Efficiency
Tesla vehicles are known to have the highest energy efficiency of any EV built to date. In the early days of Model S production,
we were able to achieve energy efficiency of 3.1 EPA miles / kWh. Today, our most efficient Model 3 Standard Range Plus (SR+)
achieves an EPA range of 5.1 miles / kWh, higher than any EV in production to date. Model Y all-wheel drive (AWD) achieves 4.2
EPA miles / kWh, which makes it the most efficient electric SUV produced to date. The gap between Tesla AWD vehicle
efficiency continues to stand out compared to competitors in the same segment. While achieving the best-in-class energy
efficiency, our AWD models can accelerate to 60 mph in just 3.7 seconds (4.2s for Model Y) and reach a top speed of 145 mph
(135 mph for Model Y). In isolation, high energy efficiency is already difficult to achieve, but getting both performance and
efficiency is the tricky part.
Tesla Robotaxis will be even more energy efficient
The energy efficiency of Tesla vehicles will continue to improve over time as we continue to improve our technology and
powertrain efficiency. It is also reasonable to assume that our high-mileage products, such as our future Tesla Robotaxis, will be
designed for maximum energy efficiency as handling, acceleration and top speed become less relevant. This will minimize cost
for our customers as well as reduce the carbon footprint per mile driven.
Energy Efficiency - EPA range in miles/kWh Energy Efficiency - EPA range in miles/kWh
Average Lifecycle Emissions in U.S. (gCO2e/mi) Small SUVs (AWD) Mid-sized sedans (AWD)
5 5
500
4 4
400 Impacted by EV
motor efficiency
300
3 3
200
2 2
100
0 1 1
Model 3 Model 3 Model 3 Model 3 Avg. Mid-Size
Ridesharing Use Personal Use Ridesharing Use Personal Use Premium ICE
(solar charged) (solar charged) (grid charged) (grid charged)
0 0
Manufacturing Phase Use Phase Model Y VW Ford Jaguar Audi Mercedes Model 3 AWD Polestar 2 BMW i4 M50 Audi e-tron
ID.4 Mach E iPace e-tron EQC* Sportsback
*Tesla estimate; Source: OEM websites, ev-database.org
16Reducing Carbon Footprint Even Further While emissions from the manufacturing phase can account for a relatively minor portion of lifetime vehicle emissions when
Tesla Manufacturing Footprint: compared to the use phase, it is still an important part of lifecycle emissions. These are the steps that we are taking to reduce
the manufacturing GHG footprint:
Current Actions
1. Building new, better designed, more efficient vehicle factories
Building a factory from the ground up with sustainability in mind can have a material impact on reducing energy use. For each
component that requires less movement around the factory, and as we use fewer robots in the vehicle production process,
energy consumption declines.
Our Fremont Factory, where we started operation in 2010, was built over 60 years ago by established automotive original
equipment manufacturers (OEM). While substantial improvements have been implemented since, it was not possible to
fundamentally change the layout of this facility. In contrast, Tesla’s newer factories are built by us from the ground up and
designed to be sustainable and efficient. For example, a delivery truck can back up and offload components at the exact part of
the production line where such components are needed—reducing emissions associated with the production process.
In our quest for constant improvement, we build each new factory to be better and more sustainably designed than the
previous one. While we have already completed substantial improvements at Gigafactory Shanghai, further improvements will
continue at Gigafactory Berlin-Brandenburg and Gigafactory Texas.
Average Lifecycle Emissions in U.S. (gCO2e/mi)
Model 3 in Fremont, CA Model 3 in Gigafactory Shanghai
500
400
Impacted by energy-
300 efficient factories
200
100
0
Model 3 Model 3 Model 3 Model 3 Avg. Mid-Size
Ridesharing Use Personal Use Ridesharing Use Personal Use Premium ICE
(solar charged) (solar charged) (grid charged) (grid charged)
Manufacturing Phase Use Phase
17Reducing Carbon Footprint Even Further While emissions from the manufacturing phase can account for a relatively minor portion of lifetime vehicle emissions when
Tesla Manufacturing Footprint: compared to the use phase, it is still an important part of lifecycle emissions. These are the steps that we are taking to reduce
the manufacturing GHG footprint:
Current Actions
2. Production localization
Prior to the end of 2019, all our vehicles were produced in a single location, California (with batteries and powertrains from
Nevada), and shipped to the rest of the world. As Tesla’s operating cash flows improved substantially ($2.1B in 2018, $2.4B in
2019 and $5.9B in 2020), we were able to start global expansion of our vehicle manufacturing footprint. Since the vast majority
of our demand comes from North America, Europe and China, we wanted to make sure we could produce and deliver vehicles
locally from each of these locations.
a) Fremont Factory + Gigafactory Nevada (open since 2017)
b) Gigafactory Shanghai (open since 2019)
c) Gigafactory Berlin-Brandenburg (will open in late 2021)
d) Gigafactory Texas (will open in late 2021)
Average Lifecycle Emissions in U.S. (gCO2e/mi)
500
Former approach New approach
400
Impacted by
300 production localization
200
100
0
Model 3 Model 3 Model 3 Model 3 Avg. Mid-Size
Ridesharing Use Personal Use Ridesharing Use Personal Use Premium ICE
(solar charged) (solar charged) (grid charged) (grid charged)
Manufacturing Phase Use Phase
18Reducing Carbon Footprint Even Further While emissions from the manufacturing phase can account for a relatively minor portion of lifetime vehicle emissions when
Tesla Manufacturing Footprint: compared to the use phase, it is still an important part of lifecycle emissions. These are the steps that we are taking to reduce
the manufacturing GHG footprint:
Current Actions
3. Supply chain localization
In alignment with our mission, Tesla believes in reducing emissions upstream of our factories, including the carbon footprint of
our supply chains. When it comes to subcomponent manufacturing, such as the instrument panel and large stamped portions of
the vehicle body, we believe the closer they are manufactured to our factories, the better. Localizing suppliers reduces the
distance parts need to travel before they are assembled into our vehicles, and reduces the emissions associated with
transportation. Supplier localization also supports the local community and its workforce and reduces the risk of a supply
disruption due to geopolitical dynamics. While some components (for example, semiconductors) are and will continue to be
fabricated at highly specialized manufacturing facilities in specific locations around the globe, heavy vehicle parts will
increasingly be produced near our Gigafactories in order to be closer to our vehicle manufacturing process.
As a testament to Tesla’s localization efforts and our strategy to manufacture key modules, such as the battery pack, drive unit
and seating in-house at Tesla, Tesla’s Model 3 was recently awarded the top spot (Model Y was third) on the Cars.com
American-Made Index. The index ranks vehicles using five factors: assembly location, parts content, engine (powertrain) origin,
transmission origin and U.S. manufacturing workforce.
Average Lifecycle Emissions in U.S. (gCO2e/mi)
Origin of Non-Tesla Produced Vehicle Components
500 Model 3/Y
Vehicle Manufacturing in California, USA Vehicle Manufacturing in Shanghai, China
400
Impacted by supply
300 chain localization
Other
Other 14%
200
27%
100
0
North
Model 3 Model 3 Model 3 Model 3 Avg. Mid-Size
America China
Ridesharing Use Personal Use Ridesharing Use Personal Use Premium ICE
(solar charged) (solar charged) (grid charged) (grid charged) 73% 86%
Manufacturing Phase Use Phase
Component origin calculations are based on expenditures for non-Tesla produced Model 3 and Model Y vehicle components purchased in the fourth quarter of 2020.
19
Location information is based on country-of-origin data as captured through Tesla’s external supply base.Reducing Carbon Footprint Even Further While emissions from the manufacturing phase can account for a relatively minor portion of lifetime vehicle emissions when
Tesla Manufacturing Footprint: compared to the use phase, it is still an important part of lifecycle emissions. These are the steps that we are taking to reduce
the manufacturing GHG footprint:
Current Actions
4. Covering roof space with solar panels
Gigafactory Nevada was designed to be covered with solar panels. To date, we have installed solar panels with a capacity of
3,200 KW. This installation will grow to about 24,000 KW—the whole roof of the current building structure—by the end of next
year. This will make it the largest rooftop solar installation in the U.S. We are installing solar panels at other locations, too, such
as our Fremont Factory, Lathrop factory and Gigafactory New York.
Average Lifecycle Emissions in U.S. (gCO2e/mi)
500
400
Impacted by energy-
300 efficient factories
200
100
0
Model 3 Model 3 Model 3 Model 3 Avg. Mid-Size
Ridesharing Use Personal Use Ridesharing Use Personal Use Premium ICE
(solar charged) (solar charged) (grid charged) (grid charged)
Manufacturing Phase Use Phase
20Reducing Carbon Footprint Even Further We will not be content until all of our factories become carbon neutral, and there are other projects that we are working on to
Tesla Manufacturing Footprint: further reduce emissions. In order to reduce the cost of our vehicles and batteries, we also need to use less energy to produce
them. Many of the projects created to achieve this goal were showcased at our Battery Day presentation in September 2020.
Upcoming Plans
5. Transitioning to in-house manufactured 4680 Tesla cells, whose production process can reduce energy consumption by 70%
At Tesla’s 2020 Battery Day, we presented a novel way that cells can be manufactured using a dry electrode process. Current
electrode production processes involve mixing liquids with cathode or anode powders and using massive machinery to coat
and dry the electrode. Since this process involves large ovens, today’s cell production consumes a lot of energy. The new dry-
electrode process allows for the direct transition from a cathode or anode powder to an electrode film, reducing energy
consumption in the overall cell manufacturing phase by at least 70% based on our latest analysis.
6. Transitioning to in-house cathode material manufacturing
While transitioning to in-house cathode materials should take longer than transitioning to in-house cells, our cathode materials
manufacturing process has the potential to reduce energy use in this step of the process (currently undertaken by suppliers) by
40%.
7. Utilizing renewable energy as much as possible throughout all our operations
Average Lifecycle Emissions in U.S. (gCO2e/mi)
It is our intention to shift energy consumption toward renewable energy as quickly as possible throughout our operations,
whether its at our factories, sales, service or delivery locations, or through our Supercharger Network.
500
400
Impacted by energy-
300 efficient factories
200
100
0
Model 3 Model 3 Model 3 Model 3 Avg. Mid-Size
Ridesharing Use Personal Use Ridesharing Use Personal Use Premium ICE
(solar charged) (solar charged) (grid charged) (grid charged)
Manufacturing Phase Use Phase
21Reducing Carbon Footprint Even Further Our batteries are designed to function for the entire life of the vehicle
Increasing Vehicle Utilization
Tesla’s battery packs are designed to outlast the vehicle. We estimate that a vehicle gets scrapped after approximately 200,000
miles of usage in the U.S. and roughly 150,000 miles in Europe. Creating a battery that could instead last for 1,000,000 miles
(4,000 charging cycles) would dramatically reduce the emissions per mile driven for high-mileage vehicles such as taxis,
delivery vans or trucks. This is clear when comparing the per mile emissions of a Model 3 for personal use versus ridesharing
use – the per mile emissions from the use phase remain the same, but the emissions per mile from the manufacturing phase are
substantially lower because the emissions are spread over many more miles.
Producing Robotaxis is a core part of our mission to accelerate the world's transition to sustainable energy
All vehicles in the world combined travel trillions of miles every year. A relatively small number of vehicles, such as taxis,
delivery vans, trucks and buses account for a disproportionate amount of vehicle miles and, as a result, a disproportionate
amount of emissions. A single future Tesla vehicle with a million-mile battery could be utilized over five-times more than an
average vehicle in the U.S. After being fully optimized, and even once it is scrapped, a battery can still be recycled and its
materials used in a brand-new battery.
Tesla Model S/X Battery Capacity Retention per Distance Traveled
100%
Average Lifecycle Emissions in U.S. (gCO2e/mi)
80%
500
400
60%
Increasing
300
Vehicle Utilization
200
40%
100
0
20%
Model 3 Model 3 Model 3 Model 3 Avg. Mid-Size
Ridesharing Use Personal Use Ridesharing Use Personal Use Premium ICE
(solar charged) (solar charged) (grid charged) (grid charged)
0%
Manufacturing Phase Use Phase 0 25 50 75 100 125 150 175 200
Distance Traveled (thousands of miles)
Standard Deviation Retention
22NOx, Particulates and Other Pollutants Pollution from burning fossil fuels leads to eight million premature deaths globally each year
According to recently published research in Environmental Research by Harvard University, in collaboration with the University
of Birmingham, the University of Leicester and University College London, air pollution causes over eight million premature
Pollution in the Italian Alps prior to stay-at-home orders deaths annually. That is double the previous estimate of deaths from the negative effects of fine-particle pollution and would
account for one-in-five premature deaths worldwide. This is a major advantage of EVs that is often forgotten about as the
overall EV debate tends to focus on greenhouse gases. EVs are not just about the future of our planet, but very much about
addressing preventable deaths today.
While air-quality is often categorized as a problem in developing countries, Nitrogen oxide (NOx) and other PM2.5 particulates*
cause significant issues in developed countries as well. In Europe alone, almost 800,000 people die prematurely every year due
to pollution-related illnesses. EVs not only reduce the world's total carbon footprint, but also help to reduce city pollution.
Lockdowns have shown how clean cities could look
Cities around the world are gradually setting targets for banning diesel vehicles, which are known for their high NOx and
particulate emissions. We have seen throughout the first half of 2020 that air quality can rapidly improve with the reduction of
ICE-related traffic as the restrictions on business and travel due to COVID-19 led to dramatically fewer miles being driven. It is
not hard to imagine that many cities could become electric-only in the near future as they were able to witness the positive
impact that fewer ICE vehicles on the road has on air quality.
Pollution in the Italian Alps during COVID-19 lockdowns
*PM2.5 refers to atmospheric particulate matter (PM) that have a diameter of less than 2.5 micrometers and include combustion particles, organic compounds, metals, etc.
23 Image: Flavio Lo Scalzo/ReutersTesla Semi Very few combination trucks are on the road, but account for 17% of total vehicle emissions
Reducing Fleetwide Emissions
Combination trucks - of which the vast majority are semi trucks - in the U.S. account for just 1.1% of the total fleet of vehicles on
the road. That said, because combination trucks have high fuel consumption due to their weight and heavily utilization, they
account for approximately 17% of all U.S. vehicle emissions. Electrifying the heavy-duty truck segment is an essential part of
transitioning the world to sustainable energy.
Payload equal to a diesel truck
With both the U.S. and E.U. having approved higher weight allowances for electric heavy-duty trucks, we expect the payload to
be at least as high as it would be for a diesel truck. In the E.U., electric semi trucks are allowed to be 2 tons (~4,400 pounds)
heavier than diesel equivalents, and in the U.S. the allowance is 0.9 tons (2,000 pounds). When fully loaded, the Tesla Semi
should be able to achieve over 500 miles of range, achieved through aerodynamics and highly efficient motors. This truck will
be able to reach an efficiency of over 0.5 miles per kWh.
While most heavy trucking journeys are shorter than 500 miles, we want long-distance hauling to also be sustainable. We are in
the process of developing a Megacharger network at trucking rest stops across the U.S. and Europe, where each Tesla Semi
could top up their range.
% of U.S. Vehicle Fleet % of U.S. Vehicle Emissions
1.1%
17.0%
98.9% 83.0%
Combination Trucks Rest of Fleet Combination Trucks Rest of Fleet
24Battery Recycling
A common question we receive is: “What happens to Tesla battery packs once they reach the end of
their life?” An important distinction between fossil fuels and lithium-ion batteries as an energy source is
that while fossil fuels are extracted and used once, the materials in a lithium-ion battery are recyclable.
When petroleum is pumped out of the ground, chemically refined and then burned, it releases toxic
emissions into the atmosphere that are not recoverable for reuse. Battery materials, in contrast, are Battery Materials Lifecycle
refined and put into a cell and will remain in the cell at the end of their life when they can be recycled
to recover valuable materials for reuse repeatedly.
Longer battery longevity is the most sustainable option
Battery pack life extension is the superior option to recycling for both environmental and business
reasons. This is why before decommissioning and recycling a consumer battery pack, Tesla does
everything it can to extend the useful life of each battery pack, including sending out over-the-air
software updates to Tesla vehicles to improve battery efficiency when our engineers find new ways to
do so. In addition, any battery that is no longer meeting a customer’s needs can be serviced at a Tesla
service center.
Extracting raw
materials
Every battery used in R&D or returned from the field that cannot be remanufactured are recycled
Tesla batteries, including the battery packs in our vehicles and our energy storage products, are made
to last many years, and therefore, we have only received a limited number of these batteries back from
the field. Most batteries that Tesla recycles today are pre-consumer, coming to us through R&D and
quality control. None of our scrapped lithium-ion batteries go to landfills and 100% are recycled.
Furthermore, Tesla has an established internal ecosystem to re-manufacture batteries coming from the
field to our service centers. We actively implement circular economy principles and consider all other
options before opting for battery recycling.
The small number of post-consumer batteries that we receive are primarily generated from our fleet of
vehicles on the road, predominantly from taxi-like vehicles. Since we have only been producing Model S
(our oldest model) for approximately nine years, and our energy storage products for even less time, it
will likely be some time before we start receiving back vehicle batteries in larger volumes.
25Battery Recycling at Gigafactory Nevada While Tesla works with third-party recyclers, we are also recycling in-house
In the fourth quarter of 2020, Tesla successfully installed the first phase of our cell recycling facility at Gigafactory Nevada for
in-house processing of both battery manufacturing scrap and end-of-life batteries. While Tesla has worked for years with third-
party battery recyclers to ensure our batteries do not end up in a landfill, we understand the importance of also building
Global annual amount of lithium-ion battery metals sent for recycling
recycling capacity in-house to supplement these relationships. Onsite recycling brings us one step closer to closing the loop on
by Tesla in 2020:
materials generation, allowing for raw material transfer straight to our nickel and cobalt suppliers. The facility unlocks the cycle
1,300 of innovation for battery recycling at scale, allowing Tesla to rapidly improve current designs through operational learnings and
to perform process testing of R&D products.
Tons of Nickel
400 Every Tesla battery factory will recycle batteries on site
Tons of Copper
80
As the manufacturer of our in-house cell program, we are best positioned to recycle our products efficiently to maximize key
battery material recovery. With the implementation of in-house cell manufacturing at Gigafactory Berlin-Brandenburg and
Tons of Cobalt Gigafactory Texas, we expect substantial increases in manufacturing scrap globally. We intend to tailor recycling solutions to
each location and thereby re-introduce valuable materials back into our manufacturing process. Our goal is to develop a safe
A closed-loop battery recycling process presents a compelling recycling process with high recovery rates, low costs and low environmental impact. From an economic perspective, we expect
solution to move energy supply away from the fossil-fuel based
to recognize significant savings over the long term as the costs associated with large-scale battery material recovery and
practice of take, make and burn, to a more circular model of recycling
end-of-life batteries for reuse over and over again. recycling will be far lower than purchasing additional raw materials for cell manufacturing.
“Black mass” awaiting enrichment at Tesla’s
recycling facility in Nevada.
26Waste Generated As Tesla builds more efficient factories, our waste per vehicle decreases
Per Vehicle Manufactured
Building localized factories both makes sense economically and reduces waste. Because the automotive supply chain doesn’t
have a strong presence on the West Coast of the U.S, many components need to be shipped from long distances, requiring
excessive packaging and creating more waste than necessary.
Second, modern factories are better designed for material flow. Trailer entry points surround the whole factory, which means
that components can be offloaded precisely at the part of the factory where they are needed. Less material flow results in less
waste, because a shorter journey requires less protective packaging. The chart below shows that waste generation per vehicle
at Gigafactory Shanghai is about half of what it is in the U.S. We are expecting our upcoming factories such as Gigafactory
Berlin-Brandenburg and Gigafactory Texas to continue the same trend.
Any materials that are possible to recycle, we recycle
The vast majority of generated waste, such as paper, plastics and metals, is recyclable. At Gigafactory Shanghai, for example,
just 4% of total waste generated is not recyclable.
We continue to push for innovative approaches to reducing waste, which includes reduction of non-recyclable materials in the
first place, learning from local factories and deploying improvements globally or working with our logistics team to minimize
shipments and packaging per vehicle.
Waste Generated Per Vehicle (2020; kg/vehicle)
600
400
200
0
Global Vehicle Manufacturing Legacy Manufacturing Sites New Manufacturing Sites
Waste Diverted from Disposal (Recycled) Waste Directed to Disposal
• Global Vehicle Manufacturing = all major factories dedicated to vehicle manufacturing, including the Fremont Factory and supporting facilities, Gigafactory Nevada, and
Gigafactory Shanghai.
27 • Legacy Manufacturing Sites = Gigafactory Nevada, Fremont Factory and supporting facilities.
• New Manufacturing Sites = Gigafactory Shanghai.Water Used Per Vehicle Manufactured Currently, Tesla uses less water per vehicle than almost any ICE carmaker
Current State
There is a misconception that producing an EV requires more water than producing an ICE vehicle. Our data shows this is not
the case. While each automaker may draw their boundaries slightly differently (depending on how vertically integrated they
are), according to the latest publicly available figures, Tesla withdrew less water at facilities dedicated to vehicle manufacturing
per vehicle produced than the majority of established carmakers. Furthermore, the efficient manufacturing design we are
implementing at our new factories in Texas and Berlin-Brandenburg will result in further reductions in our water usage per
vehicle. Our goal is to have industry-leading low water usage per vehicle, even when accounting for cell manufacturing. The
below chart includes our latest estimates for water usage per vehicle at those facilities.
Water usage and power generation
While many recognize the impact that power generation has on CO2 emissions, its impact on water consumption is less
appreciated. Power generation is one of the leading causes of water withdrawal in the U.S., as water for thermoelectric power is
used to generate electricity with steam-driven turbine generators and to cool power-producing equipment. This means that
every kilowatt-hour (kWh) of clean solar energy produced not only lowers CO2 emissions, but also lowers water consumption.
Water Withdrawal Intensity in Vehicle Manufacturing (m3/vehicle)
5
4
3
Cell Manufacturing
2
1
0
GF Berlin BMW GF Texas Tesla FCA Industry VW Ford PSA GM Toyota Daimler
(est.)* (est.)* (2020) Avg. Group (cars)
*Latest estimate for water consumption based on factory design. Actual production figures will not be known until factories are ramped to full production speed.
28Water Used Per Vehicle Manufactured Future Tesla factories will set a new standard of water use per vehicle
Future State
Water is becoming increasingly scarce as the climate changes. That is why we are reducing our water usage throughout our
operations as much as possible. We have prioritized direct use in manufacturing and will continue to explore the rest of our
impact throughout the supply chain and in sales, service and delivery.
The “cooling tower makeup” is the single biggest contributor to water usage in any car factory after paint operations. As water
that cools machinery evaporates, it needs to be topped up regularly. The total cooling tower makeup could be offset entirely by
non-potable sources such as rainwater or wastewater. These are some of the initiatives we are taking at Gigafactory Berlin-
Brandenburg and/or Gigafactory Texas in order to reduce water consumption per complete vehicle (including cells).
1. Water intensive process optimization
We are constantly looking into reducing water consumption by optimizing or eliminating water intensive production processes
across our operations. At Gigafactory Berlin-Brandenburg, we will use hybrid cooling towers, eliminate quench tanks in casting
and introduce cascade rinsing systems in the paint shop and battery can wash process for cell manufacturing.
2. Rainwater harvesting and reuse
We are planning to capture at least 25% of roof runoff (1 million square feet) to a central underground storage system within
Gigafactory Texas. Rainwater will be recycled for use in the cooling of manufacturing equipment. In an average year, such
systems should save an estimated 7.5 million gallons of potable city water.
3. Reclaimed water (wastewater reuse)
Using local treated wastewater could result in offsetting the entire annual cooling tower makeup water demand with non-
drinkable uses. At Gigafactory Texas, this could result in an estimated 40 million gallons of potable city water conserved
annually, which equates to the total cooling tower needs for a vehicle production rate of about 250,000 vehicles a year.
Reclaimed water is available and under investigation for use at both Gigafactory Texas and Gigafactory Berlin-Brandenburg.
4. In-house cathode production
As we stated at our 2020 Battery Day, we are developing a more sustainable method to produce cathode in-house. This new
production process will decrease the water needed by current cathode production methods used in the industry by ~95% based
on our estimates. We are currently validating this new production process at our pilot production line in Fremont, California,
and hope to launch it as soon as practicable.
29Emissions Credits Emissions credit systems around the world are designed to economically benefit companies with non-polluting products by
Accelerating Deployment of New Factories allowing them to sell their credits to polluting companies. In order to meet various countries’ emission targets and avoid
government fines, polluting companies pay non-polluting companies through credit purchases. The goal of this system is for
every OEM to be incentivized to reduce emissions and themselves become non-polluting by selling more of their own
manufactured EVs instead of paying another company for their non-polluting credits. We have seen strong positive signs from
several OEMs who are launching competitive EVs rather than resorting to manufacturing “compliance cars,” which are usually
EVs built on an ICE architecture. These compliance cars are designed to meet regulatory requirements rather than to create the
best possible product to help create a more sustainable future for the world.
Emissions credit revenue is used for EV capacity expansion, which in turn displaces ICEs
In 2020, we generated almost $1.6 billion in revenue selling zero-emission regulatory credits to other OEMs. Proceeds from such
sales will go towards building new factories to produce EVs that will continue to displace ICE vehicles. While it is common
practice today for ICE vehicle OEMs to purchase regulatory credits from other companies (such as Tesla) to offset their total
CO2 emissions, it is not a sustainable strategy. In order to meet increasingly strict regulatory requirements across the world,
OEMs will be forced to develop truly competitive EVs.
EV sales by all carmakers need to accelerate, taking market share from ICEs
In 2020, Tesla delivered almost 500,000 EVs globally. While many OEMs introduced new EV models in the past few years, with
few exceptions their actual global deliveries of EVs increased only marginally. We hope that every car manufacturer will strive to
produce hundreds of thousands of EVs per year, as significant reduction of emissions will only be achieved if all carmakers push
for an industry-wide shift to EVs.
Electric Vehicles Sold
500,000
2017
400,000 2018
2019
300,000
2020
200,000
100,000
0
Tesla Inc. VW Group R-N-M Hyundai BYD GM Stellantis Daimler BMW Jaguar Toyota Ford
Alliance Motor AG Group Land
Rover
Source: EV-volumes.com; Micro-cars not included (Tata)
30Net Energy Impact of Our Products Tesla solar panels have generated multiple times the electricity consumed by our factories
As of the end of 2020, Tesla (including SolarCity prior to its 2016 acquisition by Tesla) has installed almost 4.0 Gigawatts of solar
systems and cumulatively generated over 20.8 Terawatt-hours (TWhs) of emissions-free electricity. For reference, that is multiple
times more energy generated by our installations than the total energy Tesla has used to run all our factories since we began
producing Model S in 2012.
We are striving to always remain a net contributor to renewable energy generation. It is our goal to eventually have all our
manufacturing energy needs satisfied through renewable sources where possible. Additionally, we are hoping to see more Tesla
vehicle customers installing solar panels or Solar Roof along with a Powerwall to meet their own energy needs in a sustainable
way.
In conclusion, we are currently enhancing our internal processes for measuring relevant environmental data as accurately and
timely as possible. Once this process is completed, Tesla will start publishing Scope 1, 2 and 3 emissions in detail.
Cumulative Energy Produced by Tesla Solar Panels vs Consumed by Tesla Factories
25,000
20,000
15,000
10,000
5,000
0
-5,000
2012 2013 2014 2015 2016 2017 2018 2019 2020
Energy Consumed (GWh; fossil)* Energy Consumed (GWh; clean)* Energy Produced (GWh)
*Estimated based on state and country level grid data supplied by DOE and IEA. Please see appendix for detailed explanation of energy consumption figures.
31Product
Impact
32Product Affordability
Price Equivalency Between EVs and ICE Vehicles
Model 3 is the first EV to be priced on-par with ICE vehicle equivalents Starting Price of Mid-Sized Premium Sedans
(before subsidies or dealer incentives)
Model 3 is the first EV in history priced on-par with its gas-powered equivalents, even before
$40,000
taking into consideration any regional subsidies and lower running costs. Unfortunately, most
other EVs on the market today are still priced at a $10,000 to $20,000 premium compared to
their direct ICE vehicle equivalents. $30,000
There doesn’t need to be a tradeoff between sustainability, performance and affordability $20,000
Tesla’s ability to achieve our mission rests first and foremost on our products. We are not just
$10,000
trying to build the best electric cars, we are striving to build the best cars, period. Our focus
from the beginning has been to develop products that are not only sustainable, but also superior
to fossil-fuel alternatives in every way. Many incorrectly believe that choosing sustainable $0
products requires consumers to compromise on price or performance, but Tesla vehicles Mercedes C-class BMW 3-Series Model 3 SR+ Audi A4
combine performance, safety, efficiency and competitive prices. Similarly, Tesla’s energy Source: OEM websites
generation and storage products power both urban and remote communities with reliable,
affordable energy.
33Product Affordability Over five years of average driving, the ownership costs of a Tesla Model 3 are roughly the same as a Toyota Camry
Total Cost of Ownership
The accessibility of our products is fundamental to our mission. While the “sticker price” of Model 3 is on-par with an equivalent
BMW or Audi, the sticker price of a vehicle itself is only one of many cost items that need to be considered. The lifetime running
costs of EVs are lower than those of ICE vehicles due to lower maintenance costs and cheap electricity, and the residual value of
used Tesla vehicles remains exceptionally strong since we first introduced them to the market. As a result, Tesla Model 3 has a
base price similar to BMW 3-series, but the total cost of ownership per mile is nearly on-par with America’s best-selling sedan,
the Toyota Camry*.
Cost data is based on data collected from our fleet
The advantage of having a fleet of vehicles that is constantly online is the ability to analyze real-world data rather than only
being able to use estimates. We have an extensive database of Model 3 residual values and cost of repairs, maintenance, energy
use, etc. Additionally, the insurance cost for the Model 3 SR+ below is based on the projected median insurance rate in the U.S.
for Tesla Model 3 drivers. Our analysis shows that over five years and 60,000 miles, running a Model 3 SR+ costs 55 cents per
mile.
Notably, running costs such as fuel (electricity or gasoline), maintenance, tires and repairs for Model 3 should cost just over half
of a mass-market ICE vehicle such as a Toyota Camry.
Total Cost of Ownership ($ per mile) - 5 years, 60,000 miles
Model 3
SR+
Toyota
Camry
BMW 3
Series
$0.00 $0.30 $0.60 $0.90
Depreciation, Taxes, Fees, Incentives & Financing Insurance Maintenance, Tires & Repairs Fuel (Electricity or Gasoline)
34 *Based on model year 2020 vehicles. Please see page 92 for sources.You can also read


