Managing Natural Gas Price Volatility: Principles and Practices Across the Industry - Prepared for
←
→
Page content transcription
If your browser does not render page correctly, please read the page content below

Managing Natural Gas Price Volatility:
                                                Principles and Practices Across the Industry

                                           November 2010

                                           Frank C. Graves
                                           Steven H. Levine

                                           Prepared for
                                                                 American Clean Skies Foundation

Copyright © 2010 The Brattle Group, Inc.
Table of Contents

I.    Introduction: Some recent history and properties of gas markets........................................... 1
II.   Gas Market Risk Characteristics............................................................................................. 8
      Variability vs. Volatility ......................................................................................................... 8
      Price volatility vs. Returns volatility ...................................................................................... 8
      Gas markets and available hedging contracts ....................................................................... 10
      Forward Price Risk Premiums .............................................................................................. 13
      Volatility term structure........................................................................................................ 13
      Mean reversion...................................................................................................................... 14
III. Risk management principles ................................................................................................. 16
IV. Tools for managing natural gas price volatility .................................................................... 22
      Physical Tools....................................................................................................................... 22
      Financial Tools...................................................................................................................... 24
      Non-standard Contracts ........................................................................................................ 30
V.    Risk Management Processes and Controls ........................................................................... 32
      Goals ..................................................................................................................................... 32
      Targets/Schedules ................................................................................................................. 32
      Metrics/Reports..................................................................................................................... 34
      Controls................................................................................................................................. 34
      Limitations in managing gas price volatility ........................................................................ 37
VI. Comparisons of Industry Hedging Practices......................................................................... 41
      Gas Distribution Utilities - hedging for customers with physicals and financials................ 41
      Electric Utilities - hedging complex load for gas-fired generation....................................... 43
      Gas Producers - hedging to protect drilling economics and cash flow................................. 45
      Major Integrated Gas Producer............................................................................................. 45
      Mid-Size, Independent Gas Producers.................................................................................. 46
      Industrial End-users – hedging gas used for feedstock and energy supply given constraints
      on final product prices .......................................................................................................... 48
VII. Conclusions and Recommendations ..................................................................................... 52

                                                                        i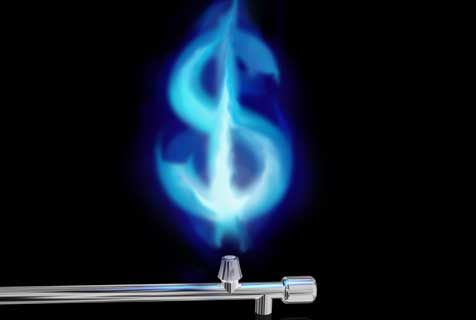
I.       INTRODUCTION: SOME RECENT HISTORY AND PROPERTIES OF GAS
         MARKETS

The volatility in natural gas prices over the course of the past 10 years has resulted in an
increased emphasis on risk management activities by industry participants. Several major price
spikes occurred during the decade, and a general tightening of the supply-demand balance in
U.S. gas markets resulted in higher natural gas prices and higher price volatility for U.S. gas
consumers relative to the experience of the 1990s. Some have suggested that speculation also
contributed to high price levels and volatility – though there is no general agreement on this
view.1 Since natural gas is also the marginal or price-setting fuel in electricity markets in many
regions of the country, the volatility in natural gas prices over the past decade also had a
pronounced impact on retail electricity prices, and probably vice versa as well, since natural gas-
fired generation has been the predominant source of increased gas demand over the past 15
years.

Figure 1 below shows the daily gas price at Henry Hub over the past 20 years.

1
     For example, see United States Senate Permanent Subcommittee on Investigations of the Committee on
     Homeland Security and Governmental Affairs, “Staff Report,” Excessive Speculation in the Natural Gas
     Market, June 25, 2007. The report found that a hedge fund, Amaranth Advisors LLC, dominated the U.S.
     natural gas market in 2006 and that its 2006 positions in the natural gas market constituted excessive
     speculation. See also, Written Testimony of Jeffrey Harris and John Fenton Before the Subcommittee on
     General Farm Commodities and Risk Management, Committee on Agriculture. Mr. Harris and Mr.
     Fenton analyzed the role of investors (both hedgers and speculators) in both energy and agriculture future
     markets and found that “there is little economic evidence to demonstrate that prices are being
     systematically driven by speculators in these markets.” They also found “the economic data shows that
     overall commodity price levels, including agriculture commodity and energy futures prices, are being
     driven by powerful fundamental economic forces and the laws of supply and demand.”

                                                       1
Figure 1
Henry Hub Spot Price (1991-2010)
20.0
18.0
16.0
14.0
($/MMBtu)
12.0
10.0
8.0
6.0
4.0
2.0
0.0
Jan-91 Jan-93 Jan-95 Jan-97 Jan-99 Jan-01 Jan-03 Jan-05 Jan-07 Jan-09
Source: Platts, Gas Daily.
It is immediately evident in this graph that most of the 1990s was a period of relatively stable
prices, except for one significant price spike in 1996.2 In contrast, the recent past decade was
much more volatile and had several significant price spikes, the first occurring in the winter of
2000-2001, with additional price spikes in 2003 and in the fall of 2005 – the latter caused by
major disruptions to U.S. gas markets due to hurricanes Katrina and Rita in August and
September. Prices spiked again in the summer of 2008 (coinciding with a major spike in crude
oil prices), but would collapse thereafter as new sources of unconventional supplies—especially
shale supplies—started to serve U.S. gas markets in large quantities at the same time as the
economic crisis resulted in a significant loss of industrial demand for natural gas.
The intuition from these graphs that gas prices have become not just higher but more variable as
well is confirmed in Figure 2, which plots the 250-day and 90-day trailing standard deviation of
daily Henry Hub prices.
2
As discussed later, this period of low volatility in the 1990s may have been an artifact of prior gas supply
regulatory policies.
2Figure 2
Standard Deviation of Henry Hub Spot Prices
Pre - 2000 Post - 2000
5.0
One year
4.5 (250 day)
One
4.0 quarter trailing
3.5
(62 day)
trailing
($/MMBtu)
3.0
2.5
2.0
1.5
1.0
0.5
0.0
Jan-92 Jan-94 Jan-96 Jan-98 Jan-00 Jan-02 Jan-04 Jan-06 Jan-08 Jan-10
Source: Platts, Gas Daily.
Recall from introductory statistics classes that if the population of possible outcomes is normally
distributed, then about 2/3 of observations should lie within one standard deviation on either side
of the mean. Above, this would mean that about 1/3 of the time, the daily change in gas prices at
Henry Hub has been more than $1 to $3, compared with more like $.25 in the early 1990s (when
the gas “bubble” had not yet burst). In fact, gas prices are not normally distributed. The normal
distribution is the familiar, symmetric bell-shaped curve, but gas prices do not fit this pattern.
They are capped from below at zero, while they can become arbitrarily large, at least in
principle, so their distribution is said to be skewed. This is typical of most commodities. This
has implications for risk management, discussed later.
Much like spot prices have become more variable, forward prices for natural gas have also been
quite lively in the past few years. Figure 3 shows a few recent examples of the monthly forward
prices quoted at approximately 6-month intervals over the past two years. Consistent with spot
prices, forward prices have fallen recently by more than half from their peak in the middle of
2008.
3Figure 3
NYMEX Henry Hub Futures Settlement Prices
($/MMBtu)
16
June 27, 2008 Settlement
14
12
10
$/MMBtu
January 26, 2009 Settlement January 26, 2010 Settlement
8
6
4
Henry Hub June 25, 2010 Settlement
2 Monthly Bid
Week Prices
0
Jun-08 Dec-08 Jun-09 Dec-09 Jun-10 Dec-10 Jun-11 Dec-11 Jun-12 Dec-12
Source: Platts.
A longer term view of this change in forward prices, and their tendency to be more volatile in the
past few years than in the prior decade, is seen in Figure 4 below. It presents the average price
per MMBtu for the entire 12-month strip beginning in the first full month ahead of each trading
day.
4Figure 4
NYMEX Natural Gas 12-Month Average Future Prices
(April 1990 - June 2010)
15.0
Through 1999 2000 - Present
12.0
Future Price ($/MMBtu)
12-Month Standard Coefficient
Average Deviation of Variation
9.0 Through 1999 2.04 0.32 0.16
2000 to Present 6.28 2.31 0.37
6.0
3.0
0.0
0 2 4 6 8 0 2 4 6 8 0
r-9 r-9 r-9 r-9 r -9 r-0 r-0 r -0 r-0 r-0 r-1
Ap Ap Ap Ap Ap Ap A p Ap Ap A p Ap
Note: Null prices are omitted to adjust for market inactivity.
Source: NYMEX data obtained from Bridge & Bloomberg.
In this graph, the difference between the 1990s and the 2000s is even more dramatic than was the
case for spot prices. As seen in the summary box on the left of this chart, average annual
forward prices have been about three times higher in the past ten years, and the standard
deviation of forwards has been about seven times higher. Even in percentage terms, this is much
higher recent volatility; the coefficient of variation (standard deviation over mean) is more than
twice as high for the 2000s as in the 1990s.
In this context, efforts to hedge natural gas price risk have become much more important for
many but not all market participants. As we will discuss in this paper, there are many means of
hedging, and the hedging needs of market participants varies depending on their specific
circumstances. Those entities that face costs and revenues that are correlated (i.e., that tend to
vary together) may not need to hedge. Entities that have costs and revenues that move
independently (e.g., with costs driven by gas but revenues driven by an internationally traded
product affected by many other factors) may need to hedge to protect margins and simplify
operations. Correspondingly, there is no one standard extent or horizon for volatility reduction
that will be useful for all market participants. Market participants should be hedging to mitigate
exposure to specific problems that would emerge for their business if gas prices were to reach
extreme levels (either high or low). Since these problems differ among gas market participants,
the risk management programs they use will be specific to their situations. Hedging horizons
may also vary. A gas producer may be concerned about prices in the coming few years in order
5to cover well development costs, while an electric utility with a gas-fired peaking plant may only
be concerned about the next few days or weeks.
The increase in gas price volatility during the 2000s was accompanied by a general shift in
financial trading and management practices throughout the U.S. economy that resulted in a
heightened level of commodity and financial risk management in the United States. On the
demand side, following the first of the major gas price spikes in the winter of 2000-2001, several
state regulatory commissions launched investigations into the risk management practices of the
gas distribution or electric utilities they regulated, with an eye towards understanding the ability
of utilities to mitigate customer exposure to natural gas price volatility. This was a particularly
big issue given the tendency of gas utilities to procure gas at monthly index prices (rather than
under fixed price contracts) and the predominance of purchased gas adjustment clause (PGA)
mechanisms that allowed most U.S. gas utilities to pass through their gas costs to customers.
Several utilities started or expanded their hedging programs, to the point where now the majority
of gas distribution companies use some hedging.3 Also contributing to a growing demand for
hedging was the shift in the late 1990s towards vertical unbundling and retail access (supply
competition) in the electric utility industry. This created a need for tools to mitigate the very
high volatility of wholesale spot power markets. Gas hedging was particularly useful, because
natural gas is often the marginal, price-setting fuel in power markets. On the supply side, many
major financial institutions, often investment banks, became very active in supporting this need.
The price spikes over the past decade highlight an intriguing issue for the natural gas industry: Is
the price volatility experienced over the past decade anomalous, or is that what we should
consider normal? If it was an anomaly brought about by ill-conceived practices and misguided
expectations in other sectors of the economy, then perhaps we can look forward to a period of
future calm. On the other hand, that calm period from around 1985-2000 is considered by many
economists to be a period of over-supply induced in large part by how we deregulated wellhead
gas production—making the low volatility largely a result of these non-repeatable conditions,
and making the most recent decade seem the more normal.4
Today we appear to be experiencing another period of at least temporary over-supply due to:
1) the shale gas boom that is now occurring as a result of technological breakthroughs in
horizontal drilling and hydraulic fracturing,
2) excess LNG capacity caused by fears that U.S. gas supplies were becoming quite tight,
and
3) the economic crisis and resulting reductions in gas demand.
3
A 2006 AGA survey found that 87% of the responding companies used financial instruments to hedge at
least a portion of their supply purchases (compared to 55% three years earlier). See “LDC Supply
Portfolio Management During the 2005-2006 Winter Hearing Session”, American Gas Association,
September 7, 2006.
4
Another factor that many economists believe contributed to the calm period in the 1980s was the
Powerplant and Industrial Fuel Use Act of 1978. The Fuel Use Act restricted the construction of natural
gas-fired power plants and industrial use of natural gas, thereby limiting demand for natural gas in the
United States. Portions of the Fuel Use Act were repealed in 1987, allowing new development of gas-fired
power plants and increased industrial use of natural gas.
6This shale boom may not have yet reached its own “typical” conditions, since there has been
competition to claim and develop leasehold properties at a rate somewhat above what may have
been otherwise economic. Nonetheless, there is considerable optimism that we may be going to
enjoy decades or more of moderately priced gas from this non-conventional source. Onshore
shale supply sources may also make us less dependent on Gulf Coast supplies that are
particularly susceptible to hurricane damage, reducing future exposure to the types of hurricane-
induced price spikes that were experienced in 2005. In addition, shale gas supplies could reduce
basis values in some market areas, such as the U.S. northeast. Likewise, we are not yet able to
say much with confidence about the rate and potential breadth of economic recovery. Several
public policy initiatives will impact gas market prices and risk, including climate policy
legislation, renewable electric generation, tightening air quality regulations that could cause coal
plant shut-downs due to the high costs of compliance, demand conservation programs, and R&D
support for technologies such as compressed natural gas vehicles, electric vehicles, fuel cells,
and the like. Time will tell whether we are in a new norm of comfortable, deep supply and low
risk comparable to the 1980s and 1990s or in a long period of technology and market
adjustments that are likely to be reflected in volatile conditions such as were seen throughout the
past few years. At the very least, it would be safer to be prepared for the latter and be happily
surprised if the former occurs.
This paper reviews the tools and techniques for managing natural gas price volatility, and
discusses how the use of these techniques tends to vary across different types of market
participants in the natural gas industry. We begin by discussing the concept of volatility more
formally and by describing some of the typical characteristics of gas price risk. We then
describe the essential concepts behind risk management and discuss the limitations of risk
management programs. We also provide case studies of hedging programs to highlight the
differing objectives of these programs depending on their specific purpose.
7II. GAS MARKET RISK CHARACTERISTICS
VARIABILITY VS. VOLATILITY
Formally, “volatility” as the term is used for risk management is not a measure of variability, but
a measure of unexpected variation around a mean, a trend, or other known and foreseen patterns.
If a contract has a price that varies from month to month according to some fixed and a priori
known amounts, that variation is not volatility. It is simply riskless, known variability. For
instance, the seasonality seen in monthly forward prices is a source of cost variation for a party
holding either side of the contract, but it is not a source of risk or volatility. More generally, if a
commodity has typical seasonality, the portion of that seasonality that is already reflected in
forward prices is not volatility, but the deviations from those expectations that occur are
volatility. Likewise, the changes in the level and shape of the forward strip from day to day are
unexpected and are a source of volatility. The measure of volatility will depend on the time
frame of interest (e.g., daily or monthly gas prices, or a longer period), the time period spanned
by each observation, and how expected variation has been removed from the data.
This distinction between variability and volatility may be irrelevant to some gas users. In
particular, end-users of a gas distribution company will likely have little idea of what the
forward-price expected seasonality is, and instead may regard the monthly increases in the winter
as a source of risk, or at least a nuisance. So it may be useful to study both overall variability
and volatility, depending on the purposes for gas price risk management. One way of thinking
about the distinction is that nothing can be done with hedges or risk management strategies to
eliminate the expected variability. A forward contract for next winter will inherently reflect a
seasonal premium, albeit perhaps a different one depending on when the contract is struck. All
that a hedge can do is limit the unexpected variation around that expected seasonal price. On the
other hand, much can be done with financing strategies to redistribute expected seasonal
variations over time. For instance, it is possible to find a financial market participant in gas
trading who will levelize the annual strip of monthly forwards for a premium that reflects the
interest carrying costs of selling at one price while buying at another. Technically, this is not
risk management, just financial contracting. We will not discuss this aspect of variability
smoothing further, instead just focusing on what can be done about the unexpected price
movement ranges.
Price volatility vs. Returns volatility
It is also important to distinguish absolute price volatility from percentage volatility. As was
shown in Figure 4, both the levels and standard deviations of prices have increased in the past
few years. If both had increased proportionately, there would be no increase in the amount of
risk per dollar of forward obligation. This distinction is captured by measuring volatility in
terms of “returns” rather than absolute price movements, where returns are the percentage
change from day to day in the given contract. Mathematically, they are calculated as the natural
logarithm of the ratio of today’s price over yesterday’s price. These return distributions take out
the effects of the price levels changing in proportion with the variability. They also tend to
8eliminate the skewness of price distributions. Figures 5 and 6 below demonstrate this. Figure 5
is a histogram of how frequently various daily price levels have occurred in the Henry Hub daily
spot price over the last 20 years. It is skewed to the left, in part because prices cannot fall below
zero, so there is a lower bound. However, this distribution has a long “tail” to the right,
indicating that high price levels can occasionally occur, infrequently, but unlimited in principle.
Figure 5 Figure 6
Histogram for Henry Hub Spot Price Data Histogram for % Daily Henry Hub Price Changes
(1991 through 2010) (Returns)
1,200 1,200
1,000 1,000
O bservations
O bservations
800 800
600 600
400 400
200 200
0 0
0 1 2 3 4 5 6 7 8 9 10 11 12 13 14 15 16 17 18 19 -25% -20% -15% -10% -5% 0% 5% 10% 15% 20% 25%
Source: Platts, Gas Daily. ($/MMBtu) Source: Platts, Gas Daily.
Figure 6 takes the exact same data and expresses it in terms of % daily changes, i.e., returns, and
the result is a very symmetric distribution that has the familiar bell shape.
The distributions of returns for many commodities is in fact normally distributed, which means
the corresponding price distributions are “lognormally” distributed – i.e., their logarithms are
normally distributed. Lognormality means that a 10% price change for a given time interval is
equally likely regardless of whether the prevailing price is low or high. As a result, a trader can
use the same strategy to hedge a $100 worth of exposure to forward gas positions regardless of
whether the forward price is high or low. Most risk management techniques utilize tools
focusing on returns rather than price levels. This is because the analytics are cleaner and because
energy traders are usually interested in the risk per dollar invested or per exposed dollar, rather
than the absolute variability they may face. Their counterparties who will sell them hedges are
similarly inclined. It is also easier analytically to deal with normal distributions, which returns
have. For instance, it allows the standard deviation (of returns) to characterize the shape of the
whole distribution, while other terms (such as measures of skewness) are needed for price
distributions. To manage total financial exposure, return risk can be translated back into dollar
terms.
On the other hand, the absolute, price-based measure of risk (as shown in the standard deviation
of prices) is likely to be what matters most to end-use customers who pay for each MMBtu that
they purchase. This may also be the most relevant metric for long-term investment planners.
End-use customers, including those who are making investments in gas-using equipment, are
concerned about the absolute risk surrounding potential dollar outlays (e.g., is there a chance a
customer will pay $8.50/MMBtu versus an expected payment of $6.25/MMBtu). Likewise, an
end-user who burns gas as an input or feedstock and cannot pass through increases in the price of
9gas in the sale of their final product (e.g., due to competition, as in the fertilizer industry) will
also probably be interested in absolute price volatility. Such an end-user will likely have a sense
that a $1/MMBtu increase in the price of gas will adversely affect profits by some amount.
When one reviews the history of returns and their volatility for gas securities, a somewhat
different interpretation of gas risk emerges. Figure 7 shows the rolling average of historical
standard deviations in daily gas price returns at Henry Hub, comparable to Figure 2 above that
was based on actual price movements. In Figure 2, the standard deviations had clearly increased
markedly in the past few years, while that is less so for returns.
Figure 7
Yearly and Quarterly Rolling Volatility of Returns
0.30
One
0.25 quarter
(62 day)
0.20 trailing One year
(% Change)
(250 day)
0.15 trailing
0.10
0.05
0.00
Jan-92 Jan-95 Jan-98 Jan-01 Jan-04 Jan-07 Jan-10
Source: Platts, Gas Daily.
While there is still a clear increase in return volatility over the past two decades, it is more like a
doubling of risk than an increase of four to ten times, such as was seen in the raw prices.
GAS MARKETS AND AVAILABLE HEDGING CONTRACTS
In U.S. gas markets, physical gas is typically traded on a monthly or daily basis at roughly 70
locations throughout the country. Even longer-term contracts are for fixed or specified volumes
but with pricing provisions that usually index the unit cost of gas under the contracts to one of
the monthly price indices that are published by leading gas trade publications (e.g., Gas Daily or
Inside FERC). The index publishers will survey market participants that trade fixed price gas on
10either a monthly (bidweek) or daily basis and publish an index that reflects the average gas price
among the fixed price deals that were transacted and reported to the trade publication in its
monthly or daily survey.
The benchmark price location in U.S. gas markets is the Henry Hub in Louisiana. Henry Hub is
a location where there is physical gas trading (for buyers that want to take delivery of the
physical product). It is also the location of the standard gas futures contract that is traded on the
New York Mercantile Exchange (NYMEX), which is a financial product traded among buyers
and sellers who do not usually make physical delivery of natural gas. All NYMEX natural gas
contracts are for 10,000 MMBtu, for delivery to the Sabine Pipe Line Co. at Henry Hub in
Louisiana. Natural gas futures contracts are tradable contracts that can be bought or sold today
for delivery of gas sometime in the future. Specifically, gas futures contracts are traded for
forward months, ranging from 1 month to 120 months forward (although there is often little
trading of futures contracts past 36 months forward).
Gas trading at other U.S. locations (outside of Henry Hub) may trade either at prices that are
higher or lower than Henry Hub, depending on regional market conditions and available
transmission capacity between locations. These positive or negative differentials to Henry Hub
are known as “basis differentials,” which tend to vary seasonally. Basis swap contracts are
traded for many locations that allow market participants to lock in a transportation cost from
Henry Hub to the receipt location.
Basis risk is an important consideration in U.S. gas markets since the price differentials between
different locations can vary significantly over time, sometimes (albeit rarely) as much or more
than the volatility in prices at Henry Hub. This is especially likely if there are constraints on
pipelines at periods of high demand, such as during the winter or after a major weather
disruption such as a hurricane, that can cause price spikes in destination markets. Some market
participants are able to avoid the risk of these types of constraints by purchasing storage in
market areas, where it is available. Basis differentials can also vary over time as a result of new
pipeline construction and new sources of supplies entering new markets. A recent example is the
decline in the west to east differentials in the U.S. that have occurred as a result of the
construction of the Rockies Express and other pipelines.
An example of changing basis differentials is seen in Figure 8 below showing the basis between
New York (Transco Zone 6) and Henry Hub.
11Figure 8
Transco Zone 6, N.Y. - Henry Hub Basis Differential
($/MMBtu)
April 2009 - November 2009 - April 2010 -
October 2009 March 2010 June 2010
[1] [2] [3] [4]
Transco Zone 6, N.Y. Average Price [a] 3.86 6.18 4.62
Transco Zone 6, N.Y. Standard Deviation [b] 0.62 2.35 0.42
Henry Hub Average Price [c] 3.49 4.86 4.27
Henry Hub Standard Deviation [d] 0.54 0.94 0.40
Zone 6 - Henry Hub Average Basis Differential [e] 0.37 1.32 0.35
Zone 6 - Henry Hub Standard Deviation [f] 0.16 1.67 0.06
Zone 6/Henry Hub Correlation [g] 0.97 0.81 0.99
Sources:
[2], [4]: Platts, Gas Daily.
Figure 9 below presents this basis price behavior on a daily basis for every day over the past
year.
Figure 9
Transco Zone 6, N.Y. - Henry Hub Average Basis Differential
(April 2009 - June 2010)
9.0
8.0
7.0
6.0
($/MMBtu)
5.0
4.0
3.0
2.0
1.0
0.0
Apr-09 Jun-09 Aug-09 Oct-09 Dec-09 Feb-10 Apr-10 Jun-10
Source: Platts, Gas Daily.
12Noteworthy here from a risk perspective are the occasional extreme levels. Most of the time, the
basis is pretty low and pretty stable, but it has skyrocketed to several dollars per MMBtu under
conditions of tight supply.
FORWARD PRICE RISK PREMIUMS
Standard gas futures contracts are traded for up to 120-months forward (although in practice
most trading is for the coming 1-36 months). Continuously throughout each day, market
participants can see the price for each forward month’s contract. As previously demonstrated,
forward prices move around considerably from day to day as expectations about the future
change. Some traders believe this variability necessarily implies that there will be some kind of
risk premium implicit in the price at which buyers and sellers will agree to trade forward, but this
is not necessarily correct. There can be a premium, but it is not necessarily for risk and it is not
always even positive. This view probably arises largely because it often is the case that forward
prices turn out to be higher than spot prices. While this could be due to a limited supply of
willing forward sellers, or buyers’ desperation for hedges to offset problems they face if gas
costs should exceed their budgets, it is more likely that this pattern is a result of skewness of spot
prices. In equilibrium, forward prices have to be a good alternative to the full range of possible
spot prices. As was shown in Figure 5, that distribution is skewed, with some small chances of
very high prices. Most of the time, the high price outcomes do not occur -- but the forward price
has to reflect that possibility. Thus, the expected future spot price is above the mode (most
likely) price, so the realized spot price will usually be below the prior forward prices. This is not
a premium for risk, just a forward reflection of the full range of potential spot prices.
Because this is not a true risk premium, it is not a cost of hedging that could be saved or avoided
by not hedging. That will be true often, but not all of the time, with no net advantage over the
long run. This is akin to the fact that you cannot expect to save money over the long haul by not
insuring your house. It is true that you will have many years of not paying for the insurance, but
they will be wiped out if/when your house burns down.
VOLATILITY TERM STRUCTURE
Much as forward prices can have a term structure, i.e., a slope that reflects whether future
conditions are expected to be tighter or looser than current markets, volatility also has a shape
over time, which is also called its term structure.
Volatility term structure refers to the relationship between price volatility and time to (and of)
delivery. The relationship is generally a declining one, meaning that the volatility of near-term
contracts tends to be higher than out-month contracts, which decay to a steady lower long-term
level. The volatility of forward month contracts is a measure of the amount of uncertainty
foreseen in the potential changes in prices for a future delivery month between now and the
delivery time. Obviously these amounts could (and do) vary by delivery month. They also vary
by time until delivery, as explained further below. They can be calculated using historical
futures price data (by calculating the standard deviation of daily settlement prices for contracts
that are one month out, two-months out, etc.), on the assumption that historical patterns are
13recurring. Or they can be inferred from forward option prices (that is, using option pricing
models, from which implied volatilities for forward month contracts can be calculated).
An example of this volatility term structure relationship for gas is shown below in Figure 10,
which plots the annualized broker-quoted volatilities as of April 2010 for the 24 month forward
period. The seasonality of volatility generally corresponds to the price term structure (i.e., with
forward winter prices displaying higher volatility). This figure also shows that the prompt month
contracts tend to have the higher volatility than the more distant delivery dates. This is a result of
“mean reversion”, a property found in many commodities.
Figure 10
Implied Volatility as of April 2010
Using Henry Hub Nymex Futures & Options
60%
Implied Volatility from Call Options
50% Volatility Fit without Seasonality
Annual Volatility(%)
40%
30%
20%
10%
0%
May-10 Nov-10 May-11 Nov-11 May-12
Note: Assumes Black Scholes Option Pricing Model
to estimate annual volatility. Delivery Period
Mean reversion
Mean reversion refers to the tendency of gas prices to move back to a mean or typical level
following price shocks (either upward or downward) arising from relatively short-term, non-
persistent conditions. In the long-term, these shocks are dampened because both supply and
demand are more elastic over longer horizons. For example, a period of tight supplies and high
demand after a hurricane might lead to a price spike. But eventually, this price spike itself will
encourage repairs and possibly new production being brought on-line, and it may also induce
some demand destruction, such that prices eventually decline to a more normal level.
Conversely, a current fall in prices will tend to cause reduced production and/or heightened
demand, causing prices to climb back up. In general, there are many possible short term
14influences on market conditions that will affect prices for a while but are mostly inconsequential
over the long run. The long run price tends to reflect beliefs about long run marginal costs,
which is more sensitive to shifts in beliefs about systemic, large influences, such as changes in
technology or regulation. These beliefs generally change more slowly, so distant prices tend to
be less volatile. It is not unusual for the near term volatility to be several times higher than the
long run volatility.
This declining sensitivity with longer horizon is shown by the red, smoothly declining line fitted
to the monthly volatility quotes in Figure 10 above. Lower distant-period volatility does not
mean future obligations actually involve less total risk between now and their delivery dates than
near term obligations. Rather, it means that the variability over a given, short time frame (such
as over the next day or week) is lower per dollar invested in a long term obligation than in a near
term position. Cumulatively, over all the time remaining until the long term position is closed
out, it will have more total risk.
For risk management, the implication of mean reversion is that one can only use the current term
volatility structure to evaluate risks of portfolio positions that are unhedged or susceptible to
future value changes at that time. For instance, if forward positions are going to be procured in
periodic, regular installments over time, as many gas utilities do, then the risk associated with
pending future purchases will depend on when they are going to be made, not just the month they
will be covering. Fortunately, there are analytic solutions to how to make such adjustments.5
5
See for instance “Modeling and Estimating the Forward Price Curve in the Energy Market” by
Carl Chiarella, Les Clewlow, and Boda Kang, Quantitative Finance Research Centre,
University of Technology, Sydney, http://ideas.repec.org/s/uts/rpaper.html Research Paper number
260.
15III. RISK MANAGEMENT PRINCIPLES
Risk management refers to practices for: (1) forecasting and measuring the foreseeable range of
uncertainty in future costs and revenues, (2) simulating how alternative supply or sales portfolios
and hedging, procurement or sales practices (type, timing, and relative size of different kinds of
wholesale contracts and securities) could alter the range of future risks, (3) scheduling and
controlling for how procurement or sales occur and how they are adjusted over time in order to
keep the range of potential net costs or revenues within desired limits, and (4) monitoring and
evaluating performance through reporting mechanisms.
While these practices are widespread throughout many industries, and most of the natural gas
industry, there are some persistent misconceptions about risk management that are worth
addressing. In the remainder of this section, we discuss five key principles of risk management:
1) Risk management cannot change expected costs; it can only protect against problems
that arise at extremes, for a fair price
2) Risk management is not done for its own sake, but to protect against other indirect costs
that would arise when gas prices reach extremes
3) Hedging cannot remove all risks; in fact, it can involve its own new risks, such as credit
and liquidity difficulties
4) Ex-post comparisons of hedging results to alternative procurements or hedges are likely
to be poor indicators of performance
Principle #1: Risk management cannot change expected costs; it can only protect against
problems that arise at extremes for a fair price.
A common misunderstanding, sometimes aggravated by risk managers themselves, is that risk
management is undertaken as a way to reduce costs of the hedged items themselves. This is
incorrect. Hedging may help a company reduce other costs (see Principle #2), but the expected
cost of the hedged commodity itself will not be affected by risk management. Of course, after
the fact it will often be the case that hedged positions are cheaper than unhedged ones would
have been, but on average and in expectation that cannot be the case for fairly priced hedges.
Risk does not simply disappear under hedging. Rather, it is transferred to some third party, or
financed to smooth out cost or revenue variations over time. The proverbial saying is correct
that “there is no free lunch.” In order for a risk transfer to reduce or avoid costs for the hedge
buyer, then the hedge seller would have to be incurring the corresponding increase in its costs,
and this will not occur absent fair compensation – hence no net reduction in overall expected
costs.
In a competitive and active, liquid market, all the available hedging instruments and contracts
have (on any given day, for a given delivery period) the same expected cost and the same net
present value. If not, the speculators will move in and out of the mispriced alternatives until
their relative prices adjust to eliminate arbitrage opportunities. This parity is explicitly the case
for a forward contract for natural gas, which is a commitment to transact a fixed quantity of gas
at some date in the future at a stated price. That stated price has to cover, on a risk-adjusted
16basis, what the seller thinks the gas will be worth in the spot market at the delivery time, and this
is also the buyer’s alternative of going unhedged (i.e. buying in the spot market). So the contract
trades at a fair price which gives neither of the parties an expected gain or loss compared to not
hedging at all. For that reason, the contract has zero value on the day it is bought, and no money
is exchanged between the parties. They have each made offsetting future promises to each other
that are matched in value. Even if volatility is capped on just one side, as with option contracts,
that truncation of possible prices is obtained for an up-front price that covers its expected value.
Again, there can be no expected cost savings if the options are fairly priced.
So it is not reasonable to expect that hedging will lower one’s costs over time. Instead, hedging
is going to trim the extremes of potential outcomes without shifting the center. A graphical
example is provided below in Figure 11. The pink line shows the annual cost uncertainty facing
a buyer of natural gas who procures gas on a pure spot basis (i.e., under contracts that are
indexed to monthly spot gas prices) to supply its LDC customers. Specifically it shows the
probability of different levels of expenditures on yearly gas costs as foreseen 18 months in
advance of the delivery year. That buyer expects to spend a little over $1.1 billion on yearly
natural gas purchases, as seen by the dashed vertical line. The rest of the S-shaped curve depicts
the probability that the annual cost will be as low or lower than any given point on the x-axis.
Since this buyer is intending to go unhedged, there is a chance that realized natural gas prices
will be low and result in expenditures of $700 million (which has less than a 5% probability).
Or, they could be extremely high and cause expenditures of nearly $1.9 billion (with a 95%
chance that costs will not be this high, and a corresponding 5% chance they could be even
higher).
Figure 11
Annual Procurement Costs Under Hedged and Unhedged Strategies
1.0
0.9
Cumulative Probability
0.8 Open
0.7
0.6
0.5
0.4
0.3
0.2
0.1 Blended Strategy
0.0
$700 $900 $1100 $1300 $1500 $1700 $1900
Annual Costs, $ mm
17The green line shows how a hedging strategy changes these outcomes. This strategy involves a
procurement schedule that fixes some prices in advance through the use of regular, staggered
purchases of gas futures contracts over time in the months before delivery. This approach limits
both the downside and upside that could be experienced—but the expected cost is still the same.
However, while the expected costs are the same with or without the hedging strategy, the
distribution of potential outcomes has been reduced under the hedging program relative to being
unhedged. The probability of paying in excess of $1.5 billion is virtually nil under the hedge
program relative to the spot program. Likewise, the likelihood of spending less than $1.0 billion
under the hedged program is much less relative to the spot program.
An important caveat: this discussion of hedging instruments and their expected net present value
of zero assumes the products are traded in competitive markets where neither side has an
information advantage. Under some circumstances, this may not be the case. For instance, if a
very complicated, non-standard hedge is needed, there may be so few sellers that it is only
available at a premium to its intrinsic risk-shifting value. Likewise, it is possible that in such
complex situations, one side of the transaction will have superior information about the true risk.
If so, the hedges may have a non-zero expected value.
Principle #2: Risk management is not done for its own sake, but to protect against other indirect
costs that would arise if/when gas prices reach extreme levels.
If hedging in competitive markets has a zero expected value, why do market participants choose
to hedge at all? In fact, some gas industry participants with large exposures to gas prices have
chosen not to hedge. However, many market participants find that hedging is useful to prevent
some other problem or indirect cost (not embedded in the expected cost of gas itself) that arises
at extremes. Generally these indirect costs fall under the label of "costs of financial distress,"
with such manifestations as impaired credit ratings, lack of funds to pursue other needs or
opportunities, and administrative complexities of dealing with a highly unstable financial or
operating environment. The potential losses or inconveniences in those areas should be the
reason for the type and timing of gas hedging they pursue. Absent such indirect costs for a firm
or its customers, there is no real reason to hedge.
Note that these potentially significant indirect costs are not usually within the province of the
risk management group itself. The problems to be avoided must be identified by senior
managers of other functions. For example, a small natural gas producer might want to avoid a
cash flow shortfall that could arise if it did not hedge its future production and spot gas prices
were to fall dramatically. Such a cash shortfall might force the producer to cut-back its drilling
program or, in an extreme scenario, lead to financial distress in which the producer could not
meet its debt obligations. The producer might therefore hedge to lock-in a revenue stream in
order to manage its cash flow. On the other hand, a major integrated oil and gas company may
choose not to hedge its gas production if it is financially so strong that it can simply absorb the
variation in cash flow that comes from shifting spot gas prices.
18Thus, hedging is typically undertaken to obtain the benefits of reducing gas price volatility and
avoid some other problem that could arise from exposure to extreme gas price movements. This
means the proper amount of hedging does not just, or even primarily, depend on the risk
properties of the gas prices themselves. If that were the case, then all users of gas would hedge
in more or less the same way and to the same extent, since they would all see the same data and
the same opportunity.
This principle is very commonly misunderstood by public utility commissions, who often seem
to expect utilities to hedge simply because of the variability of fuel prices. They sometimes
regard hedging as a part of “least cost planning” -- the normal standard for utility regulatory
approvals. But except in this limited sense (of avoiding exposure to indirect costs), hedging and
risk management by regulated utilities are not related to least-cost planning. Least-cost planning
by utilities involves choosing between alternative supply (or conservation) options that have
equivalent benefits but different costs. Risk management involves choosing between different
hedging alternatives that have identical expected costs (ignoring minor transactions cost
differences) but different benefits, i.e. patterns of exposure to future risk. Utilities have always
been authorized and expected to pursue least-cost alternatives. In contrast, they almost never
have received guidance for how much to alter the benefit (risk management) attributes of their
services, because this has not been a traditional regulatory objective. The utility should work
with its regulators and major customer interest groups to decide how much risk management is
needed to adequately protect customers against their indirect costs of gas price volatility.
Principle #3: Hedging cannot remove all risks; in fact, it can involve its own new risks such as
credit and liquidity difficulties.
A risk management program provides some degree of protection from extreme price movements,
but it should not be expected to remove all the risk to which a gas market participant is exposed.
First, hedging is easiest when there is a fixed future volume of sales or supply that will be
needed. If the future needs are uncertain, it is almost impossible to hedge them precisely, except
by luck or by waiting until close to the time of need, when volume uncertainty has shrunk. This
means leaving the price risk open for quite a while. For a utility, this could happen in an extreme
weather scenario (such as an unexpectedly cold winter for an LDC, or a hot summer for an
electric utility) that requires the utility to purchase more spot supplies than expected.
Conversely, milder than average weather may make previously hedged volumes unnecessary,
such that they have to be dumped at spot prices for a loss.
A substantial hedging program will usually introduce some new risks even as it eliminates
others. In particular, it can create liquidity risks and counterparty performance risks, because
locking in very long-term purchases or sales creates credit and collateral risks surrounding
whether both parties to the transaction can and will perform, especially if market conditions shift
materially after the hedges were entered. Thus, a gas buyer entering into a long-term fixed price
contract at prices that end up being much lower than realized market prices will be exposed to
the risk that its counterparty will not perform under the contract. If the counterparty does not
perform, then the buyer will likely have to replace its expected purchases either from the spot
19market or with a new long-term contract at higher fixed prices. While the long-term fixed price
contract serves as a hedge against spot prices, it may become so valuable to the buyer as prices
rise (and become more and more in the money) that the seller may seek to repudiate the contract,
especially if it did not have its own hedges in place that reduced its risks in supplying the
contract. (Longer term hedges also involve more of the aforementioned volume forecasting
risk.) Even without performance defaults, if a hedge moves way “out of the money”, it may be
necessary to post a large amount of collateral to assure the counterparty that the transaction will
be completed. This credit posting can involve much bigger burdens on cash and liquidity than
would have prevailed by remaining unhedged, potentially even bankrupting the hedger.
Indeed, even if complete inoculation were possible, this should not be the objective of most
companies. Considerable human and financial resources are needed to manage risk well, and at
some point there are diminishing returns to doing more of it. For instance, the credit and
collateral risks of very long term hedging can consume some of a firm’s borrowing capacity or
restrict its use of slack cash, at the expense of other kinds of business growth that would have
otherwise been possible. Perhaps more importantly, if a firm is better than average at bearing
certain kinds of risks, it should not just tolerate those risks but actively seek them out to position
the firm for a strategic, competitive advantage in those areas.
Hedging programs are usually designed to cover risks up to a certain size with a certain
probability. If extreme events occur that are more dramatic than were anticipated or would have
been normal based on past patterns, then there will be open exposure. (See the later discussion
below about VaR and its detractors in Chapter V.) A hedge program is only as good as its
numerical inputs, and it is not easy to judge whether the key parameters are stable or not. If risk
conditions are shifting, a program designed for historical conditions may be inadequate.
Finally, hedges generally cannot eliminate ultimate exposure to long term, large, secular
influences on the economy or the industry as a whole. For instance, if/when CO2 pricing is
introduced as part of a climate protection policy, the price of CO2 will ultimately be reflected in
the price of natural gas. Although market participants may in the near-term be able to protect
themselves from short term changes in the value of gas due to CO2 by hedging gas prices, over a
period of years, the CO2 price must be more or less embedded in gas prices to reflect the penalty
that CO2 prices impose on natural gas and its associated emissions.
The main point is not that a particular risk is or is not mostly hedgeable, but that risk managers
must manage the understandings of their executives, investors, or regulators so that unrealistic
expectations are not imposed.
Principle #4: Ex-Post Comparisons of Hedging Results to Simple Alternatives Are Poor
Indicators of Risk Performance
Some companies assess the performance of their hedging programs by comparing the after-the-
fact results to simple alternative procurement schemes, such as all-spot procurement. For
instance, a company may look back at the prior year’s hedging activities and calculate its total
annual gas procurement costs (including any hedging gains or losses) and compare them to a
20program of indexed purchases (either at monthly or daily index prices, or a combination of the
two). These types of comparisons over short-term periods (such as a year) are not likely to be
very useful in two respects. First, they can create false impressions of the performance of the
program. Consider a utility that hedges and fortuitously achieves costs that are much lower than
a spot procurement program. The comparison may create two, damaging false impressions: 1)
that risk management can be expected to lower costs or raise profits because of commodity
savings, and 2) that the responsible risk managers are exceptionally talented and should be
expected to repeat that kind of beneficial performance next year. Unless the organization was
explicitly and intentionally speculating that it had found a mis-valuation among gas contracts of
different types, it is much more likely that what really happened was lucky timing of hedging
prior to an unexpected price spike.
There is nothing wrong with that happy outcome, but it is not the point of the hedging, nor the
right way to evaluate the success of the risk management efforts. It is better to keep the focus on
whether the program continually adhered to its ex ante risk objectives, targets, limits, reporting
and controls rather than on how attractive its ex post results turned out to be. That is, the
important question will not be whether the hedging program achieved gains or losses, but
whether the program had the effect of keeping procurement within the intended risk boundaries
that were established prior to the implementation of the hedging program. To the extent ex-post
comparisons are used, they should be used over long time-periods that will reveal how the risk
program succeeded in reducing gas price volatility across a wide range of market circumstances,
not just the most recent annual outcome.
This discussion is not to suggest that historical reviews have no place in a risk management
program. One key question to ask is whether the assumed (simulated) risk parameters describing
the market have shifted over time. If risk limits were occasionally exceeded, does this call for a
new risk strategy, or just updated forecasts of input parameters? One place where it is especially
useful to consider historical information pertains to correlation assumptions. Often, gas users are
concerned about the correlation of prices at different locations, or across certain types of energy
conversions. In particular, power producers that hedge a spark spread (the electricity margin
over fuel costs) may want to understand historical correlations between electricity and gas and
consider whether these historical correlations will hold to the same degree going forward. Gas
marketers selling at citygate locations and buying at Henry Hub may likewise want to consider
correlations between Henry Hub and citygate prices in their consideration of hedging the basis or
locational difference. Structural analyses of historical versus forecasted conditions, and
statistical analyses of how those conditions have affected correlations, may inform when and
how to revise parameters.
21IV. TOOLS FOR MANAGING NATURAL GAS PRICE VOLATILITY
There are many tools available to market participants who want to manage gas price volatility.
These can generally be categorized as either physical, financial, or non-standard. The various
hedging tools have different time horizons typically associated with them, as summarized in
Figure 12. The remainder of this section provides more information on their advantages and
limitations.
Figure 12
Time Horizon of Alternative Hedging Instruments
Physical Financial Non-Standard
• Storage • Futures, swaps • Swing, peaking, no-notice
Short-Term • Fixed-price contracts • Options, collars provisions in physical contracts
(< 1 year)
• Changes in production • Weather derivatives
• Fixed-price contracts • Futures, swaps • Outsourcing of physical supply
• Options, collars portfolio
Medium-Term • Alternative price arrangements
(1-5 years) in physical contracts
– Caps/floors
– Index Averaging,
S-curves
– Base prices indexed to
other commodity prices
• Fixed-price contracts • Liquidity issues with available • Outsourcing of physical supply
• Reserves ownership products portfolio
Long-Term • Alternative price arrangements
(6+ years) in physical contracts
– Caps/floors
– Index Averaging,
S-curves
– Base prices indexed to
other commodity prices
Physical Tools
Storage
There are two main physical hedging tools available to gas market participants. The first is the
use of natural gas storage as a within-year hedge on seasonal or shorter term price movements.
Utilities expecting winter prices to be higher than summer prices (given that winter is the peak
demand period in U.S gas markets) will purchase natural gas in the summer, inject the gas into a
22You can also read