MANITOBA OPERATIONS VALE LIMITED EXTERNAL AUDIT OF MINERAL RESERVES VOLUME 2, SECTION 2 - Mining Data Online
←
→
Page content transcription
If your browser does not render page correctly, please read the page content below
Effective Date: 30 June 2010

         VALE LIMITED

         EXTERNAL AUDIT OF MINERAL RESERVES

         VOLUME 2, SECTION 2

         MANITOBA OPERATIONS
         Submitted to:
         Vale Limited
         2060 Flavelle Blvd, Sheridan Park
         Mississauga, Ontario
         Canada L5K 1Z9
REPORT

         Report Number:           10-1117-0032 Phase 2000
         Distribution:
         1 e-copy: Vale Limited
         1 e-copy: Golder Associates Ltd.
MANITOBA OPERATIONS AUDIT Executive Summary Golder Associates Ltd.’s (Golder) Competent Persons, David Sprott, P.Eng., and Paul Palmer, P.Eng., P.Geo., have visited the Manitoba Operations Project the week of July 5, 2010 and validated that part of the mineral resource that is the basis for the following mineral reserve estimate as at June 30, 2010 for the Manitoba Operations Project. During the site visit, they inspected mining operations, interviewed personnel and gathered information required to evaluate the appropriateness of the data and methodology used to estimate the mineral resources and mineral reserves. A list of people contacted for this study includes: Rob Smith – Manager – Mines Geology, Manitoba Operations Jean-Yves Cloutier - Director Mineral Reserve Mineral Resource, Vale Business Planning Group Rob Stewart – Manager – Exploration TNB, Vale Business Development Glen House – Senior Geologist, Mines Exploration Brenda Bilton – Resource Geologist, Mines Exploration Al Proulx – Chief Mine Geologist T-3 Mine Dave Babulic – Chief Mine Geologist Birchtree Mine Tim Mayor – Chief Mine Geologist T-1 Mine Janet Southern – Resource Geologist Birchtree Mine Angie Pavetey – Resource GIT T3 Mine Holly Davidson – Resource Geologist T1 Mine Joan Ledwos – MEBS Database Technician, Exploration TNB, Vale Business Development Amy Byers – Process Engineer Stu Waring – General Manager, Mining and Milling, Manitoba Operations Faye Pilling – Senior Metals Accounting Specialist Cal Liske – Manager – Mines Engineering, Manitoba Operation Gord Bilton – Planning Engineer T1 Mine Inge Robinson – Divisional SupervisorT1 Mine Cecile Kelly – Chief Mine Engineering Supervisor Birchtree Mine Luc Kempers – Divisional Supervisor T-3 Mine Steve Peterson – Chief Mine Engineer T3 Mine Warren Brass – Mine Manager T1 Mine Darren Dodds – Manager Finance Effective Date: June 30, 2010 Report No. 10-1117-0032 Phase 2000
MANITOBA OPERATIONS AUDIT

This study includes a review of technical reports, memoranda and supporting technical information obtained from
Vale. Reports on previous internal and external technical reviews and audits were also made available to Golder
(e.g. an independent audit by Scott Wilson Roscoe Postle Associates Inc. carried out in December 31, 2007).

The mineral reserve estimates provided to Golder were expected to conform to the requirements of the
Securities Exchange Commission’s Industry Guide 7 and to Canadian National Instrument (NI) 43-101 using
specific terminology from CIM (2004). No exceptions were found to these requirements.

The mineral reserve statement at June 30, 2010 for Vale was audited by Golder. The mineral reserve audited by
Golder was based on the mineral resource models and was prepared using costs, optimization, mine design and
scheduling practices that are appropriate. Golder accepts the procedure adopted to convert the mineral
resource into a mineral reserve. The numbers are appropriate for the purpose of public reporting in that they
provide an acceptable prediction of the available mineral reserves. The tonnes and grades are reported at an
appropriate economic cut-off grade based on documented costs and prices.

The following table with the mineral reserve figures are provided at the appropriate level of precision for public
reporting.

                               Manitoba Operations Mineral Reserves June 30, 2010
                                                                   Tonnes
                  Mine                       Category                                 % Ni            % Cu1
                                                                   (000’s)

                                        Proven                         2,753             1.83            0.10

                  Birchtree Mine        Probable                       2,500             1.53            0.08

                                        Proven +
                                                                       5,254             1.69            0.09
                                        Probable
                                        Proven                         5,199             1.98            0.12

                  Thompson              Probable                      14,470             1.64            0.10
                  Mine
                                        Proven +
                                                                      19,669             1.73            0.11
                                        Probable
                                        Proven                         7,952             1.93            0.11

                  Total Manitoba        Probable                      16,970             1.63            0.10
                  Operations
                                        Proven +
                                                                      24,923             1.72            0.10
                                        Probable
                 Notes:
                 1. Cu reserves are based on historical factors derived from corrections between Ni and Cu in assay
                     data of diamond drill core. Thompson Mine has validated the factors by reconciling with mill
                     credited production numbers over a 5 year period.

Effective Date: June 30, 2010
Report No. 10-1117-0032 Phase 2000
MANITOBA OPERATIONS AUDIT
Significant Opinions
Tailings facility capacity: A number of options for long-term management of the tailings area were
reviewed and a three-phase capital plan was developed. To date, only two phases have been
initiated. The third phase of the basin capital plan is to raise dam levels by approximately 10 ft
(3 m). Once the final capital project phase is approved and all three projects are successfully
implemented, these changes are expected to increase the life of the tailings basin to support the life
of mine of the plant site, maintain compliance to MMER, and improve the closure plan for the
facility. Therefore, in order to support the life of mine plan, all three phases will need to be
implemented.
Sulphur dioxide reduction at the smelter complex: The Manitoba Operations (MO) is required to
meet government regulations proposed which requires that the smelter and refineries reduce their
greenhouse gas emissions by 18% by 2010 and by 2% year upon year until 2020. These
requirements may result in the closure of the smelter and refinery if an economically and
technically feasible solution for reducing emissions cannot be devised. However, evaluations have
shown that the MO would remain economic as a mine-mill operation that sold concentrate to
smelters located elsewhere (either owned by Vale or third parties.
Infrastructure Issues: The 3600 Tram is recognized as a future bottleneck to production at the
Thompson Mine and studies are ongoing to address this issue. As both the Thompson and
Birchtree Mines go deeper, the delivery of key mine services like backfill and ventilation will incur
greater challenges and costs. Cemented rockfill is currently planned to be the predominant backfill
for future mining.
Maintaining current production rates at the MO has been challenging due to ground instability
issues at the Birchtree Mine and infrastructure inefficiencies from moving personnel and material in
the 1D area.
Sample assay data is being entered in manually through exporting CSV files into the database.
Control checks are completed regularly, but were done by manual checks of spreadsheets.
Opportunities to improve the process are being used at other Vale operations (Ontario and VINL)
and should be considered at the MO.
A small portion of older mineral resources were estimated using polygonal models and have not
been updated using block models and the MO Mineable Reserves Optimizer process. Areas
supported by polygonal models under estimate tons and over estimate grade. This was noted at
the T1 Mine where mined grade in the current year was lower than the stated mineral reserve grade
for particular blocks. It was suggested that this was due to the polygonal estimation method.
A review was completed of the SRK pit design pre-feasibility reports and an update to the economic
pit shells may be warranted given changes to metal price and exchange rate.
The cash flow forecast review showed that positive project economics support conversion of
mineral resources to mineral reserves. A sensitivity analysis indicated the NPV remained positive
in all cases tested, suggesting robust project economics.
Effective Date: June 30, 2010
Report No. 10-1117-0032 Phase 2000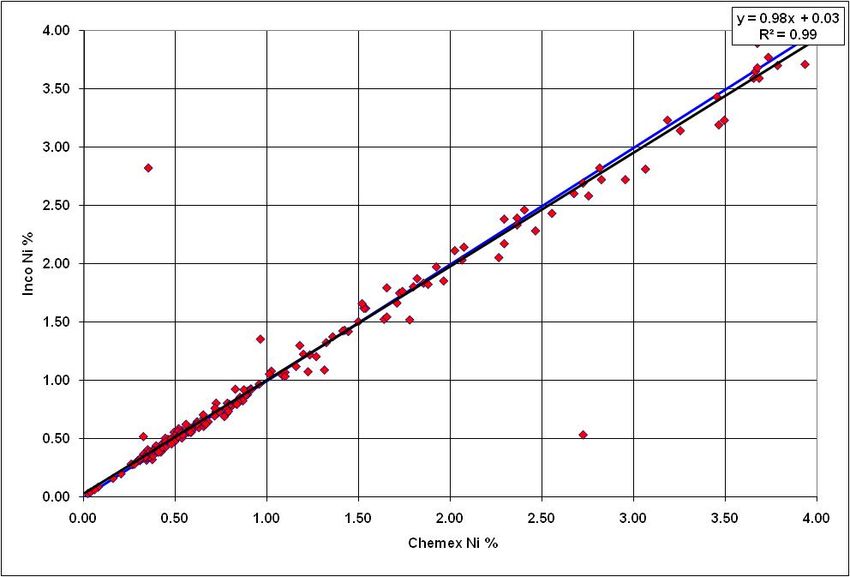
MANITOBA OPERATIONS AUDIT

Table of Contents

2.0   MANITOBA OPERATIONS ........................................................................................................................................... 2-1

      2.1        Location ............................................................................................................................................................ 2-1

      2.2        Ownership ........................................................................................................................................................ 2-1

      2.3        Land Tenure and Mining Rights ........................................................................................................................ 2-1

      2.4        Infrastructure .................................................................................................................................................... 2-4

      2.5        Production Process and Products..................................................................................................................... 2-5

      2.6        Metal Recoveries .............................................................................................................................................. 2-5

      2.7        Market............................................................................................................................................................... 2-6

      2.8        Historic Production............................................................................................................................................ 2-6

      2.9        Geology and Mineral Deposits .......................................................................................................................... 2-8

      2.10       Exploration and Development Drilling ............................................................................................................. 2-16

      2.11       Deposit Sampling Methods and Data Management........................................................................................ 2-17

      2.12       Mineral Resource Estimation .......................................................................................................................... 2-23

      2.13       Mineral Reserve Estimation ............................................................................................................................ 2-33

      2.14       Reported Mineral Reserves ............................................................................................................................ 2-42

      2.15       Reconciliation and Reserve Audits ................................................................................................................. 2-43

      2.16       Environmental ................................................................................................................................................. 2-48

      2.17       Community and Government Affairs ............................................................................................................... 2-49

      2.18       Operating Costs .............................................................................................................................................. 2-49

      2.19       Capital Costs .................................................................................................................................................. 2-51

      2.20       Taxation .......................................................................................................................................................... 2-52

      2.21       Economic Evaluation of Mineral Reserves ..................................................................................................... 2-52

      2.22       Mine Life ......................................................................................................................................................... 2-55

Effective Date: June 30, 2010
Report No. 10-1117-0032 Phase 2000                                                     2-i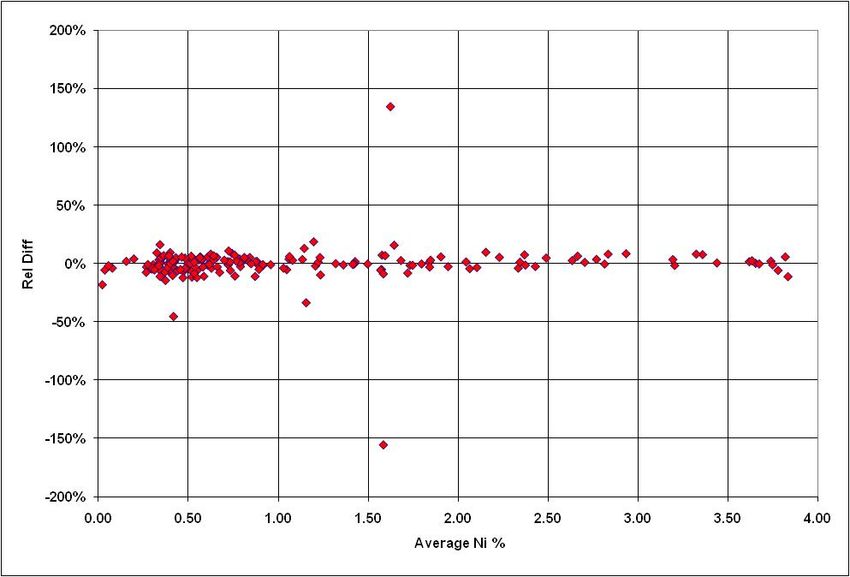
MANITOBA OPERATIONS AUDIT

TABLES
Table 2-1: OIC Leases ............................................................................................................................................................ 2-2

Table 2-2: Mineral Leases ....................................................................................................................................................... 2-3

Table 2-3: Average Recoveries for Major Metals at the MO (Based on 2010 Average Plan Grades) ..................................... 2-6

Table 2-4: Historic Production - 2007 to June 30, 2010 .......................................................................................................... 2-7

Table 2-5: MO Diamond Drilling (January 1 to December 31, 2009)..................................................................................... 2-16

Table 2-6: MO Diamond Drilling (January 1 to June 30, 2010) ............................................................................................. 2-17

Table 2-7: Thompson Mine Polygonal Parameters ............................................................................................................... 2-26

Table 2-8: Birchtree Mine Polygonal Parameters .................................................................................................................. 2-26

Table 2-9: Block Model Details Thompson Mine ................................................................................................................... 2-27

Table 2-10: Block Model Details Birchtree Mine.................................................................................................................... 2-28

Table 2-11: Thompson Mine Search Ellipse Dimension (ft) .................................................................................................. 2-29

Table 2-12: Birchtree Mine Search Ellipse Dimension (ft) ..................................................................................................... 2-29

Table 2-13: Thompson Mine Geostatistical Interpolation Methods ........................................................................................ 2-31

Table 2-14: Birchtree Mine Geostatistical Interpolation Methods .......................................................................................... 2-31

Table 2-15: Average Productivities for the Two Mining Methods (Tons per Manshift) .......................................................... 2-35

Table 2-16: Summary of Mining Rates for the MO (2010 LOM Plan, Actuals to June 30) .................................................... 2-37

Table 2-17: Summary of Actual Mining Rates for the MO (Wet Tons per day)...................................................................... 2-37

Table 2-18: Manitoba Operation Mineral Reserves June 30, 2010 ....................................................................................... 2-42

Table 2-19: Manitoba Operation Mineral Reserves 2006-2009 (Tonnes in 000’s) ................................................................ 2-43

Table 2-20: Mined Grade and Ni Production for MO for June YTD versus Plan ................................................................... 2-43

Table 2-21: Actual versus Plan Mined Grades and Ni in Ore Production for the MO ............................................................ 2-45

Table 2-22: Golder-Vale Block Model Comparison ............................................................................................................... 2-48

Table 2-23: Cash Operating Cost Summary ......................................................................................................................... 2-50

Table 2-24: Total Mining Cash Costs for the MO .................................................................................................................. 2-50

Table 2-25: Total Mining Cash Costs for the MO ($ per wet Ton) ......................................................................................... 2-51

Table 2-26: Capital Cost Schedule for Five-Year Plan at the MO ($000’s) ........................................................................... 2-51

Table 2-27: Five-Year Mine Production for MO (Wet Tons Mined from LOMP 2009) ........................................................... 2-55

Table 2-28: Five-year Ni production for MO (Lbs Ni in Ore from LOMP 2009) ...................................................................... 2-55

Effective Date: June 30, 2010
Report No. 10-1117-0032 Phase 2000                                                     2-ii
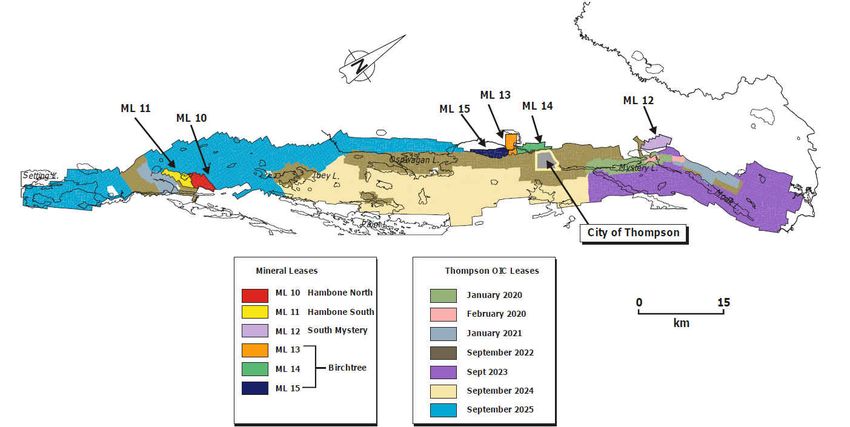
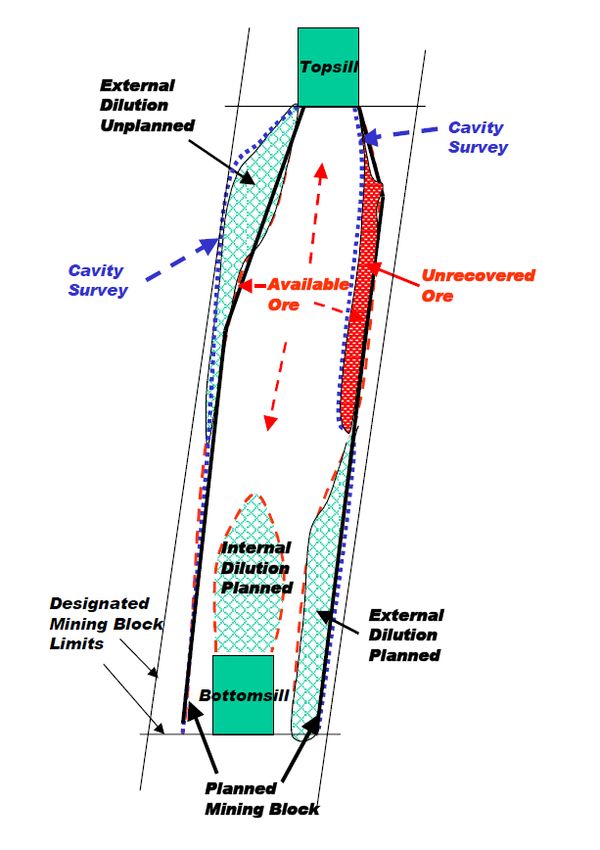
MANITOBA OPERATIONS AUDIT

FIGURES
Figure 2-1: Location of the MO and Mining Leases ................................................................................................................. 2-1

Figure 2-2: Location of the OIC Leases and the Mineral Leases at the MO ............................................................................ 2-3

Figure 2-3: Stratigraphic Lithology Column TNB ..................................................................................................................... 2-9

Figure 2-4: Thompson Mine Longitudinal Section ................................................................................................................. 2-13

Figure 2-5: Birchtree Mine Longitudinal Section.................................................................................................................... 2-14

Figure 2-6: QQ Plot of Ni Duplicates - January to March, 2010 (Thompson 2010 Checks.xls) ............................................. 2-22

Figure 2-7: Relative Difference Plot of Ni Duplicates - January to March, 2010 (Thompson 2010 Checks.xls) .................... 2-22

Figure 2-8: Dilution and Mining Recovery Definitions (BT 2009 MRMR). .............................................................................. 2-39

Figure 2-9: Diagram Showing Ore Value Determination at the MO (MO 2009 MRMR). ....................................................... 2-40

Figure 2-10: MO Sensitivity Analysis ..................................................................................................................................... 2-54

Effective Date: June 30, 2010
Report No. 10-1117-0032 Phase 2000                                                  2-iii
MANITOBA OPERATIONS AUDIT
2.0 MANITOBA OPERATIONS
2.1 Location
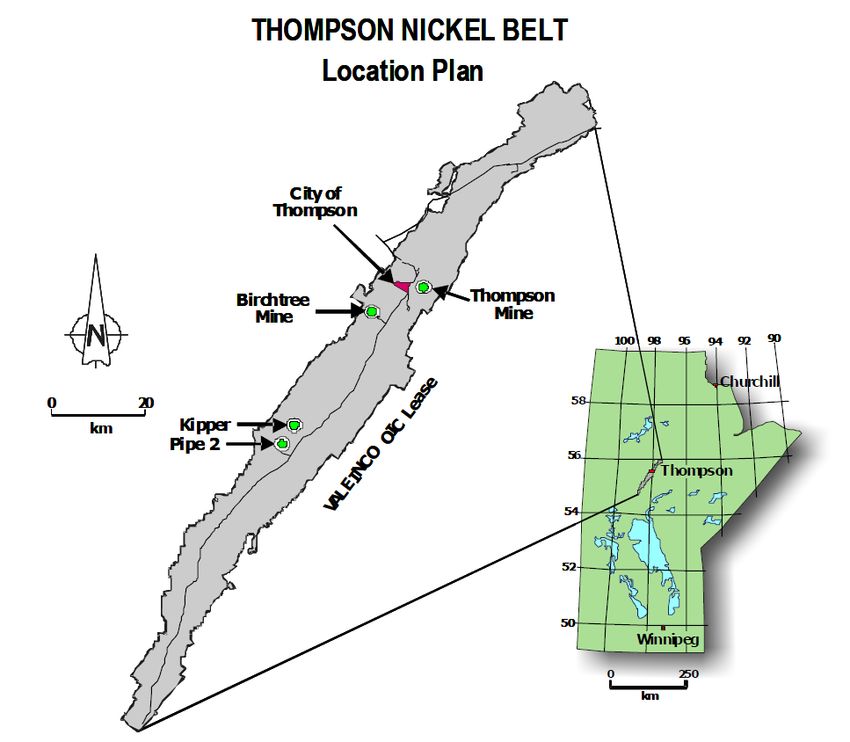
The Manitoba Operations (MO) is located in northern Manitoba, 800 km north of Winnipeg and adjacent to the
City of Thompson as illustrated on Figure 2-1.
Figure 2-1: Location of the MO and Mining Leases
2.2 Ownership
The MO is 100% owned by Vale Limited (Vale), other than the Order-In-Council (OIC) Leases held by Mystery
Lake Nickel Mines, in respect of which no mineral reserves or mineral resources are being reported.
2.3 Land Tenure and Mining Rights
Vale landholdings or mining rights in Manitoba consist of OIC Leases, Mining Leases and Mining Claims. The
mineral reserves, mineral resources are located on the OIC Leases and Mineral Leases that are held 100% by
Vale.
Effective Date: June 30, 2010
Report No. 10-1117-0032 Phase 2000 2-1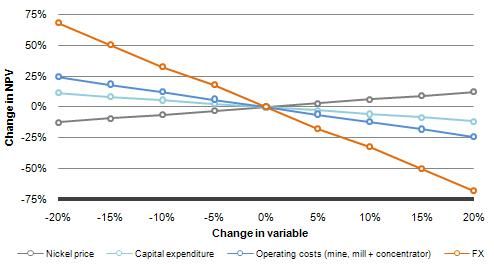
MANITOBA OPERATIONS AUDIT

Order-in-Council (OIC) Leases
Vale currently holds a total of 2,947 OIC Leases in the Thompson Nickel Belt (TNB). A total of 2,918 of these
leases are held 100% by Vale. A total of 29 OIC Leases are held in the name of Mystery Lake Nickel Mines
(MLNM), which is owned 82.6% by Vale and 17.4% by Newmont Exploration of Canada.

OIC Leases were initially surveyed and made effective over a six-year period from 1957-1962 and are
collectively considered “producing leases” as long as production occurs from any single lease in the group. OIC
Leases provided for an initial 21-year term and two subsequent guaranteed renewals of 21 years each. All
third-term 21-year guaranteed renewals of the OIC Leases have now been granted. Subsequent lease renewals
beyond the three 21-year terms can be granted at the discretion of the Province of Manitoba’s Minister of
Science, Technology, Energy and Mines.

The 2,947 OIC Leases (6,358 Claims) that cover 109,043.3 hectares in the TNB are listed in Table 2-1.
                                             Table 2-1: OIC Leases
     Expiry Date               Hectares           Held in Name Of                         Property
    January 2020                2854.49           Vale Inco Limited                 Thompson Belt North
    February 2020                379.52                MLNM                         Thompson Belt North
    January 2021                108.59                 MLNM                         Thompson Belt North
    January 2021                3399.40           Vale Inco Limited                 Thompson Belt North
                                                                                  Includes Thompson and
  September 2022               21763.93           Vale Inco Limited
                                                                                       Birchtree Mines
  September 2023               19772.02           Vale Inco Limited                 Thompson Belt North
                                                                            Thompson Belt East including deep
  September 2024               29092.03           Vale Inco Limited
                                                                              extension of Thompson Mine
  September 2025               31679.32           Vale Inco Limited              Thompson Belt South
         Total

Mineral Leases
A Mineral Lease is a lease issued by the Province of Manitoba under the Mines and Minerals Act (Manitoba) and
conveys to the lessee the exclusive right to the minerals (other than quarry minerals) that occur on or under the
land covered by the lease and access rights to erect buildings and structures (including shafts) to mine within the
limits of the lease. Mineral Leases are 21-year leases that are renewable at the discretion of the Province’s
Minister of Science, Technology, Energy and Mines. Vale holds six Mineral Leases that cover 4,151.21 hectares
in the TNB. These Mineral Leases remain in effect until April 1, 2013 and are illustrated summarized in
Table 2-2 and illustrated on Figure 2-2.

Effective Date: June 30, 2010
Report No. 10-1117-0032 Phase 2000                     2-2
MANITOBA OPERATIONS AUDIT
Table 2-2: Mineral Leases
Lease Hectares Property
ML10 774.47 Hambone N.
ML11 711.81 Hambone S.
ML12 789.54 Mystery N.
ML13 564.94 Birchtree
ML14 637.78 Birchtree
ML15 672.67 Birchtree
Total 4,151.21
Figure 2-2: Location of the OIC Leases and the Mineral Leases at the MO
Thompson Mine
All OIC Leases that cover the current extent of the Thompson Mine were successfully renewed in 2001 for a
21-year term and will expire in 2022. The eastern and depth extensions of the Thompson Mine are covered by
OIC Leases that were renewed for the third 21-year term in 2003 and will expire in 2024. Annual Rentals of
CDN $10.50 per hectare (with a minimum payment of CDN $193) are paid to the Minister of Science,
Technology, Energy and Mines to keep the OIC Leases in good standing. Although the estimated mineral
reserves are scheduled for depletion by that time, the leases contain inferred mineral resources and potential
mineral deposits that are under exploration. If these exploration programs are successful, additional mineral
reserves could be developed.
Effective Date: June 30, 2010
Report No. 10-1117-0032 Phase 2000 2-3MANITOBA OPERATIONS AUDIT Vale intends to commence discussions with the Ministry of Science, Technology, Energy and Mines in 2010 to discuss renewal of OIC Leases or their replacement with mineral leases under the current Manitoba mining laws. This process will identify issues to be addressed well in advance of expiration of the OIC Leases with the intent of best positioning Vale so that its mining rights are extended to allow it to continue operations well beyond their current expiry dates. If the OIC Leases for Thompson Mine were not renewed or replaced beyond their current expiry dates, the mineral reserves would be reduced by 5.6 million tonnes (approximately) and all reported mineral resource for Thompson Mine scheduled past 2024 would be eliminated. Birchtree Mine The Birchtree Mine straddles the boundary between Leases grouped under OIC 1746/56 (to the east) and Mineral Leases under the current Mines and Mineral Act (to the West). The OIC Leases were renewed for a third 21-year term in 2001 and will therefore expire in 2022. The three Mineral Leases at the Birchtree Mine will expire on April 1, 2013. The Birchtree Mine orebodies dip to the west from the OIC Leases, onto the Mineral Leases. Based on current production plans, mineral reserves that are scheduled at Birchtree Mine will not be depleted by 2013 when the 21-year terms for the Mineral Leases expire. The Mineral Leases can be renewed for a further term of 21 years if Vale is in compliance with the lease and the Mines and Minerals Act. Vale is not aware of any issues or defaults which prevent it from renewing the Mineral Leases for a further term of 21 years. Vale intends to commence discussions with the Ministry of Science, Technology, Energy and Mines in 2010 to discuss renewal of OIC Leases or their replacement with Mineral Leases under the current Manitoba mining laws. This process will identify issues to be addressed well in advance of expiration of the OIC Leases with the intent of best positioning Vale so that its mining rights are extended to allow it to continue operations well beyond their current expiry dates. If the OIC Leases for Birchtree Mine were not renewed or replaced beyond their current expiry dates, the mineral reserves would not be affected and all reported mineral resource for Birchtree Mine scheduled past 2022 would be eliminated. It is the opinion of QP that renewal of the OIC and Mining Leases will not be an issue since the leases have been renewed by the Manitoba government several times in the past and it is not considered a fatal flaw during this audit. 2.4 Infrastructure The MO production infrastructure consists of: A beneficiation plant; A smelter with two electric furnaces; A nickel refinery; Offices and services facilities; and Areas designated for tailings disposal, slag disposal and settling ponds. Electric power is provided by Manitoba Hydro. Effective Date: June 30, 2010 Report No. 10-1117-0032 Phase 2000 2-4
MANITOBA OPERATIONS AUDIT

2.5       Production Process and Products
Mine production is sourced from two underground mines: the Birchtree Mine; and the Thompson Mine. Mining
methods primarily use Vertical Block Mining (VBM), a Slot-Slash Method, with vertical blocks averaging 100 ft in
height, and Cut and Fill mining. The ore is crushed underground to -15 cm and shipped to the concentrator.

At the concentrator, the ore is crushed and ground in cone crushers, rod mills and ball mills and fed to the
froth-flotation cells. The multi-staged froth flotation separates the sulphide minerals into a nickel concentrate and
a copper concentrate. Pyrrhotite is not separated. The tailings are disposed of in tailings ponds and are also
placed as fill underground. Approximately 1/3 of mill feed is available for use as fill underground. The nickel
concentrate averages 14% Ni and 0.4% Cu. The copper concentrate averages 13% Cu and 4% Ni.

The copper concentrate is filtered and shipped to the bulk smelter at the Sudbury, Ontario operations. The
sulphide anode slimes from the nickel refinery is filtered and sold. The sulphide anode slimes grades about
8% Ni and 1% Cu and contains precious metals.

The nickel concentrate is dewatered and upgraded to Bessemer Matte by processing through fluid-bed roasters,
electric furnaces and Pierce-Smith converters. The Bessemer Matte is cast into anodes grading 76% Ni and
2% Cu.

The nickel refinery is electrolytic. The nickel anodes are dissolved producing an electrolyte (“anolyte”) containing
primarily nickel, but also significant amounts of copper, cobalt and iron. The anolyte is purified in several stages
to produce “electro-nickel” at a purity greater than 99.9% Ni.

A copper cake grading about 34% Cu and 13% Ni is also produced from the purification of the anolyte.

There is currently no restriction on the export of the products from the MO’ mines for treatment or refining
outside of Canada.

It is the opinion of QP that the production processes at the MO are well understood and is successful
generating products for Vale. The level of review completed by the QP was based on document reviews
and has not identified and fatal flaws.

2.6       Metal Recoveries
The mill metal recoveries of nickel, copper and cobalt that are used for mineral reserve estimates are calculated
as a function of the mill head grade. The recovery formulae are updated annually by comparison to actual mill
operating results.

Recoveries of nickel and cobalt at the smelter and refinery are determined as factors based on the recoveries
used in the Operations’ current metallurgical plan, which are generally based on results from the previous two
years.

The copper recovery is based on factors from the recovery of copper at the Ontario Operations’ smelter and
refinery.

The precious metals recoveries are determined as factors based on mill recoveries and the smelter and refinery
recoveries.

Effective Date: June 30, 2010
Report No. 10-1117-0032 Phase 2000                      2-5
MANITOBA OPERATIONS AUDIT

The overall metal recoveries for Birchtree and Thompson Mines based on 2010 average plan grades are shown
in Table 2-3.
                           Table 2-3: Average Recoveries for Major Metals at the MO
                                     (Based on 2010 Average Plan Grades)
                                     Metal          Birchtree Mine Thompson Mine
                              % Nickel Recovery               80.3          83.9
                              % Copper Recovery               73.8          76.6
                              % Cobalt Recovery               44.8          44.5

It is the opinion of QP that metal recoveries at the MO are well understood and are appropriately applied
to the mineral reserve estimate. The level of review completed by the QP was based on document
reviews and has not identified any fatal flaws.

2.7       Market
The nickel is sold as nickel “rounds” or cathodes (“slabs”). Most is sold to the plating industry and the remainder
is sold to the melting industry. These products account for about 97% of the recovered nickel production at the
MO.

The copper concentrate and copper cake are shipped to Vale’s Ontario Operations. The copper is refined and
sold as anodes. The nickel in the copper products accounts for the remaining 4% of the recovered nickel
produced at the MO.

Cobalt is produced in the hydrate form and is sold directly to market as a hydrate.

The MO ore contains about 0.5 grams per tonne platinum group metals and gold. The precious metals are
collected in the sulphide anode slimes and sold to market.

It is our understanding from Vale that they have well established markets available for all products.

It is the opinion of the QP that the metal market at the MO is well understood and is appropriately
applied to the mineral reserve estimate. The level of review completed by the QP was based on
document reviews and has not identified any fatal flaws.

2.8       Historic Production
Table 2-4 shows mine production and the average grade for MO for the three-year period to 2009 (year-end) and
is based on information provided from the Form 20F 2009 SEC filing. Production from 1H 2010 (June 30, 2010)
is also included for comparison.

Effective Date: June 30, 2010
Report No. 10-1117-0032 Phase 2000                      2-6
MANITOBA OPERATIONS AUDIT
Table 2-4: Historic Production - 2007 to June 30, 2010
Area Units 2007 2008 2009 1H 2010
Production Thompson
Tonnage ('000 tonnes dry) 1,380 1,320 1,270 745
Nickel grade (%) 1.83 1.77 1.98 1.68
Production Birchtree
Tonnage ('000 tonnes dry) 1,164 971 769 439
Nickel grade (%) 1.52 1.51 1.48 1.38
Production MO
Tonnage ('000 tonnes dry) 2,544 2,291 2,039 1,174
Nickel grade (%) 1.69 1.66 1.79 1.57
.
Table 2-4 indicates consistent production levels at Thompson Mine over the past five years with a downward
trend in production at Birchtree Mine. The upward trend in 2009 for the Thompson Mine head grade can be
attributed in part to a production shift to the higher grade selective mining 1D Lower area. Birchtree head grades
have remained relatively consistent from 2007 to 2009. The downward grade trend in the Birchtree Mine was
due to remaining ground stability issues from a flattened mining front. Block selection was limited and the
transition to a more optimal mining sequence will reduce ground stress.
Discussion with Vale regarding the grade trends for the first half of 2010 for the Thompson Mine has been
attributed to mining lower Ni grade production areas. The grade is projected to recover in the final half of the
year and the final grade for 2010 will be close to the three-year average grade. The 2010 tonnage production is
expected to be similar to 2009. The grade trend for the first half of 2010 for the Birchtree Mine has been
attributed to mining lower Ni grade production areas. The grade is expected to recover and average
approximately 1.5% Ni in the final half of the year. This will result in the 2010 Birchtree head grade being slightly
less than the three-year average. Birchtree Mine tonnage production is rising and 2010 is expected to be better
than 2009, nearing 2008 production numbers.
Head grade was also negatively affected by the mill credit grades. There is a 7% discrepancy between Mine
called (estimates provided by the geology staff on a daily basis) and Mill credit grades. Issues related to
sampling procedures at surface feed and discharge points have been identified. Some of these issues have
been addressed in 2009. The remainder will be acted upon in 2010. The goal is to reduce the Mine - Mill
discrepancy.
The MO mine plans are based on long-term corporate nickel price projections. Individual block economics are
assessed immediately prior to mining based on shorter-term nickel prices and actual mining costs. The upturn in
the Ni selling price in 2007 and the first half of 2008 increased the value of the ore and in many cases effectively
lowered the cut-off grade in several areas. The MO are, however, constrained by a requisite Mill Head Grade.
It is the opinion of QP that the Historic Production at the MO is well documented and is appropriately
applied to the mineral reserve estimate where applicable. The level of review completed by the QP was
based on document reviews and discussion with Vale staff and has not identified any fatal flaws.
Effective Date: June 30, 2010
Report No. 10-1117-0032 Phase 2000 2-7MANITOBA OPERATIONS AUDIT 2.9 Geology and Mineral Deposits Regional Geology The Thompson Nickel Belt (TNB) consists of a series of early Proterozoic metasediments, referred to as the Opswagan Group, which have been intruded by ultramafic intrusions. The sediments and ultramafic intrusions have been metamorphosed and interfolded with Archean Gneisses, forming a “dome and basin” type structural setting. Local Geology The Ospwagan Group has been divided into a series of formations which is illustrated on Figure 2-3. The basal Manasan Formation consists of two members: The lower member (M1) consists of impure quartzite to arkosic arenite, locally with small lenses of pebble conglomerate that unconformably lie on top of basement Archean gneiss. It is usually fine to very fine grained, light grey to beige and thinly bedded to laminated. The upper member (M2) is usually between 3 and 65 ft (0.9 to 19.8 m) thick and consists of quartz-feldspar- muscovite-biotite schist derived from an arkosic wacke. It also has much more argillaceous material than the M1. Overlying the Manasan Formation is the Thompson Formation. The transition is gradational from semi-pelite dominated to thinly layered calcareous metasediments. It usually shows thin compositional layering and consists of a mixture of dolomitic carbonate, siliceous dolomitic marble and chert, with some intercalated semi-pelites. The next formation in the sequence is the Pipe Formation. This unit hosts the nickel bearing sulphides and comprises three units: The P1 member consists of laminated to thinly bedded chert, graphitic pelite schists and sulphide facies iron formation. Pyrrhotite, the primary sulphide, is present as laminations or layers, up to 1 ft (0.3 m) thick. The P2 member overlies the P1 and consists of pelitic schist, commonly with porphyroblasts of garnet, staurolite and sillimanite. Thin beds of chert and calc-silicate are typically intercalated with the schist. Sulphide, typically as fine-grained disseminated pyrrhotite, is common through out, as is graphite. All economic mineralization is contained within the P2 member. The P3 member is upper-most in the sequence and consists of silicate facies iron formation. The primary constituents are quartz, biotite, garnet, grunerite, cummingtonite, hornblende, clino- and ortho-pyroxene, fayalite, carbonate and magnetite. A dolomitic marble unit is intercalated with the iron formations. Quartz is present primarily as recrystallised chert. The chert is thinly to thickly laminated and is commonly disrupted due to tectonism. Above the Pipe Formation is the Setting formation. It consists of thickly layered intercalated quartzite and pelitic schist. Calc-silicate lenses are common and may represent metamorphosed carbonate-rich concretions. The upper most unit of the Ospwagan Group is the Bah Lake Formation. It consists of mafic volcanic flows and fragmentals. It varies from basalt to olivine basalt (picrite). Pillows are a common feature. Effective Date: June 30, 2010 Report No. 10-1117-0032 Phase 2000 2-8
MANITOBA OPERATIONS AUDIT
THOMPSON NICKEL BELT
Geology
Stratigraphic Column
Formation Formation
M
e
m su
b lp
hi
d
S
e
di
m
e
t
Bah Lake
mafic to
ultramafic
OSPWAGAN volcanics
B1,2,3
GROUP
S2
Metavolcanics Setting
upper clastic
sediments
Interlayered Quartzites and Schists S1
Pelitic Schists
Iron Formation
P3
Pipe Thompson and
Impure Calcareous Metasediments Pelitic sediments
and iron Birchtree
Semipelitic Schists or Gneiss formations
O
S
P
W
A
G P2
Quartzite
A
N
G
P1
Archean Gneiss Thompson T3 Pipe
Calcareous
sediments T2
T1
Manasan M2
Lower clastic
sediments M1
Archean
A
Basement
Figure 2-3: Stratigraphic Lithology Column TNB
Structural Geology
The Early Proterozoic Ospwagan Group cover sequence is preserved within a deeply dissected remnant of
regional fold interference patterns reflecting a complex deformational history. There have been at least six
phases of folding, of which two (F1 and F3) are the most significant. The first phase of folding (F1) has resulted
in large-scale recumbent synformal folds. These have been refolded by tight, upright, doubly plunging F3 folds
producing at times complex fold interference patterns.
The nickel ores are typically hosted within the P2 formation of the Ospwagan Group. Ultramafic bodies
associated with the ore show variable degrees of disruption and boudinage with the sulphide mineralization
typically wrapping around the ultramafics.
Much of the western contact of the main synformal fold structure has been affected by shearing associated with
a mylonite zone that follows along this contact. Most of the basal stratigraphic units (Manasan to Thompson
Formations) have been thinned and attenuated to the point that in many places they can no longer be
recognized. Mineralization has remobilized into this shear zone and now extends well past the limits of the
ultramafic bodies.
At the Thompson Mine zones of wide and high-grade mineralization are spatially correlated with dilation zones
within multiple faulted/drag folded flatter lying stratigraphic sequences within P2. The ore occurs as distinct
semi-massive sulphide breccias within these faulted zones as:
Semi-conformable en echelon and anastamosing sub-vertical vein sets; and
Flatter lying veins that have infilled dilatant drag folds.
Effective Date: June 30, 2010
Report No. 10-1117-0032 Phase 2000 2-9MANITOBA OPERATIONS AUDIT These dilation zones occur at all types of scales, from true widths exceeding 300 feet (100 m) to microscopic scale. Massive sulphide occur locally and less frequently at varying orientations within tension gashes. Late brittle structures do occur at Thompson Mine but are usually narrow and have limited strike length. Although they can have a negative affect on local ground conditions, they rarely affect the ore zone geometry. The exception is the large brittle 1D fault system that is locally referred to as the Davy’s Fault. It is prevalent within the Pipe formation in the 1D upper and portions of the 1D lower orebodies. In general, the fault crosses the ore zone at a very shallow angle from the south west or in several locations parallels the ore. Depending upon orientation and host rock type the fault can range from a vuggy quartz – carbonate breccia zone up to 100 ft (30 m) across down to graphitic shear zones on scale of a few millimetres. The fault zone affects the local rockmass stability and necessitates use of several ground control/support methods to allow for safe extraction of the ore. At the Birchtree Mine two important fault structures occur: Strike- parallel faults in the structural footwall, including the 780 and 1080 Faults; and Shallow East - dipping faults including the 906 and 609 faults. Minor splays associated with these fault structures also occur at the Birchtree Mine, one example is the 84 Shear. Mineral Deposits The sulphide mineral deposits are associated with the ultramafic intrusions within the Pipe Formation, which is part of the Opswagan Group. The sulphide deposits occur as disseminated sulphides within the ultramafics, massive sulphide veins and lenses within the ultramafic and along the contact of the ultramafic with the Pipe Formation, and as massive sulphide veins and lenses within the Pipe Formation. All mineral reserves are contained within the latter two deposit types. The stratigraphy at the Thompson Mine is overturned and dips 65 degrees to the west. The Archean Gneisses are located in the Thompson Mine hanging wall. Unconformably overlying the gneisses are quartzite, schist, nickel mineralization, calcareous marbles and iron formation. Amphibolite dykes and pegmatites crosscut all lithologies. Ultramafic bodies (locally called peridotite) are associated with the nickel mineralization in areas of Thompson Mine. The majority of sulphide mineralization at the Birchtree Mine is Ultramafic Associated Deposits. Deposits are generally classified as to their spatial relationship of the mineralization to ultramafic bodies: Metasedimentary Hosted Deposits The structurally controlled dilation sulphide matrix mineralized zones are contained within the P2 Schist. Inclusions of wall rocks and ultramafics are common in the massive sulphide. The mineralization is linear and more predictable with widths ranging from 0.3 m to 60 m. Pinch and swell structures are common. The majority of Thompson Mine orebodies fall in under this category. Effective Date: June 30, 2010 Report No. 10-1117-0032 Phase 2000 2-10
MANITOBA OPERATIONS AUDIT
Ultramafic Associated Deposits
The sulphide mineralized zones tends to concentrate between the footwall or hanging wall rocks and the
ultramafic, although it is not uncommon for the ore to completely encompass the ultramafic. The Birchtree Mine
84 Orebody can generally be described as brecciated ultramafic within a sulphide matrix. The ultramafic
inclusions, which are randomly distributed, range from centimetres to hundreds of metres in size.
At Pipe 2, mineralization consists of ultramafic associated disseminations, net textured sulphides, semi-massive
segregations, and as semi-massive to massive veins and breccias. The sulphide zones extend along strike and
dip from the ultramafic host into sediment hosted veins, pods and lenses of massive and breccia sulphide.
Sulphides
The massive sulphides contain inclusions of ultramafics and sediments. On average, massive sulphide consists
of 90% pyrrhotite, 10% pentlandite and less than 1% chalcopyrite. Cobalt is contained within the pentlandite.
Thompson Orebodies
The Thompson Mine comprises the following orebodies and are illustrated on Figure 2-4.
3-Shear - The 3 shear orebody is located along the Thompson #3 zone. The 3 shear orebody extends from
surface to a depth of approximately 1,600 ft (488 m). Mineralization within the zone is predominantly
hosted by large ultramafic bodies. This was one of the first areas to be mined at Thompson and still has
potential for future remnant mining.
2-3 Nose - The 2-3 Nose is a south plunging, north fold closure located just east of 3 Shear orebody. This
area has been mined down to 3600 Level with current remnant mining taking place between 3200 Level
and 2800 Level. Mineralization is proximal to the setting formation contact but is generally confined within
the P2 schist with local ultramafic inclusions. It can be attributed to the infilling of dilation zones around an
F2 fold closure.
2 Shear - The 2 Shear orebody is a sub-vertical northwest/southeast striking zone on the south end of the
Thompson Dome structure. The 2 Shear orebody is the connection between the 2-3 Nose and the Nose
orebodies. Mining has taken place from surface to a depth of 4,550 ft (1,387 m). Current activities include
primary mining in the South End Development (SED) from 4550 to 4050 Level and remnant mining of the
3200 – 234 complex and 2000 Crowns. Future mining opportunities exist as primary mining of the SED
below 4550 Level and other remnant areas.
Nose - The Nose structure is the south-eastern most portion of the Thompson Dome. It consists of a south
plunging, south fold closure. Mineralization is a result of infilling of a dilation zone around the fold closure.
The orebody has been mined from surface down to 4000 Level. Mineralization continues below 4000 Level
but not enough ore grade material has been outlined to make it economic to pursue. Remnant areas above
4000 Level are in the Thompson LOM plan.
1A - The 1A Zone is the southern most orebody located entirely on the eastern limb of the Thompson
Dome. The 1A Zone is a south plunging orebody located within P2 schist. The 1A orebody has been
mined underground from 400 Level to 3600 Level. Mining of the 1A orebody in the TOP is ongoing. There
are also potential remnant recovery areas in the 1A orebody.
Effective Date: June 30, 2010
Report No. 10-1117-0032 Phase 2000 2-11MANITOBA OPERATIONS AUDIT
1B - The 1B orebody is located on the eastern limb of the Thompson Dome, just north of the 1A. The
orebody can essentially be divided up into two areas based on both mining activities and mineralization.
The 1B orebody above 2400 Level is sediment hosted within the P2 schist with minor ultramafic inclusions.
This area has essentially been mined out with only a few remnant areas remaining. Below 2400 Level, the
orebody becomes ultramafic associated as the ore tends to wrap around large peridotite bodies. This is a
primary mining 2802 complex, and is currently being bulk mined between 3100 and 2400 Levels.
1C - 1C orebody is centred around the T-3 shaft. It is essentially mined out between 400 and 3300 Levels
with a few remnants left. Diamond drilling has cut the orebody off at 3300 Level. South of the T-3 shaft
most of the crown pillar ore, above 400 Level has been extracted via open pit. The crown pillar adjacent to
and north of the T-3 has recently been the subject of a new open pit study. It is economic to mine the area
via open pit but timing of the project is critical because of its potential affect on the T-3 shaft and
surrounding infrastructure. The mineralization is locally associated with ultramafic bodies but is usually
referred to as sediment hosted deposit. The ore in the 1-C complex below 2400 Level was the result of
sulphide infilling of a large dilation zone adjacent to a F2 fold closure.
1D Upper - The 1D orebody is located north of 34500N and is currently a primary mining area. The 1D
Upper mining area extends from 3500 Level up to 2400 Level. The area above 2400 Level is currently
being evaluated for potential future mining operations. The near surface material is currently being
assessed to determine if it is possible to extract it via open pit. The 1D Upper orebody is overall a linear
east dipping structure contained within P2 schist. Mineralization is generally associated with shearing
within the P2 schist creating zones of weakness that were conducive for the migration of ore bearing fluids.
1D Lower - The 1D Lower orebody is located below 3500 Level and is open at depth. This is a primary
mining area and is currently being mined with mechanized Cut-and-Fill methods. The 1D Lower orebody is
developed in dilation zones around F2 fold hinges typically below synformal closures (“hang-downs”) in the
Thompson Formation skarn, which caused a deflection of the P2 shear zone.
Effective Date: June 30, 2010
Report No. 10-1117-0032 Phase 2000 2-12MANITOBA OPERATIONS AUDIT
T-1 T-3 378
TOP
1-B 1-D Upper
1-C
1-D Lower
1-A, Nose, 2Shear,
2-3 Nose, 3 Shear 0 600
m
24 000 N
36 000 N
Figure 2-4: Thompson Mine Longitudinal Section
Birchtree Orebodies
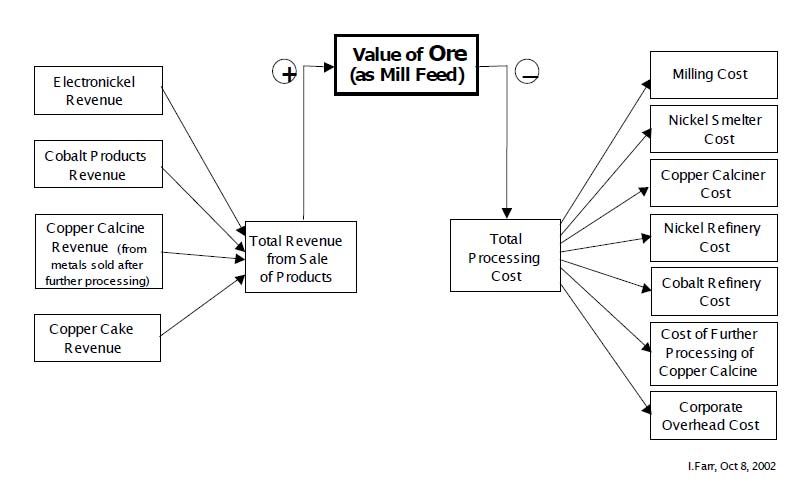
The Birchtree Mine comprises the following orebodies and are illustrated on Figure 2-5.
84 – The 84 orebody is a breccia which wraps a large ultramafic. It is at the south end of the mine. The ore
is located on the footwall side of the ore. The ore zone is up to 300 ft (100 m) wide. The south side of the
ultramafic generally has higher grades than the north end. The orebody has been truncated and displaced
by the 609 and the 906 faults. This orebody is the major producer at Birchtree Mine. The orebody has
been mined out above the 906 fault.
85 – The 85 orebody is the down-dip extension of the 84 Orebody below, and offset by, the 609 Fault. It is
also hosted in ultramafic.
108/109 – The 108/109 is a linear shear structure that ranges in width from 10 to 60 ft (3 to 18.2 m). There
is a change in direction in the orebody that creates a widening of the ore zone. The grade increases
around the bend and to the north of the change of direction.
124 - The 124 orebody wraps the northern ultramafic. The ore is interstitial through the edges of the
ultramafic. It is 20 to 200 ft (6.1 to 61 m) wide. It has a higher grade than the other ultramafic ore deposits
within the mine. This orebody has been mined up to 30 ft (9.1 m) below 300 Level.
Effective Date: June 30, 2010
Report No. 10-1117-0032 Phase 2000 2-13MANITOBA OPERATIONS AUDIT
Figure 2-5: Birchtree Mine Longitudinal Section
PGE Mineralization
Recent exploration data from the 1D Lower orebody at Thompson Mine indicates elevated platinum group
element levels associated with remobilized, metasediment hosted, sulphide ores. The evaluation of the PGE
potential of the TNB is now a part of Vale exploration approach. Several studies are currently underway to better
understand PGE mineralization and distribution within ultramafic associated and metasediment hosted sulphide
ores.
A positive Pd to Ni correlation exhibited in the 1D Lower data is beneficial in identifying and quantifying the
potential PD resource within current ore zones. Data acquisition and evaluation of the PGE potential of
metasediment hosted 108 and 109 Orebodies at Birchtree is currently underway.
Geology and Mineral Deposit Review by Golder
A presentation of the background geology and mineral deposits in the TNB was provided to Golder by
Robert Stewart, P.Geo., the Chief Geologist of Vale Inco Technical Services (VITS). In addition, discussions
were held with the chief geologists and mine geologists from each of the operations with respect to the geology
and mineral deposits of the TNB.
Effective Date: June 30, 2010
Report No. 10-1117-0032 Phase 2000 2-14MANITOBA OPERATIONS AUDIT The stratigraphy of the TNB and the structural controls of mineralization have been well established by government and Vale geologists. The main data collection method used in evaluating and increasing confidence in geological interpretation and mineral resource evaluations is diamond core drilling directed by the exploration and mine geological staff. Drilling density varies at the mines and is a function of the style of mineralization and the level of resource classification. In addition to the diamond core drilling used to define the mineral resources and mineral reserves, once the mineralized zones are intersected underground, geology mapping is completed typically on a round-by-round basis at the mines and intergraded into the Vulcan and Datamine geology models. The mapping is compared against the exploration and development drilling data to better define the reserve planned for mining. Where historical mapping data exists, it is also relied upon when working in remnant mining areas and compared against more recent drilling. In addition, probe data from production drilling (in Vertical Bench Mining (VBM) mining) is completed to define the mineralized contacts in the planned mined areas and adjusted to minimize dilution or identified missed mineralized zones. Reviews of the MRMR documents provided for each mineralized zone (or orebody) indicates local geology controls that may be relevant to that zone and how it may impact the reserve and production planning. This information is shared with the mine planners for these zones and in some cases identifies the requirement of additional data (detailed mapping and additional drilling). Also, senior geology staff (Chief Mine Geologists) have experience at several of the mines and recently rotated between the mines allowing for opportunities to share knowledge and best practices. It is also noted that all development drilling data at the three mines is currently collected by the same geologists and technicians, which permits geology logging consistency between the mines. It is Golder’s understanding that the majority of the development drilling for the three mines was completed by the same geologists. It is the opinion of the QP that Vale has excellent knowledge and understanding of the geology and mineral deposit styles at both the Thompson and Birchtree Mines and this knowledge is being transferred to staff. The level of geology data being collected is completed to accepted industry standards and appropriate for mineral reserve reporting. The level of review completed on geology and mineral deposit styles by the QP did not identify any fatal flaws. Effective Date: June 30, 2010 Report No. 10-1117-0032 Phase 2000 2-15
MANITOBA OPERATIONS AUDIT

2.10      Exploration and Development Drilling
Two categories of drilling are employed at the MO. Exploration drilling is the identification of new mineral
resources and development or definition drilling is the upgrading of information from mineral resources to mineral
reserves.

Exploration drilling from surface is under the direction of Exploration TNB and exploration drilling underground
under the direction of Exploration TNB and the mine geologist (Thompson Mine or Birchtree Mine).
Development drilling underground is under the direction of the mine geologists.

Diamond drilling core sizes are typically BQ and AQTK. NQ drill holes are completed in areas planned for probe
geophysics. Drilling is primarily completed by contractors (Major Midwest Drilling) and one underground Vale
drill.

Drilling completed between January 1 and December 31, 2009 for the MO as described in the MRMR reports are
45 exploration drill holes for a total of 3,856 m and 422 development drillholes for a total of 42,998 m. Drilling
details per mine area are outlined in Table 2-5.
                        Table 2-5: MO Diamond Drilling (January 1 to December 31, 2009)
                                         Exploration               Development               Total
       Mine Area                     No. Drill   Length      No. Drill    Length    No. Drill        Length
                                      Holes       (m)         Holes        (m)       Holes            (m)
       Thompson Mine 1 D
                                         -          -             30        5,182      30              5,182
       Above 3600L
       Thompson Mine 1 D
                                        24       11,430           50        9,144      74             20,574
       Above 3600L
       Thompson Mine
                                         -          -            180        9,144     180              9144
       T1/T3
       Thompson Mine
                                         9         972             -         -           9              972
       Open Pit
       Birchtree Mine
                                         -          -            148       17,096     148             17,096
       Ultramafic
       Birchtree Mine
                                        12        3,856           14        2,433      26              6,289
       Sedimentary
       Total                            45        3,856          422       42,998     467             59,256

Drilling completed between January 1 and June 30, 2010 for the MO, as provided by Vale during the site visit, is
comprised of 30 exploration drill holes for a total of 15,187 m and 319 development drill holes for a total of
27,186 m. Drilling details per mine area are outlined in Table 2-6.

Effective Date: June 30, 2010
Report No. 10-1117-0032 Phase 2000                        2-16
MANITOBA OPERATIONS AUDIT
Table 2-6: MO Diamond Drilling (January 1 to June 30, 2010)
Exploration Development Total
Mine Area No. Drill Length No. Drill Length No. Drill Length
Holes (m) Holes (m) Holes (m)
Thompson Mine 1 D
- - 57 5,233 57 5,233
Above 3600L
Thompson Mine 1 D
19 10,725 14 2,101 33 12,826
Above 3600L
Thompson Mine
- - 130 6,187 130 6187
T1/T3
Thompson Mine
- - - - - -
Open Pit
Birchtree Mine
- - 111 12,083 111 12,083
Ultramafic
Birchtree Mine
11 4,462 7 1,582 18 6,044
Sedimentary
Total 30 15,187 319 27,186 349 42,373
The main focus of exploration drilling at the Thompson Mine in 2009 and 2010 is the Thompson Extensions or
the 1D Lower area (below 3600 L). All of this drilling is being completed from the 3600 Level hanging wall drift.
Surface drilling was also completed in 2009 from surface to investigate the open pits. The main focus of
exploration drilling at the Birchtree Mine is the 109 and 85 orebodies both located below the 609 Fault and down
dip extensions of the 108 and 84 orebodies. The development drilling focus has been on defining areas to be
mined as part of the mineral reserve estimate.
It is the opinion of the QP that Vale’s exploration and development drilling programs are under the direct
control of the geologists at Exploration TNB and the mines and are completed to accepted industry
standards and appropriate for mineral reserve reporting. The level of review completed on exploration
and development drilling by the QP did not identify any fatal flaws.
2.11 Deposit Sampling Methods and Data Management
Diamond Drilling Sampling Methods
Vale geologists plan and lay out all diamond drill hole collar locations (hole number, dip, azimuth and length) in
Vulcan (Birchtree Mine) and Gemcom/Datamine (Thompson Mine) and provide this information to the drilling
crews.
Typical core diameter sizes are BQ with some AQTW and NQ. Core is logged at two facilities at the Thompson
Operations: the VITS core facility and the Birchtree core facility. All Exploration drilling is logged at the VITS
core facility and all Development drilling from the three mines (T-1, T-3 and Birchtree) is logged at the Central
Core Process Centre at the Birchtree Mine. Geologists and technicians (supervised by the geologists) log and
sample all drill holes in the same Gemcom database system (MEBS). Sampling procedures are the same for
the exploration and development core except that the exploration core is sawed in half with the remaining half
retained at Vale’s MO core storages sites. Development drill core samples are fully sampled.
Effective Date: June 30, 2010
Report No. 10-1117-0032 Phase 2000 2-17You can also read