KENYA ETHANOL COOKING FUEL MASTERPLAN JUNE 2020 - SOUTHSOUTHNORTH
←
→
Page content transcription
If your browser does not render page correctly, please read the page content below
Kenya Ethanol Cooking
Fuel Masterplan

June 2020

                        1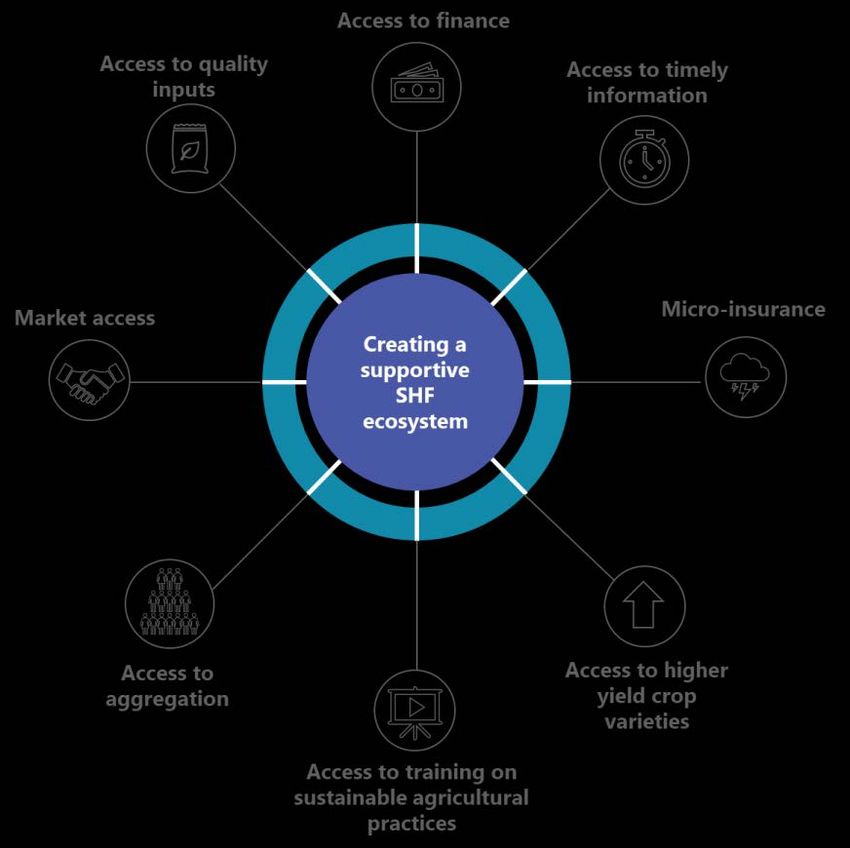
ABOUT THIS DOCUMENT
This document is an output from the Mobilising Investment project for Nationally Determined
Contributions (NDC) implementation, an initiative of the Climate and Development Knowledge Network
(CDKN) that is contracted through and managed by SouthSouthNorth (SSN). The Mobilising Investment
project is funded by the International Climate Initiative (IKI) of the German Federal Ministry for the
Environment, Nature Conservation and Nuclear Safety (BMU), on the basis of a decision adopted by the
German Bundestag.

Throughout the development of the Ethanol Cooking Fuel (ECF) Masterplan, a consultative approach was
taken with both government and non-government stakeholders. The master plan was developed under the
sponsorship of the Kenyan Ministry of Industrialization and involved close coordination through a working
group with representatives from the Ministries of Agriculture, Energy, Health, Environment, and the Sugar
Directorate. Results were presented to the working group at three critical junctures for feedback. The full
draft was then submitted to the working group for a consultative period. The private sector, donor
community, and several development agencies were also engaged through a private sector forum.

To complement this consultative approach and for the purposes of data collection, the team carried out
individual stakeholder interviews. Individual consultation was critical to ensuring that the plan was robustly
developed.

DISCLAIMER
The views expressed in this document are not necessarily those of, or endorsed by, BMU or any of the
entities delivering the Mobilising Investment project, who can accept no responsibility or liability for such
views or information, or for any reliance placed on them. This publication has been prepared for general
guidance on matters of interest only and does not constitute professional advice. You should not act upon
the information contained in this publication without obtaining specific professional advice. No
representation or warranty (express or implied) is given as to the accuracy or completeness of the
information contained in this publication, and, to the extent permitted by law, the entities managing the
delivery of the Mobilising Investment project do not accept or assume any liability, responsibility or duty of
care for any consequences of you or anyone else acting, or refraining to act, in reliance on the information
contained in this publication or for any decision based on it.

                                                                                                            2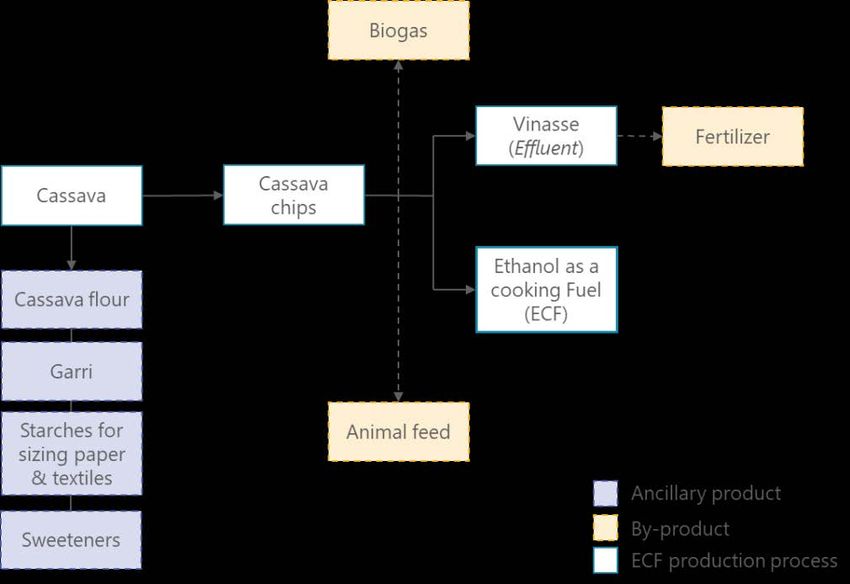
CONTENTS
ABOUT THIS DOCUMENT........................................................................................................................ 2
DISCLAIMER........................................................................................................................................... 2
ACRONYMS ........................................................................................................................................... 5
TERMS AND DEFINITIONS....................................................................................................................... 6
FIGURES & TABLES ................................................................................................................................. 7
EXECUTIVE SUMMARY ........................................................................................................................... 8
      1.1         Objectives ..................................................................................................................................... 8
      1.2         Context ......................................................................................................................................... 8
      1.3         Demand ........................................................................................................................................ 9
      1.4         CAPEX required ............................................................................................................................ 9
      1.5         Impact......................................................................................................................................... 10
      1.6 Recommendations ............................................................................................................................. 11
1. INTRODUCTION................................................................................................................................ 14
      1.6         Objectives and Outputs.............................................................................................................. 14
      1.7         Context ....................................................................................................................................... 14
2      DEMAND FOR ETHANOL COOKING FUEL ....................................................................................... 19
      2.1         Summary .................................................................................................................................... 19
      2.2         Current context of demand........................................................................................................ 19
      2.3         Methodology and results of demand projection ....................................................................... 20
3      SUPPLY OF ETHANOL COOKING FUEL ............................................................................................ 26
      3.1         Summary .................................................................................................................................... 26
      3.2         Context ....................................................................................................................................... 26
      3.3         Sources of Ethanol...................................................................................................................... 27
      3.4         Additional revenue streams from local production of ECF ........................................................ 31
      3.5         Supply gap & CAPEX required .................................................................................................... 33
      3.6         Summary: Total CAPEX required for ECF production ................................................................ 40
4  EMPLOYMENT, INCOME, ENVIRONMENTAL, & HEALTH BENEFITS OF A TRANSITION TO ETHANOL
COOKING FUEL .................................................................................................................................... 41
      4.1         Summary .................................................................................................................................... 41
      4.2         Employment & earnings impact ................................................................................................. 41
      4.3         Environmental and climate impact ............................................................................................ 48
      4.4         Health impact ............................................................................................................................. 51
      4.5         Gender impact ............................................................................................................................ 53
5      RECOMMENDATIONS ................................................................................................................... 55
      5.1         Recommendations to boost demand for ECF ............................................................................ 55
      5.2         Recommendations to support local production of ECF ............................................................. 59
                                                                                                                                    3
ANNEX................................................................................................................................................. 65
Annex 1: Data Sources & Acknowledgments ................................................................................................... 65
Annex 2: Detailed methodology – Supply ........................................................................................................ 67
REFERENCES ........................................................................................................................................ 73

                                                                                                                                                       4
ACRONYMS
ACFC       Agro-chemical and Food Company Limited
AFA        Agriculture and Food Agency
ALRI       Acute Lower Respiratory Infection
CAPEX      Capital Expenditure
CO2eq      Carbon dioxide equivalent emissions
COPD       Chronic Obstructive Pulmonary Disease
DALYs      Disability Adjusted Life Years
ECF        Ethanol Cooking Fuel
GDP        Gross Domestic Product
GHG        Green House Gas
GOK        Government of Kenya
GWh        Giga Watt Hours
HAP        Household Air Pollution
HAPIT      Household Air Pollution Intervention Tool
HH         Households
ILUC       Indirect Land Use Change
KIHBS      Kenya Integrated Household Budget Survey (2015/16)
KITP       Kenya Industrial Transformation Program
KNBS       Kenya National Bureau of Statistics
LPG        Liquified Petroleum Gas
MT         Metric Tons
M3         Cubic Meter
PPTs       Percentage points
SDGs       Sustainable Development Goals
SHF        Small Holder Farmer
SSN        SouthSouthNorth
VAT        Value Added Tax

                                                                5
TERMS AND DEFINITIONS
                          Measure of overall disease burden, expressed as the years lost to ill-health,
DALYS
                          disability or early death
                          Cooking fuels that have serious health, environmental, and socio-economic impact
Dirty fuel
                          (e.g., charcoal, and kerosene)
Distillation              Process of heating up a liquid then cooling
Fermentation              Process by which glucose is converted to ethanol
Feedstock                 Raw material for ethanol production
                          A model that facilitates impact comparisons of interventions which lower
HAPIT model
                          household air pollution
Liquefaction              Process from which glucose is obtained as a fermentable sugar
Molasses                  By-product of sugar production used for ethanol production
Non-renewability factor   A measure of how sustainably fuel is sourced from the forest
PM 2.5                    A common proxy indicator for air pollution
Primary fuel              Fuel source for household cooking that is used most frequently by that household
Purification              Process from which ethanol is separated from other reaction products and inert materials
                          Supplementary fuel source for household cooking that is used alongside
Secondary fuel
                          primary fuel
Stacking                  The use of other fuels/stoves alongside the primary fuel

                                                                                                                     6
FIGURES & TABLES
Table 1: Summary of impact findings ..........................................................................................................10
Table 4: How the domestic ethanol industry is aligned to local and global initiatives ...............................16
Table 5: Number of HHs in urban and rural areas .......................................................................................22
Table 6: Potential target market for ECF .....................................................................................................22
Table 7: Number of HH that can afford ECF ................................................................................................23
Table 8: Number of HHs that can access ECF ..............................................................................................23
Table 9: Scenario assumptions ....................................................................................................................23
Table 10: Number of HH that will switch to ECF .........................................................................................24
Table 11: Total demand for ECF...................................................................................................................25
Table 12: Advantages and disadvantages of the different pathways to produce ethanol (not exhaustive)
 .....................................................................................................................................................................29
Table 13: Equipment and tankers needed to expand distribution..............................................................39
Table 14: Summary of potential job creation in feedstock production (over 10 years) .............................43
Table 15: Summary of potential job creation in ethanol production..........................................................43
Table 16: Summary of potential job creation in ethanol distribution .........................................................44
Table 17: Summary of total number of economic opportunities created across the value chain..............44
Table 18: Summary of potential earnings in feedstock production (per year) ...........................................45
Table 19: Summary of potential earnings in ethanol processing ................................................................45
Table 20: Summary of potential earnings in ethanol distribution ..............................................................46
Table 21: Summary of new income created across the value chain ...........................................................46
Table 22: Summary of Co2eq differential by fuel type (over ten years) .....................................................50
Table 23: Summary of cumulative health impacts from increased adoption of ECF across demand
scenarios ......................................................................................................................................................52
Table 24: Summary of the economic value of deaths averted and DALYs saved (over ten years) .............53

Figure 1: Estimated demand for Ethanol Cooking Fuel (millions of litres) ..................................................19
Figure 2: Cooking fuel use in urban and rural areas (Kenya National Bureau of Bureau of Statistic, 2016)
.....................................................................................................................................................................20
Figure 3: Demand methodology ..................................................................................................................21
Figure 4: Sources of ethanol cooking fuel ...................................................................................................28
Figure 5: Potential co-products and by-products from sugarcane (non-exhaustive) .................................31
Figure 6: Potential co-products and by-products from cassava (non-exhaustive) .....................................32
Figure 7: Supply gap (at feedstock production stage) for different feedstock types (millions of tons per
year) .............................................................................................................................................................34
Figure 8: Land required for feedstock production (thousands of hectares) ...............................................35
Figure 9: CAPEX requirement for large scale farms (billions KES) ...............................................................36
Figure 10: CAPEX required for domestic ethanol processing (billions of KES) ............................................37
Figure 11: Breakdown of CAPEX for molasses-based production (billions of KES) .....................................38
Figure 12: CAPEX required for distribution (millions of KES) ......................................................................39
Figure 13: Total CAPEX required for ethanol production (billions of KES) ..................................................40
Figure 14: Number of SHF jobs/opportunity created (for 50% local production) ......................................43
Figure 15: Factors required to create a supportive smallholder farmer ecosystem...................................47

                                                                                                                                                                      7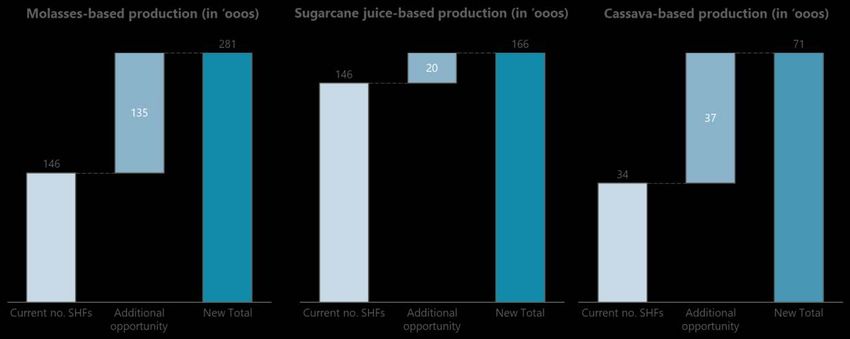
EXECUTIVE SUMMARY
1.1 Objectives
The Ethanol Cooking Fuel (ECF) Masterplan was commissioned by SouthSouthNorth (SSN) to support the
establishment of an ECF industry in Kenya, with the objective of providing potential investors,
policymakers, and researchers with an evidence base to guide the development of ECF infrastructure
and distribution systems in Kenya. It also provides policy recommendations on how the Government of
Kenya and other sector stakeholders can support the industry.

1.2 Context
The current Kenyan cooking fuel market is dominated by charcoal (14.6%), firewood (54.6%), Liquefied
Petroleum Gas (LPG) (13.4%) and kerosene (14%) as primary fuels. The continued dependence on
polluting fuels, defined by those that release pollutants when burnt such as charcoal, firewood, and
kerosene, pose serious health, environmental, and socio-economic costs for Kenya. However, clean
modern cooking fuels are gaining traction, and new suppliers are working with the government to
overcome consumer awareness, affordability, and accessibility barriers. The continuation of these
trends over the next decade is likely to offer ample opportunities for transformative advances in the
adoption of more efficient and cleaner cooking solutions with ECF emerging as a viable clean and
affordable cooking fuel.

ECF is a liquid biofuel that can be produced from a variety of feedstocks including sugary materials such
as sugar cane, molasses; starchy materials such as cassava, potatoes, or maize; or cellulosic material
such as wood, grasses, and agricultural residues. This masterplan highlights ECF production sourced
from molasses, sugarcane juice, and cassava which were identified as the most likely sources of ECF in
Kenya after applying an assessment approach that included evaluation of food security concerns.

If planned and implemented responsibly, a transition to ECF has strong potential to deliver on the
objectives of key national strategies: Kenya’s Big Four Agenda (food security, affordable housing,
manufacturing, and affordable healthcare for all), the Vision 2030 (which aims to transform Kenya into a
newly industrializing, middle-income country providing a high quality of life to all its citizens by 2030)
and the Nationally Determined Contribution (NDC), including the Sustainable Energy for All Initiative and
the National Climate Change Action Plan 2018-2022 (NCCAP). The ECF cooking transition also
potentially contributes to efforts to achieve the global Sustainable Development Goals.

The projected increase in demand for ECF represents a significant opportunity for Kenyan farmers,
ethanol producers, and distributors. The Kenyan government has the opportunity to develop a globally
competitive ethanol production sector, that will be sustained without the need for long term import
tariffs to survive. This will require careful attention to value chain design, the use of the right
technologies & know-how, developing economies of scale and developing attractive markets for co-
products. With the right policy and regulatory support, and implementation of effective safeguards,
there will be investment flow that will trigger accelerated development of a domestic ethanol industry

                                                                                                        8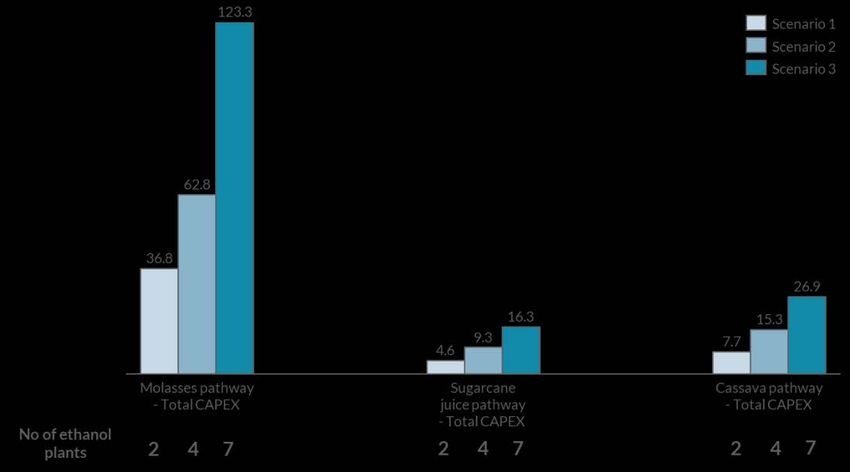
with high potential of growing the country GDP, increase incomes, improve health and protect the
environment.

1.3 Demand
Ethanol cooking fuel is still at a nascent stage in Kenya. However, urban households are rapidly shifting
their primary cooking fuels from kerosene and charcoal to cleaner fuels like liquid petroleum gas (LPG).
In contrast, rural households continue to primarily use firewood. With this trend towards cleaner fuels,
demand for ethanol as cooking fuel is projected to increase drastically over 10 years. Affordability and
availability, enabled by sufficient domestic production and supply chain development, as well as greater
awareness of the health and environmental benefits of ethanol can drive the demand.

This research estimates the demand for ECF in Kenya over a ten-year period, based on a projection
model that considers six drivers: 1) demographic trends 2) current fuel use 3) affordability 4) availability
5) preference 6) stacking1.

Total demand for ethanol across 3 scenarios, discounted for the estimated stacking of other fuels, was
estimated to be:

       •    8 million litres in year 1 rising to 115 million litres in year 10 (Scenario 1 – Low case)
       •    16 million litres in year 1 rising to 192 million litres in year 10 (Scenario 2 – Base case)
       •    24 million litres in year 1 rising to 268 million litres in year 10 (Scenario 3 – High case)

1.4 CAPEX required
Globally, several feedstocks are used to produce ECF, including molasses, sugarcane, corn, cassava, and
sorghum. In Kenya, ethanol is currently exclusively produced through molasses feedstock, a by-product
of sugar production. Ethanol production is therefore inextricably linked to sugar production. Ethanol as a
cooking fuel is still nascent with just 1.2 million litres produced annually. A constraint to production is
the national shortage of molasses due to the inefficient performance of public mills and the reduction of
sugarcane farming.

To address this issue, two other potential feedstock sources were studied in this masterplan: sugarcane
juice and cassava. These feedstock sources were selected based on their suitability for the Kenyan
climate, ethanol production, and impact on food security. On the point of food security, maize was left
out of the study.

The current production levels of all three feedstocks are inadequate to meet projected demand. In
addition, sugarcane and cassava are not grown in the most agriculturally productive areas; production is
concentrated in the Western region while the highest yields are in the coastal regions. Each pathway
also has its own advantages and disadvantages:

            Molasses is a by-product of sugar production and is used to produce ethanol. Kenya also has
            significant technical experience in molasses-based production that can be leveraged. However,
            dependence on the sugar industry often results in shortages and price volatility. Currently, there

1   Stacking is a metric that captures the use of multiple fuel types by the same household

                                                                                                            9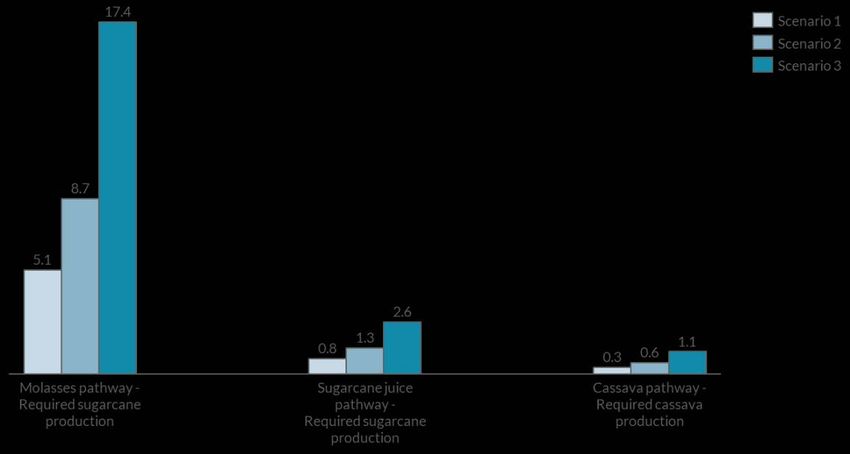
is limited investment in ethanol production, mechanization, low adoption of high yield cane
         varieties and insufficient areas under cane to support an increase in production.

         Sugarcane Juice to ethanol requires lower volumes of sugarcane (than molasses) and therefore
         less hectarage and CAPEX. It also allows for the use of bagasse as a bi product to generate
         energy. However, it would divert raw materials from sugar production creating competition with
         the sugar manufacturing industry. It also has a low shelf-life and faces similar productivity and
         yield challenges as molasses.

         Cassava is not confronted with the same legacy challenges as the sugar industry. It also has
         higher potential yields than other feedstocks, produces bagasse that can be used to generate
         energy and allows for the production of other ancillary products (i.e. flour). However, the value
         chain has a number of challenges including a variety of diseases, quick rotting roots and
         challenges transporting the bulky produce.

The CAPEX required to meet the supply gap and support local production was sized for all three
feedstock sources. Three scenarios (30%, 50% and 100% local ethanol production) were created to
capture potential variability in the domestic production of ethanol over 10 years.

The analysis found that CAPEX for the local production of ethanol could range from KES 13 billion to KES
77 billion with 50% local production. Ethanol processing makes up most of the CAPEX required to
expand the local ECF industry in Kenya (on average 78%), followed by feedstock production (on average
15%) and ethanol distribution (on average 7%). Between 2 to 7 ethanol plants are required to meet
potential demand with Kisumu, Busia, Trans Nzoia, Kilifi or Kwale counties identified as the most
conducive areas for ethanol plants due to the proximity to feedstock. Setting up new dispensers and
purchasing tankers for last-mile distribution will also require major investment to expand the ethanol
distribution network.

1.5 Impact
The creation of a local ECF industry has the potential to create new opportunities across the value chain.
It will also generate positive environmental and health impacts at both the individual and national
levels. It should also be noted that there are potential social and environmental risks associated with
ethanol production including potential risks associated with land use displacement. These risks will need
to be assessed at the planning stage together with a defined and agreed set of safeguards. This report
estimates the potential impact of households switching to ECF on jobs, income, health, and the
environment. The findings are summarized below:

Table 1: Summary of impact findings

                                      • Jobs: Up to 370,000 jobs (with the majority in feedstock
Employment and earnings                 production)
impact                                • New income generated: Up to KES 51 billion, with additional
                                        income of up to KES 180,000 per year for smallholder farmers

                                      • Deforestation averted: Up to 54 million trees saved
Environment impact                    • GHG emissions: Up to 13.5 billion kgs of C02 equivalent saved

                                                                                                        10
• Deaths averted: ~3,700 deaths could be averted
• Disability-adjusted Life Years (DALYs) averted: Up to 507,000
Health impact DALYs
• Economic value of deaths averted and DALYs saved: ~KES 372
million in lost wages
1.6 Recommendations
The masterplan highlights several recommendations for government, donors and the private sector
aimed at boosting demand and supporting local production. The potential impact and rationale for each
are summarized in the tables below.
1.6.1 Recommendations to boost demand for ECF
1) Zero-rating VAT on ECF to level the playing field with LPG and kerosene and stimulate demand. LPG
is zero-rated for VAT and since the 2018 finance bill kerosene has a concessionary VAT of 8%, up from
zero rating since 20132. The VAT on ECF inflates the price at which it is sold to the final customer. This
has the effect of reducing ECF cost competitiveness with other cooking fuels and is dampening down the
growth of the sector.
2) Short-term zero-rating of 25% import duty for denatured ethanol as a cooking fuel: Ethanol has a
25% import duty, compared to 0% for LPG and 9% for kerosene, 3 which inflates the price at which the
fuel is sold to the final consumer. Ethanol import duties should be zero-rated in the short term while
local production is established. The zero-rating should be accompanied by legally bind concession
agreements to ensure distributors pass any tax reductions 100% to the customer.
3) Expand current awareness and communication campaigns to promote ECF and highlight the risk of
traditional cooking fuels: Awareness and communication campaigns will help inform consumers about
the dangers of traditional fuel sources, as well as the availability of affordable clean cooking solutions,
such as ECF.
4) Work with the private sector and donor community to design stove financing options: The upfront
cost of a clean cookstove can be a barrier to consumer uptake. Private sector consumer schemes and
government/donor subsidies should be used to reduce upfront stove costs and enable more households
to access ECF.
5) Expand and enforce existing regulations on kerosene and charcoal to other counties with the
growth of the ECF market: Current regulations on the use of kerosene and charcoal in some counties
should be expanded to discourage the use of “dirty” fuels and support adoption of clean alternatives
such as ECF.
6) Harmonize the Bioethanol Vapour (BEV) stove import tariffs with that of LPG at 10%: The only
impact of the current 25% import tariffs is to drive up the cost of stoves for consumers and prevent
2Kenya Finance Bill 2018
3LPG has an import duty at 0% and kerosene at 9% (Source: Dalberg, June 2018, Scaling up clean cooking in urban Kenya with
LPG & Bio-ethanol, A market and policy analysis)
11lower-income households from accessing ECF. Therefore, the government should harmonize tariffs with
LPG to increase demand.
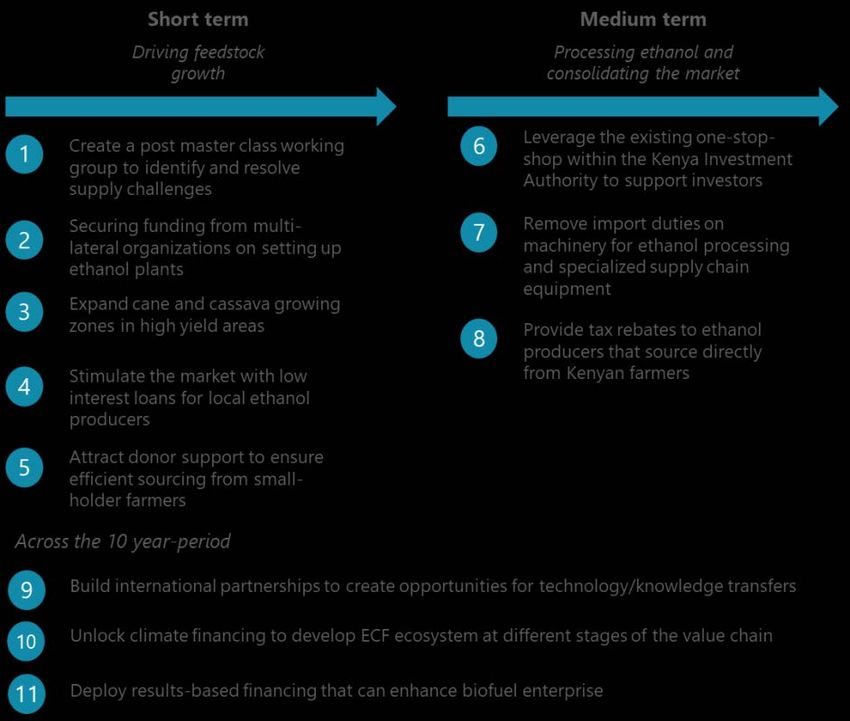
1.5.1 Recommendations to support local production of ECF
7) Create a post-master plan working group to identify and resolve supply challenges: Stakeholders
across the value chain should work together to take the recommendations of this report forward and
build a solution that works for all parties.
8) Secure funding from multi-lateral organizations to conduct feasibility studies on setting up ethanol
plants: To encourage and attract investments, multi-lateral organizations should commission feasibility
studies that examine the financial and operational feasibility of investing in feedstock and ethanol
production.
9) Expand cane and cassava growing zones in high yield areas: Ethanol production relies heavily on the
availability of feedstock such as sugarcane and cassava. As such, increasing investments in sugarcane
and cassava development and land allocated for feedstock production in high yield areas (i.e. Western
and the coastal regions) will be necessary to meet the potential demand for ethanol.
10) Stimulate the market with low-interest loans for local ethanol producers: To meet the CAPEX
requirements across the ethanol value chain, a variety of financing options should be accessible to
current and potential players in the ethanol industry i.e. through low-interest loans from government
agencies.
11) Attract donor support to ensure efficient sourcing from small-holder farmers: The production of
sugarcane and cassava needs to significantly increase to meet the projected targets. Small-holder
farmers can play a key role enabled by efficient sourcing, aggregation, and climate-smart agricultural
practices. Donors should support the establishment of these systems and work with ethanol producers
to implement sustainable sourcing practices.
12) Leverage the existing one-stop-shop within the Kenyan Investment Authority to support investors:
To support and attract investment in the industry, the GOK should leverage the existing one-stop-shop
within the Kenyan Investment Authority to support players along the ECF value chain.
13) Provide tax rebates to ethanol producers that source directly from Kenyan farmers: The feedstock
production of both sugarcane and cassava present an opportunity to create new jobs and increase
income, with a focus on small-holder farmers. The GoK should incentivize ethanol producers to source
their feedstock from Kenyan farmers through tax rebates.
14) Build international partnerships to create opportunities for technology/knowledge transfers:
Partnerships between Kenyan institutes and foreign research institutes will allow for technology/
knowledge spillovers, which will, in turn, improve feedstock yields and overall production.
15) Unlock climate financing to develop the ECF ecosystem at different stages of the value chain: The
substantial environmental benefits of a switch to ECF makes the industry a viable recipient for climate
financing from several multinational organizations. The Kenyan government should attract these funds
by demonstrating the climate and environmental benefits of clean cooking options.
1216) Deploy results-based financing that can enhance biofuel enterprise economics: Results-based
financing from donors and international organizations can improve the competitiveness and
sustainability of the sector by ensuring that players in the ethanol industry meet financial and non-
financial targets, in order to continue to receive funding.
131 INTRODUCTION
1.6 Objectives and Outputs
The Kenyan ethanol cooking fuel (ECF) masterplan aims to support the establishment of an ECF industry
in Kenya, with three key objectives:
1. To facilitate the penetration of ethanol cooking fuel to Kenyan households
2. To provide potential investors, policymakers, and researchers with an evidence base to guide
the development of ECF infrastructure and distribution systems in Kenya.
3. To provide policy recommendations on how the Government of Kenya can support the industry.
This master plan was developed through the following activities:
1. Modeling the potential demand for ECF in Kenya across urban and rural households over a 10-
year period (2020-2029)
2. Modeling the required CAPEX to set up an ECF industry taking into consideration the entire
value chain including feedstock production, ethanol processing, and distribution
3. Modeling the potential financial, environmental, and health benefits of establishing an ECF
industry
4. Extensive stakeholder engagement to identify policy recommendations for government
This document presents a comprehensive overview of the ECF opportunity in Kenya, as well as what it
would take to set up a thriving industry.
1.7 Context
The current Kenyan cooking fuel market is dominated by firewood (54.6%), charcoal (14.6%), kerosene
(14%) and LPG (13.4%) as primary fuels. However, the trend varies in urban and rural areas. Urban
areas have seen a movement towards cleaner fuels like LPG while rural areas are still dominated by
firewood. Nairobi is unique, with a far higher share of households using LPG (44%) and kerosene (47%)
as primary cooking fuels (2017). The latter being the dominant fuel of the Nairobi low-income
households. Even among those who use LPG as a primary cooking fuel, stacking, the use of multiple fuels
and stoves in a household, is a common phenomenon. Therefore, the use of charcoal and kerosene is
more widespread than what is indicated by primary fuel statistics.4
The continued dependence on dirty fuels5 poses serious health, environmental, and socio-economic
costs for Kenya. 8-10% of early deaths are attributable to indoor air pollution from charcoal and
firewood cooking in Kenya 6; this excludes the unquantified but likely substantial negative effects of
kerosene cooking on lung function, infectious illness and cancer risks, as well as burns and poisonings.
Kenya loses 10.3 million m3 of wood from its forests every year from unsustainable charcoal and wood
4 Dalberg (2018). Scaling up clean cooking in urban Kenya with LPG and Bioethanol – A market & policy analysis.
5 Dirty fuels refer to firewood, charcoal and kerosene and pose serious health, environmental, and socio-economic costs
6 Stockholm Research Institute (2016) Discussion brief " How Kenya can transform the charcoal sector and create new
opportunities for low-carbon rural development"
14fuel use7. This deforestation exacerbates food insecurity and harms the agricultural sector. Household
biomass fuel use contributes over 22 million tonnes of CO2 equivalent (CO2eq) each year (as high as 35
Metric Tonnes of CO2eq including fuel production emissions), which is equivalent to 30-40% of total
Kenya greenhouse gas (GHG) emissions8.
Clean modern cooking fuels, notably LPG, are available in Kenya, and new suppliers are working with
the government to overcome consumer awareness, affordability, and accessibility barriers. LPG is well
understood and increasingly common in urban Kenya, but despite continued investments in capacity, it
is unlikely to become the primary cooking fuel for the majority of urban populations due to high costs
and limited availability outside of Nairobi. Electricity for cooking is not viable today in Kenya and has
minimal penetration (~2% in urban Kenya) due to the high costs of electricity tariffs and efficient electric
cookstoves ($200+).
Ethanol Cooking Fuel (ECF) is a viable alternative as a clean and affordable cooking fuel. While still
nascent, there has been significant investment in increasing access with Vivo Energy – a major
distributor of Shell products in Africa, and KOKO Networks - a venture-backed, technology-based
distribution company installing distribution systems and networks to increase national access, beginning
with urban centres such as Nairobi and Mombasa. While other distributors including Safi International
and Leocome are also operating in the market, none are investing at the same scale as KOKO Networks.
The value-added (VAT) exemption for ECF in the government’s latest budget will also help to bring down
the cost for the consumer.
The projected increase in demand for ECF represents a significant opportunity for Kenyan farmers to
build a domestic ethanol industry. With demand (under scenario 2 – base case) projected to be 192M
litres in 2030, ethanol has the potential to generate significant income for the economy.
With the right support and investment into cultivation, manufacturing and distribution, the industry
can create economic opportunities, increase incomes, improve individual’s health and protect the
environment, helping Kenya to fulfil its constitutional responsibilities, achieve its Big Four Agenda,
Vision 2030, sustainable action for all initiative goals, and contribute towards national climate goals and
the global Sustainable Development Goals.
• The Big Four Agenda is focused on (i) Enhancing Manufacturing from 9.2% to 20% of GDP by
2022, (ii) Achieving 100% food security, (iii) Delivering 100% Universal Health Care and (iv)
building 500,000 new affordable homes.
• The Kenya Vision 2030 aims to transform Kenya into a newly industrializing, middle-income
country providing a high quality of life to all its citizens by 2030 in a clean and secure
environment. This is achieved across 4 pillars – Economic, Social, Political and Enablers & Macro.
• Kenya’s Nationally Determined Contribution (NDC) – Kenya submitted its NDC on 28th
December 2016, when it deposited its instrument of ratification for the Paris Agreement under
7Dalberg (2018), “Scaling up clean cooking in urban Kenya with LPG and Bioethanol – A market & policy analysis p8
8 Dalberg estimate based on bottom up build-up of Kenya cooking emissions based on fuel mix, average fuel volumes, and
standard emission factors including CH4 and NO2, but excluding BC. Note that WRI CAIT total CO2 emissions for Kenya (2013)
are estimated at 60.53 MT CO2eq total, which we believe is an underestimate as the number only includesthe United Nations Framework Convention on Climate Change (UNFCCC). The mitigation
contribution intends to abate greenhouse gas (GHG) emissions by 30% by 2030 relative to the
business as usual (BAU) scenario of 143 million tonnes of carbon dioxide equivalent (Metric
Tonnes of CO2 e).
• The Global Sustainable Development Goals (SDGs) are a collection of 17 global goals set by the
UN General Assembly in 2015 for 2030. These include no poverty, affordable and clean energy,
decent work, economic growth, and climate action.
• The Constitution of Kenya provides that every person has the right to the highest attainable
standard of health and that the state has obligations to ensure sustainable exploitation,
utilization, management and conservation of the environment and natural resources, including
land.
The table below outlines how the domestic ethanol industry is aligned with government objectives:
Table 2: How the domestic ethanol industry is aligned to local and global initiatives
The Big Four Agenda
Target Description ECF Industry Impact
Boost the Increase the • Investment in the ethanol industry
manufacturing manufacturing sector’s will boost manufacturing, by creating
industry share of GDP from a new industry
about 9% in 2017 to
15% in 2022
Create jobs for The government plans • Up to 3,480 jobs can be created in
young people to create 1.3 million ethanol manufacturing depending on
within manufacturing jobs by the extent of local production and
manufacturing 2022 the production pathway chosen
Food security Achieve 100% food • Investment in cassava and sugar cane
security; to reach 1 will boost yields, providing feedstock
million farmers and for Ethanol as well as food for
unlock 150,000 acres of consumption.
uncultivated land • The potential 54 million trees to be
saved can protect the country's
renewable surface water resources.
Universal Delivering 100% • In 2013, 1.66 million DALYs (on
Healthcare Universal Health Care average) were lost in Kenya due to ill-
health, disability, and early death as a
result of Household Air-Pollution.
With up to 507,000 DALYs saved by
switching to ethanol, UHC will
become more attainable.
Kenya Vision 2030
Promote export- Boost the capacity and • Investment in the Ethanol industry
driven local content of will provide a significant boost to
manufacturing domestically manufacturing, with the potential to
manufactured goods export into new markets
16Increase forest Increase the forest • Reducing the use of charcoal will
cover cover by 10% by 2022 increase the forest cover, which will
in turn increase water availability and
reduce food security
Kenya’s Nationally Determined Contribution (NDC)
Reduce Reduce greenhouse gas • Up to 13.5 billion kgs of CO2 could be
greenhouse (GHG) emissions by 30% saved cumulatively over a ten-year
emissions by 2030 relative to the period by switching to ECF
business as usual
Sustainable Energy for All Initiative – Kenya Action Agenda
Increase the Increase the • The development of a domestic ECF
penetration penetration rate of industry will contribute to the
rate of clean clean fuels to 100% by objective of increasing the uptake of
fuels 2028 clean fuels in Kenya
National Climate Change Action Plan 2018-2022
Promote the Reduce the number of • The development of a domestic ECF
transition to household biomass industry will contribute to the
clean cooking related deaths from objective of increasing the uptake of
49% of total deaths to clean fuels in Kenya
20%.
Global Sustainable Development Goals
Good Health Ensure healthy lives and • ~3,700 deaths could be averted by
and Well-being promote well-being for households switching to ECF from
all at all ages. other cooking fuels
• Up to 507,000 DALYs could be saved
over ten-years
Affordable and Ensure access to • With the removal of VAT on ECF sales
Clean Energy affordable, reliable, and potentially lower costs from
sustainable and modern domestic production, ECF will be the
energy for all. cheapest cooking option
Decent Work Promote sustained, • Up to 370,000 jobs can be created by
and Economic inclusive and a domestic ethanol market
Growth sustainable economic depending on the extent of local
growth, full and production and the production
productive employment pathway chosen
and decent work for all • Up to KES 51 billion can be generated
in new income by a domestic ethanol
market, with potential new income of
up to KES 180,000 per year for
smallholder farmers
Industry, Build resilient • The investment in ethanol
Innovation, and infrastructure, promote manufacturing and distribution will
Infrastructure inclusive and boost industry and innovation in
sustainable Kenya
industrialization and
foster innovation
17Climate Action Take urgent action to • Up to 54 million trees could be saved
combat climate change over a 10-year period from
and its impacts households switching from charcoal
to ECF
• Up to 13.5 billion kgs of Co2 eq could
be saved cumulatively over a ten-year
period by switching to ECF
182 DEMAND FOR ETHANOL COOKING FUEL
2.1 Summary
• Firewood, charcoal, and kerosene are still the dominant cooking fuels in Kenya. However, urban
households are rapidly shifting their primary cooking fuels from kerosene and charcoal to
cleaner fuels like LPG. In contrast, rural households have shown less shift and are still dominated
by firewood.
• With this trend towards cleaner fuels among households in the background, demand for ethanol
as a primary cooking fuel is projected to increase drastically over 10 years. Affordability and
availability, enabled by sufficient domestic production and supply chain development, as well as
greater awareness of the health and environmental benefits of ethanol over traditional fuels,
will be key to drive the demand.
• 3 scenarios were created to capture variability in demand assumptions. Total demand (in litres)
for ethanol across 3 scenarios, discounted for the estimated stacking of other fuels, was
estimated to be
o 8 million in year 1 rising to 115 million in year 10 (Scenario 1: Low case)
o 16 million in year 1 rising to 192 million in year 10 (Scenario 2: Base case)
o 24 million in year 1 rising to 268 million in year 10 (Scenario 3: High case)
Figure 1: Estimated demand for Ethanol Cooking Fuel (millions of litres)
2.2 Current context of demand
The demand for the various kinds of cooking fuels has changed significantly over the last 10 years in
Kenya. However, the degree of change has varied between urban and rural households. Urban areas
have seen a decline in the demand for dirty fuels such as charcoal and kerosene by 10 and 16
percentage points (ppts), respectively, likely driven by the rising prices and the restrictive regulations in
several counties. This has, in turn, led to increased use of LPG and firewood, which have increased by 14
ppts and 6 ppts, respectively. The rapid increase in LPG use demonstrates the potential for a further
19shift towards cleaner fuels, including ethanol among urban households. However, primary cooking fuel
among rural households continues to be dominated by firewood, only 5 ppts down in a decade to 2016.
These trends are illustrated in the diagram below.
Figure 2: Cooking fuel use in urban and rural areas (Kenya National Bureau of Bureau of Statistic, 2016)
ECF use in Kenya is still at a nascent stage (included in the “other” category in the figure above) but
there is significant potential to move households in both rural and urban from solid and dirty fuels to
ethanol. Investment in the sector is also rapidly increasing. Vivo Energy – a major distributor of Shell
products in Africa, and KOKO Networks - a venture-backed, technology-based distribution company are
investing in distribution systems and networks to increase national access, beginning with urban centers
such as Nairobi and Mombasa. KOKO Networks has currently installed up to 700 retail points across
Nairobi, with plans to expand to Mombasa and other counties from 2020. In order to drive awareness,
KOKO Networks is also running advertisements on media channels across the country. In addition,
market activations and demos are currently being deployed in urban neighborhoods to provide potential
users with the opportunity to test ECF and understand the benefits of using the fuel. While other
distributors including Safi International and Leocome are also operating in the market, none are
investing at the same scale as KOKO Networks.
2.3 Methodology and results of demand projection
This research estimates the demand for ethanol cooking fuel (ECF) in Kenya over a ten-year period,
based on a projection model that accounts for various factors. The model relies on the most recent
Kenya National Bureau of Statistics household survey, the 2015/16 Kenya Integrated Household Budget
Survey (2015/16 KIHBS),9 and displays approximate calculations.
Two major variables were required to estimate the demand for ECF in Kenya over 10 years: the number
of households that will primarily use ECF and the average number of litres consumed per household. 6
9The 2015/16 KIHBS is a nationally representative, population-based household survey that was conducted over a 12-month
period from September 2015 to August 2016. The KIHBS survey sampled 24,000 households drawn from 2,400 clusters across
the country.
20drivers were considered to calculate the number of households that will use ECF as their primary fuel.
They are:
• Demographic trends: The estimated population growth and urbanization rates
• Current fuel use: The proportion of households that pay for fuel vs. those that use non-
monetized fuels such as wood, animal dung, and grass for cooking
• Affordability: The proportion of households that can afford to purchase ethanol cooking fuel
• Availability: The number of households that can access ECF considering infrastructure
constraints
• Preference: The number of households that will choose to use ECF given affordability and access
• Stacking: A metric that captures the use of multiple fuel types by the same household
Figure 3: Demand methodology
To calculate total demand, a four-part approach was employed:
1) Demographic trends, current fuel use, & affordability were used to calculate the baseline – i.e.
the number of households that can afford ECF
2) The baseline was discounted to account for the availability of ECF in urban and rural areas
3) Three scenarios were created to capture variability in preference for and eventual uptake of ECF
4) Finally, the total volume of ECF demanded was calculated by multiplying the number of
households (adjusted for cooking fuel stacking) by the average consumption (in litres) per
household.
212.3.1 Calculating the baseline number of households
2.3.1.1 Demographic trends
The total number of households in Kenya over a period of 10 years was calculated by projecting the total
population10 by the average population growth rate 11 and dividing the population by the average
number of individuals per household. Households were kept constant at 4 people for simplicity.
Households were categorized into urban and rural areas by applying the percentages for urban/rural
split from KHIBS. Finally, an urbanization rate12 was applied to urban households to account for the
movement of people to urban areas. The number of households in rural areas was then adjusted to
account for this trend. The total number of households in urban areas was estimated to be ~5.2million
in year 1 growing to ~6.5 million in year 10, while the rural households were ~6.2 million in year 1
growing to ~7.9 million in year 10. The total number of households starts at 11.4 million, growing to 14.4
million by year 10.
Table 3: Number of HHs in urban and rural areas
No of households Year 1 Year 10
Rural 5,182,770 6,529,624
Urban 6,231,230 7,850,549
Total 11,414,000 14,380,173
2.3.1.2 Calculating the potential target market for ECF
To calculate the potential target market for ECF, the percentage of households in rural and urban areas
who use different kinds of cooking fuel (firewood, charcoal, kerosene, LPG, and electricity) was sourced
from KHIBS. Applying these percentages to the total number of households results in the number of
households that primarily use each fuel type. Households that primarily use firewood (84% of rural
households and 16% of urban households) were excluded from the calculation, based on the
assumption that most users of firewood collect their wood for free, and would be unlikely to switch to a
paid fuel (at least in the short term). This brought the potential target market to ~4.9 million households
in year 1 and ~6.2 million households in year 10.
Table 4: Potential target market for ECF
No of households Year 1 Year 10
Rural 900,000 1,100,000
Urban 4,000,000 5,100,000
Total 4,900,00 6,200,000
2.3.1.3 Affordability: Calculating baseline i.e. the number of households that can afford ECF
To estimate the number of households that can afford ECF, we calculated the percentage of household
income that is typically dedicated to cooking energy, by dividing the average monthly cost of cooking by
average monthly household income13. This came to approximately 15% of monthly income. We then
10 Kenya Integrated Household Budget Survey (KIHBS) 2016
11 Data.worldbank.org. (2019). World Bank Open Data | Data. [online] Available at: https://data.worldbank.org.
12 Cia.gov. (2019). The World Factbook - Central Intelligence Agency. [online] Available at:
https://www.cia.gov/library/publications/the-world-factbook.
13 Monthly income data is available for ~6000 households
22calculated the percentage of households that can afford to buy ECF at current prices of 95KES14 per liter
in rural areas and 100KES15 per liter in urban areas. Applying these percentages to the target market
above results in the number of households that can afford ECF. The increase in the number of
households that can afford ECF is driven by yearly population growth, and the yearly increase in per
capita income, estimated at 2%.
Table 5: Number of HH that can afford ECF
No of households Year 1 Year 10
Rural 400,000 600,000
Urban 2,100,000 3,000,000
Total 2,500,000 3,600,000
2.3.2 Availability: Calculating the number of HHs that can access ECF
Availability assumptions account for the constraints in access and distribution of ethanol which could
vary widely, particularly between urban and rural areas. These assumptions were based on the
expansion strategy of the current major distributor of ECF, KOKO Networks. Availability is expected to
increase rapidly in urban areas rising to 100% by year 5. In rural areas due to infrastructural challenges,
access is expected to reach a maximum of 20% of households over the 10-year period.
Table 6: Number of HHs that can access ECF
No of households Year 1 Year 10
Rural 0 100,000
Urban 630,000 2,900,000
Total 630,000 3,000,000
2.3.3 Scenario Analysis: Calculating the impact of preference on demand
After calculating the baseline number of households that can afford ECF, 3 scenarios were developed to
capture the impact of preference on demand. Preference can be influenced by a number of factors
including education, peer influence, cooking practices or taste. Each of these scenarios differ for urban
and rural areas and range from low to high. The scenarios are the basis of the final demand scenarios
and are summarized below:
Table 7: Scenario assumptions
Demand driver Scenario 1 (Low case) Scenario 2 (Base case) Scenario 3 (High case)
Preference Most HHs continue to use other ECF preference reaches moderate ECF becomes one of the preferred
Scenarios cooking fuels: Awareness and levels: A sizable no of rural & urban cooking fuels: Highly successful
exposure to the benefits of ECF households switch to ECF. ~15% of campaigns and uptake, with 20% and
remains low with only 10% and urban HHs will choose to use ECF as 35% of rural and urban HHs
15% of HHs in rural and urban their primary fuel in year 10 while respectively switching to ECF by year
areas switching, in year 10 while 25% of rural HHs make the switch 10. ECF becomes more preferred than
others mainly use alternatives LPG, kerosene & charcoal
14 Data estimate from KOKO Networks
15 Data estimate from KOKO Networks
232.3.3.1 Preference: Calculating the no. of households that will adopt ECF as their primary
fuel, given affordability and access
To account for varied household preferences in the choice of cooking fuel, assumptions were made on
the proportion of households that will choose to use ECF as their primary fuel, given affordability and
access. Scenario analysis was used to capture potential variability. The choice of ECF will depend on a
range of factors, including awareness, local traditions and the perceived benefits to households amongst
others16. As these factors change, the uptake of ECF is expected to ramp up relatively quickly.
Households in urban areas were assumed to have higher uptake levels than households in rural areas
given reduced awareness and exposure to clean cooking solutions in rural areas. In addition, cooking
fuels are generally non-monetized in rural areas leading to a lower willingness to pay. Based on the
assumptions outlined in the table above, the number of households that will choose to switch to ECF is
calculated below:
Table 8: Number of HH that will switch to ECF
No of households Year 1 Year 10
Rural 0 12,000
Scenario 1 Urban 32,000 448,000
Total 32,000 460,000
Rural 0 18,000
Scenario 2 Urban 63,000 743,000
Total 63,000 761,000
Rural 0 24,000
Scenario 3 Urban 95,000 1,036,000
Total 95,000 1,060,000
2.3.3.2 Stacking: Taking fuel stacking into consideration
Many households that switch to ECF as their primary fuel will still combine multiple fuels over the
course of the year in practice. This is a behavior known as fuel stacking. The World Bank multi-tiered
energy access survey data was used to calculate the percentage of households that stack in urban and
rural areas, to count for stacking in the demand projection. This was calculated to be ~37% in rural areas
and ~16% in urban areas17. For these households, an assumption was made that ~50% of their fuel
needs would come from their primary fuel source, i.e. ECF. For households that do not stack, it is
assumed that 100% of their cooking energy would come from ECF. The household figures above were
then adjusted to reflect stacking.
2.3.4 Calculating the number of litres of ECF demanded
To calculate the total demand for ECF in Kenya over the next 10 years, the total number of households
that will prefer ECF (adjusted for stacking) was multiplied by the average number of litres consumed per
household per year (~275 litres)18. The total demand for ECF from year 1 to 10 is summarized below:
16 These factors are expected to change with increases in awareness, and as households begin to understand the importance of
clean fuels to health, and the environment
17 Fuel stacking percentages were based on the number of households that reported having a secondary cooking fuel source
18 Dalberg (2018). Scaling up clean cooking in urban Kenya with LPG and Bioethanol – A market & policy analysis.
24You can also read