Evaluation of Concessionary Bus Travel - The impacts of the free bus pass Moving Britain Ahead - Gov.uk
←
→
Page content transcription
If your browser does not render page correctly, please read the page content below
Evaluation of Concessionary Bus
Travel
The impacts of the free bus pass

Moving Britain Ahead
The Department for Transport has actively considered the needs of blind and partially sighted people in accessing this document. The text will be made available in full on the Department’s website. The text may be freely downloaded and translated by individuals or organisations for conversion into other accessible formats. If you have other needs in this regard please contact the Department. Department for Transport Great Minster House 33 Horseferry Road London SW1P 4DR Telephone 0300 330 3000 General enquiries https://forms.dft.gov.uk Website www.gov.uk/dft Crown copyright 2016 Copyright in the typographical arrangement rests with the Crown. You may re-use this information (not including logos or third-party material) free of charge in any format or medium, under the terms of the Open Government Licence v3.0. To view this licence visit http://www.nationalarchives.gov.uk/doc/open- government-licence/version/3 or write to the Information Policy Team, The National Archives, Kew, London TW9 4DU, or e-mail: psi@nationalarchives.gsi.gov.uk. Where we have identified any third-party copyright information you will need to obtain permission from the copyright holders concerned.
Contents
Executive summary _________________________________________________________ 4
Introduction _______________________________________________________________ 9
Chapter 1 ________________________________________________________________ 11
Chapter 2 ________________________________________________________________ 31
Chapter 3 ________________________________________________________________ 46
Conclusion ________________________________________________________________ 60

                                      3
Executive summary
1. The English National Travel Concession Scheme (ENCTS) allows free off
peak1 bus travel for residents of England of pensionable age and for disabled
people 2. Local authorities have the ability to introduce additional
“discretionary” concessions funded by their local tax base, such as extending
the time of availability or allowing carers of disabled residents free travel when
they accompany them.
2. Prior to the ENCTS, a statutory half-fare off peak concession was in place.
Free concessionary travel was introduced in April 2006 and applied only to
journeys made within an individual local authority, but in April 2008 was
extended to include free off peak travel in any part of England. Since April
2010, the age of eligibility has been increasing with changes to the state
pension age. This means that eligibility for a bus pass is gradually increasing
from 60 to 66 between 2010 and 2020.
3. This report examines statistical and academic evidence about the use and
impacts of concessionary travel, and provides an economic appraisal of the
policy’s costs and benefits.
Characteristics of older concessionary travellers
4. We have used statistical data sources (predominantly the National Travel
Survey (NTS) and Department for Transport (DfT) bus statistics 3), academic
literature and reports from the transport sector, to analyse the impacts of the
ENCTS, with a specific focus on older pass holders. This analysis does not
look at or make any conclusions on the disabled persons’ concession due to a
lack of data.
5. Since the concession was introduced, take up of the pass has steadily
increased. We find that females have consistently had a higher take up of the
concessionary bus pass, probably in part because the number of holders of
driving licences is considerably lower for older women 4.
6. Data shows that people are more likely to take up the pass if they: are in lower
income households, have no access to cars, live in metropolitan areas or
generally live near better bus links.
7. In terms of bus pass usage, pass holders without access to a car make more
than three times as many trips as passholders with access to a car. Those
from lower income households also make more trips – pass holders with
income of less than £10,000 per annum made twice as many trips than those
receiving £20,000 or more.
8. The number of trips per pass holder per year falls, as the area type becomes
less populated. These areas typically have less frequent bus services with
1 Between the hours of 09:30 and 23:00 on weekdays, and all day at the weekend and on bank
holidays.
2 Disability criteria are outlined in the Transport Act 2000.
3 Available at https://www.gov.uk/government/collections/bus-statistics
4 In 2013 for example, the percentage of those aged 70 with a full driving licence was 82% for males
and 47% for females. Source: DfT (2015) National Travel Survey: NTS0201
4fewer destinations served (it may be that in some rural areas, no bus services
run or there is one return service a day to the local town centre). London
borough pass holders make the greatest number of journeys per annum
(around 200), and this reduces to around 150 in metropolitan and 50 in rural
areas. Additionally, concessionaires who live closer to a bus stop and are
served by more frequent buses make considerably more trips. Some of these
findings are also corroborated by the academic literature.
9. From the NTS we estimate that 830,000 people in households with no car
access and incomes below £15,000 use concessionary travel at least once a
week.
10. Overall, females and both men and women aged between 70 and 79 years
make more bus journeys than the average pass holder. This indicates that
men and more recent retirees, who are more likely to drive, use the
concession less often. It also suggests that pass holders over 80, who might
be less active, use the concession less often.
11. Notably, there has been a decline in the number of trips per pass holder over
time, from 118 per pass holder per year in 2002, to 94 in 2012. Some of this
decline could be due to the fact that those who may have most pressing need
for a pass, and therefore are most likely to make a lot of trips with it, took up
the pass prior to bus travel becoming free travel in 2006. Those with the most
pressing need might include people on low incomes or lacking a car, who
might take up the first opportunity to have a pass, and these groups of people
tend to make more journeys using their pass.
Evidence from the academic literature
12. The academic literature in general does not present robust, conclusive
evidence on the relationship between the ENCTS, improvements in access to
services and socialisation, and the consequent impact on the quality of life of
older people. However, some tentative conclusions could be made.
13. Some of the academic evidence suggests that pass holders use the
concession to socialise, including making trips that they would not otherwise
make if they had to pay a fare. Also, the ENCTS has incentivised some
concessionary travellers to be more active as bus journeys are likely to
involve some element of walking, and may serve as a means to further
physical activity at their destinations.
14. The literature also confirms that the abolition of fares has contributed small
increases to pass holders’ disposable income. Additionally, some motorist
pass holders report the concession has encouraged them to switch some car
trips to the bus, and helped them avoid some motoring costs, such as parking
fees. It has also enabled some to do more of things they like, such as
volunteering and avoid doing things they do not like, such as the annoyance
of driving in bad weather conditions, looking for parking spots etc. Some pass
holders report that this has made small positive contributions to their quality of
life.
15. Concessionary travellers in the survey literature cite increased flexibility in
their daily routines as well as increased variety in their choice of destinations
5as evidence of life improvements. Indeed, one survey 5 found that pass
holders value the pass more than being given its monetary value in cash. This
could be because it makes travelling slightly more convenient due to cashless
boarding, local benefits that could be bundled with the pass (such as a library
card) or a general attitude towards the freedom that the pass provides.
16. There might be a difference between the characteristics of bus pass usage of
those who had a pass before the ENCTS (“old users” who travelled under the
half price concession) and those who subsequently obtained one (“new
users”). A study found that newly issued passes are associated with lower trip
levels and this could be part of the reason for the decline in average journeys
per pass holder.
17. It is also suggested that “new users” are more likely to have access to a car,
hold a driving licence, and less likely to be in receipt of benefits. This would
indicate that those that are more likely to be dependent on the bus, and
therefore most in need of the concessionary pass (low income and low car
ownership), are those who already held the pass prior to the free concession
coming in.
18. Just under 25% of those that are eligible to hold a pass have not taken it up,
according to NTS evidence. A portion of these is likely to be individuals who
have access to a car and do not need bus travel. However further research is
needed to identify the possible reasons as to why they have chosen not to
take up the pass, as some non-users may face barriers in obtaining the pass
or accessing bus services more widely. They may be more vulnerable and it is
possible that some of those that are most prone to the processes of social
exclusion are not deriving the benefits from the scheme.
Value for money assessment
19. We have carried out a cost-benefit analysis of the ENCTS to estimate the
costs to government as well as the benefits the scheme brings to both its
users and society, and we have generated a benefit cost ratio (BCR) for the
scheme.
20. We present a BCR and a sensitivity test:
• central case BCR: reported according to well-established WebTAG
appraisal principles
• sensitivity test: including more uncertain calculations of additional
benefits, which are not currently covered in WebTAG guidance and are
illustrative only.
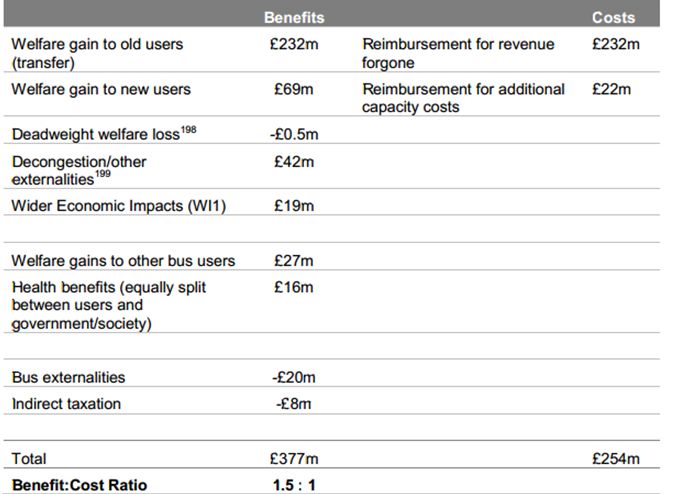
21. The BCR benefits include consumer benefit, net effect on congestion and
greenhouse gas emissions, and increased tax revenue to the Treasury. The
ENCTS puts extra bus capacity on the road which is estimated to have a net
negative impact on congestion and greenhouse gas emissions. Money that
5Andrews, G., Parkhurst, G., Susilo, Y., & Shaw, J. (2012) The Grey Escape: Investigating older
people's use of the free bus pass. Transportation Planning and Technology , 35 (1), 3-15.
6would have been spent on VAT-exempt fares is now spent in the rest of the
economy, where it attracts VAT, providing a positive transfer to government.
22. The sensitivity test includes health benefits to pass holders and society from
more active lifestyles, improvements in bus frequency due to the extra bus
capacity, and concessionaires’ small benefit from more convenient cashless
boarding.
23. The costs of the scheme are made up of the costs of reimbursing bus
operators for foregone fares and additional operating costs, as well as admin
costs to government.
24. We analyse the London market separately to the rest of England. The reason
is that free concessionary and disabled travel has been available in London
for a much longer period of time, compared to the rest of the country, and the
travel behaviour adjustments by pass holders had occurred before the
ENCTS became statutory. Therefore, we assume the ENCTS has not added
any bus capacity to the Transport for London (TfL) network and it has no
impact on congestion, greenhouse gasses or bus frequency improvements to
offer. The cashless benefit also does not apply, as London concessionaires
have been boarding without paying fares prior to the ENCTS.
25. The analysis indicates that in London, the BCR is 1.18, whilst in the rest of
England it is 1.16. When we add the benefits incorporated in the sensitivity
test, the BCRs rise to 1.32 in London and 1.40 in the rest of England.
26. The BCR is higher in London than in the rest of England due to the lack of
generated bus capacity (which adds congestion and greenhouse emission
costs from generated bus traffic). This is reversed in the sensitivity case,
when estimates of the additional benefits outside the capital are taken into
account, as the policy has provided cashless boarding and some additional
bus frequency.
27. The quantitative analysis on its own suggest low value for money as the
BCRs all fall under 1.50, the medium value for money threshold 6, yet there
are other elements which help inform the overall value for money category,
according to Departmental guidance. There are non-monetised benefits
associated with the scheme that are reflected in wider academic and industry
literature, which might bring the scheme up to medium value for money
(equivalent to a BCR of over 1.50) if we were able to robustly monetise them.
Therefore, we judge that the policy delivers low to medium value for money.
Value for money in 2021
28. We have also attempted to project a likely scenario of the costs and benefits
of concessionary travel in 2021, as the increases in eligibility age over the
next few years are expected to shrink the number of eligible pass holders. We
project that they might fall from 10.9m in 2015 to 10.2m in 2021 as new pass
holders are added at a slower rate.
29. We project a small decline in the number of concessionary trips in 2021 in
both London and the rest of England, which reduces costs to government
6Department for Transport (DfT), Value for Money Assessments. Available at
https://www.gov.uk/government/uploads/system/uploads/attachment_data/file/255126/value-for-
money-external.pdf%20%20%20
7from their 2015 level of £285m in London and £854m in the rest of England
respectively, to £257m and £828m (in constant 2015 prices).
30. The BCR in London is projected to stay roughly the same in 2021, but
expected to fall slightly in the rest of England – from 1.16 in the central and
1.40 in the sensitivity case in 2015, to 1.09 and 1.33 respectively. This is
because the damage costs of added bus capacity outside the capital, are
predicted to be worse per trip in 2021, as worsening climate change in the
near term makes additional pollution more damaging. This dampens the level
of net benefit, and consequently the BCR. As a result the value for money
case for the scheme in England excluding London could be weaker in the
future.
31. Our analysis suggests that pegging the eligibility age to the increasing state
pension age could help keep the concession affordable until 2021, as the real
reimbursement costs are projected to be fairly constant. However without
increasing the eligibility age further post-2021, the costs to government are
expected to start increasing in real terms with the ageing population.
8Introduction
The English National Travel Concession Scheme allows free bus travel for residents
of England of pensionable age and for disabled people between the hours of 09:30
and 23:00 on weekdays, and all day at the weekend and on bank holidays. Local
authorities have the ability to introduce additional “discretionary” concessions funded
by their local tax base, such as extending the time of availability or allowing carers of
disabled residents free travel when they accompany them.
A statutory half-fare minimum concession has existed for off-peak local bus services
for older and disabled people since 2003. When the free concession was first
introduced in April 2006 it applied only to journeys made within an individual local
authority, but in April 2008 was extended to include free off peak travel across
England. Since April 2010, the age of eligibility has been increasing with changes to
the state pension age. This means that eligibility for a bus pass is gradually
increasing from 60-66 between 2010 and 2020.
London has largely been treated separately from the rest of the country in this report.
This is because London has offered free concessionary travel for older people for a
much longer time than has been the case with the rest of England and including it
has a distortionary effect in determining the true impact of the introduction of the
national concession. We also look more at the mandatory element of the concession.
While some other modes of travel are available discretionally in some areas such as
rail and trams, this evaluation is designed to look at the impact of free bus travel.
From the introduction of the free concession, it was believed that the concession
would reduce the cost of travel for those people eligible and help those households
without access to a car to travel in their local area. When the concession was
extended to cover travel in all of England, the importance of public transport and the
role access to transport has to play in tackling social exclusion and maintaining
wellbeing was noted.
The policy objective of statutory concessionary travel can therefore be defined as
reducing the cost of bus travel for disabled and older people (in particular those
without access to a car) and contributing to:
• improved access to essential services;
• improved access to friends and family;
• improved access to leisure activities; and
• facilitating independent living for longer.
While these were the expected direct benefits, the scheme was also expected to
generate considerable indirect benefits such as decongestion from journeys
switched from cars to bus, and benefits to the local economy from increased
expenditure as a result of more frequent shopping trips.
Whilst the Government has committed to keeping the statutory travel concession in
England until at least the end of the current parliament, the Department is
9responsible for demonstrating that policy initiatives achieve their objectives and the
anticipated value for money to the taxpayer. This evaluation will bring together
information and data from various sources in order that the realised outcomes of the
concessionary travel scheme can be judged against their planned objectives.
This evaluation will take the following format:
Chapter 1 brings together evidence from statistical sources (predominantly the
National Travel Survey 7) to gain a broader understanding of the characteristics of
those people who are using the concessionary scheme.
Chapter 2 collates evidence on the effectiveness of the concession in helping to
improve the quality of life of older and disabled people in England.
Chapter 3 uses the evidence gathered in Chapters 1 and 2, as well as other sources
of data, to estimate the benefits of the concession, thereby generating a value for
money assessment.
The Conclusion draws up the findings of the preceding Chapters into a high level
assessment of the extent to which the concession may be meeting its objectives.
7 For background information about the NTS, e.g. data collection methods, sample size, see the NTS
Statistical release and Technical Report, available at
https://www.gov.uk/government/uploads/system/uploads/attachment_data/file/342160/nts2013-01.pdf
and https://www.gov.uk/government/uploads/system/uploads/attachment_data/file/337263/nts2013-
technical.pdf respectively.
The NTS is primarily designed to track long term changes. All survey results are subject to sampling
error. Therefore, some of the year to year changes may not be statistically significant and are just
sample variability due to the characteristics of the individuals surveyed in a given year rather than a
real change in behaviour.
10Chapter 1
Who is using the concession, where and how
often?
1.1. Introduction
This section will highlight the key characteristics of people using the travel
concession in England, looking both at the take up of passes and the number of
boardings per pass. Each of these areas will be looked at in turn, and within each a
number of characteristics will be considered in an attempt to draw some conclusions
as to who is using the concession, where they are using it and how often they use it.
1.2. Take-Up of Concessionary Passes
1.2.1. General Take-Up of Concessionary Passes
As can be seen from figure 1, the percentage of eligible older people in England
(excluding London) who have taken up the option of holding a concessionary pass
has increased from 53% in 2002 to 76% in 2012.
Take-up of Concessionary Travel Pass
(for those eligable for a pass based on age)
100
90 77 76
70 74 76
80
64
70 57
Percentage
53 50 49
60 50
50
40
30
20
10
0
2002 2003 2004 2005 2006 2007 2008 2009 2010 2011 2012
Year
Figure 1: Take up of Concessionary Travel Passes
The half fare scheme started in 2001 with eligibility at the pensionable age (60 for
women and 65 for men). A discrimination case was won by campaigners and the
age of eligibility became the same for both genders (at the female pensionable age).
Around the introduction of the equal half fare scheme in 2003 take up was around
50%. The move from half-fare to a free local concession in 2006 brings an increase
in the proportion of people holding the pass while trend growth has continued to rise.
However, the rate of change has slowly decreased (and fallen slightly in 2012),
which suggests that even with the full national concession (which has been in place
since 2008), there will remain a group of people who do not take up the option of
holding a concessionary bus pass.
11Whilst there was a clear step-change in the proportion of people in England holding
a pass in 2006 following the introduction of free local bus travel, we cannot be
certain whether this was as a result of increased awareness of the scheme amongst
eligible people or due to the increased benefits of holding a concessionary pass. In
all likelihood, some combination of the two is most likely, although there is evidence
to suggest that the increased benefits of holding is a more prevalent factor.
There may be further factors driving the increase in pass uptake, for example, some
passes offer other benefits such as shopping discounts or act as a library card. This
may have resulted in a number of “no trip” pass holders that use the non-travel
related benefits (evidence provided later shows an increase in “no trip” passes). “No
trips” pass holders or zero trip pass holders are those who are taking up the pass but
not using it for its intended main purpose of free travel. Although it may be the case
that have the pass and do not use it immediately but feel it might one day be useful.
1.2.2. Note on Further Analysis
Analysis of the data has been grouped into four categories:
1. Years 2003-05 where an established half fare scheme already existed
2. Years 2006-07 where concessionary passengers were entitled to free
local bus travel
3. Years 2008-10 where concessionary passengers were entitled to free
national bus travel
4. Years 2011-12 (a continuation of concessionary passengers being entitled
to free national bus travel)
For each category the average percentage take up has been calculated. Whilst there
are drawbacks from taking this approach as some level of detail is lost and direct
comparison is not straightforward (as each period contains a different number of
years), it is possible to compare take up levels for different stages of the
concessionary travel pass (half fare to full fare etc.).
121.2.3. Take-Up of Concessionary Passes by Age
Figure 2 shows the percentage of people in a particular age group that have taken
up the option of holding a concessionary pass since 2003.
Take-up of Concessionary Pass by Age
100
90
80
70 60 - 64 years
Percentage
60 65 - 69 years
50 70 - 74 years
40 75 - 79 years
30 80 years +
20
10
0
2003-05 2006-07 2008-10 2011-12
Time Period
Figure 2: Take up of Concessionary Pass by age
Figure 2 shows, take up has increased for all age groups. The largest percentage
increase is for the ‘60-64’ age category, however this group has lower than average
take up. This is perhaps unsurprising as a large proportion of this age group will still
be in work and therefore a concessionary pass that does not allow free travel before
09:30 is of limited use to them. In addition, since 2010, the eligibility age for a bus
pass has been gradually increasing from 60 to 65 by 2016.
Those in the ‘75-79’ age category had the highest take-up rate until the 2008-10
period but have since been surpassed by the ‘70-74’ age category. Perhaps
unsurprisingly, the take-up rate is quite low for the over 80s, the group expected to
have most trouble accessing their local bus service.
1.2.4. Take Up of Concessionary Passes by Car Availability
Figure 3 shows the percentage of people with different car availabilities (defined as
the number of cars or vans owned by the household) that have taken up the option
of holding a concessionary pass since 2003.
13Take-up of Concessionary Pass by Car Availability
100
90
80
70
Percentage
60
50 No car / van
40 One car / van
30 Two or more cars / vans
20
10
0
2003-05 2006-07 2008-10 2011-12
Time Period
Figure 3: Take up of Concessionary Passes by Car Availability
Whilst take up of concessionary passes has increased for all levels of car availability,
it has increased most for those households that own a car compared to those that do
not. The increase in take up by car owners is likely to be to their desire to replace
some car journeys with bus journeys as the reduction in cost of bus travel makes it
more attractive relative to car travel. This fits in with the economic theory of
substitutes, if two modes of travel can be substituted for each other (as bus and car
are), the relative reduction in price for one will mean more people shift to using the
cheaper mode.
The fact that the take up is higher for those households that have no access to a
car/van is expected as these households have fewer transport substitutes.
Therefore, the value of being able to travel for free on buses is greater as it could
reduce their transport expenditure to zero as it is highly likely that they would have
been relying on buses as their main mode of transport.
1.2.5. Take-Up of Concessionary Passes by Household Income
Figure 4 shows the percentage of people with a particular household income that
have taken up the option of holding a concessionary pass since 2003
14Take-up of Concessionary Pass by Household Income
100
90
80
70
Percentage
60
50 Less than £10,000
40 £10,000 - £19,999
30
£20,000 or more
20
10
0
2003-05 2006-07 2008-10 2011-12
Time Period
.
Figure 4: Take up of Concessionary Pass by Household Income
As we can see in figure 4 take up increased from 2003-05 to 2011-12 with the
largest percentage increase for those in income group ‘£20,000 or more’. It is not
surprising that take up of concessionary passes increases as household income
decreases. Firstly, lower income households are less likely to own a car, which we
have already seen is a significant factor in determining pass take up. Secondly, in
the absence of the concession, a given level of expenditure on bus travel would
represent a higher percentage of household income for those travellers in lower
income brackets. For these people the value of travelling on the bus for free is
higher, by releasing a higher percentage of their household income, more can be
spent on other goods and services, therefore they are more likely to take up a
concessionary pass. As is also a theme throughout, there is a convergence in take
up amongst households of different incomes over time. Take up of concessionary
travel by annual gross individual income was also analysed and followed a similar
trend to household income.
1.2.6. Take-Up of Concessionary Passes by Area Type
Figure 5 shows the percentage of people from different area types that have taken
up the option of holding a concessionary pass since 2003.
15Take-up of Concessionary Passes by Area Type
100
90
London Boroughs
80
70
Percentage
Metropolitan built-up areas
60
50
40 Large urban (over 250k
30 population)
20 Medium urban (25k to 250k
10 population)
- Other urban or rural areas
2003-05 2006-07 2008-10 2011-12 (under 25k population)
Time Period
Figure 5: Take up of Passes by Area Type
Take up of passes has increased during 2003-2010 for all area types, although the
rate of increase is much lower for built up metropolitan areas and London Boroughs
than it is for other urban and rural areas. Again, this is not surprising as London
Boroughs have a combination of measures which make travel by car less attractive
and a concessionary package 8 that allows free travel on the Underground, buses,
trams, the London Overground and Dockland’s Light Railway. Similarly, Metropolitan
areas typically have well established bus networks and are more likely to have
offered free concessionary travel prior to 2006. We can however see that in the
2011/12 period there has been a convergence in take up by area.
It is also worth noting that there is lower take up of concessionary passes the more
rural the area type becomes. This is because rural areas will typically have fewer bus
services which run less frequently than would be found in metropolitan and larger
urban areas. Therefore, for people in more rural areas the value of holding a bus
pass, and therefore the take up of passes, would be expected to be lower than for
those in areas with greater access to bus services (although if the bus pass is used
when visiting other parts of the country or doubles as a library or discount card for
example, then there will be some value). And, given that we would expect more rural
areas to have worse access to buses than more urban areas, it seems logical that
people in these areas would be more likely to own a car as a means of getting
around, and we have seen that people who live in households with a car are less
likely to take up concessionary passes than those who do not.
1.2.7. Take-Up of Concessionary Passes by Access to Bus Stop
Figure 6 shows the percentage of people that have taken up the option of holding a
concessionary pass since 2003 sorted by the average time it takes them to walk to
their nearest bus stop.
8 London has had concessionary travel since the 1970’s an introduction of the ENTCS would have
less of an impact for Londoner’s travel modes and characteristics.
16Take-up of Concessionary Passes by Access to
Bus Stop
100
90
80
70
Percentage
60
50 6 minutes or less
40 7-13 minutes
30
14 minutes or more
20
10
0
2003-05 2006-07 2008-10 2011-12
Time Period
Figure 6: Take up of Concessionary Passes by Access to Bus Stop
For all groupings the increase in take up has been broadly similar over time, and as
we would expect take up is higher the closer a person is to their nearest bus stop.
1.2.8. Take-Up of Concessionary Passes by Bus Frequency
Figure 7 shows the percentage of people that have taken up the option of holding a
concessionary pass since 2003 grouped by the average frequency of bus service in
their local area.
Take-up of Concessionary Passes by Bus Frequency
100
90
80
70 Less than 1 every half
hour
Percentage
60
At least 1 every half
50 hour
40 At least 1 every
30 quarter hour
20
10
0
2003-05
2006-07 2008-10 2011-12
Time Period
Figure 7: Take up of Concessionary Passes by Bus Frequency
Again we see that there have been broadly similar increases for all three categories,
although the gap between the highest and lowest does narrow slightly over the
period. Again, the lower the frequency of buses there is, the lower the take up of
free passes we observe.
171.2.9. Take-up of Concessionary Passes by Discretion offered
Figure 8 shows take up of concessionary pass based on whether concessionary
travel has been extended to other modes (for example on trains, trams, ferries etc.).
The orange line (‘none’) shows the take up in places where just the statutory
concession is available. The green line (any additional mode) shows take up in
places where the concession is offered on other modes too.
Take up of Concessionary Pass by Other Concessions
Offered
90
80
70
60
Percentage
50
40 None
30 Any additional mode
20
10
0
2003-2005 2006-2007 2008-2010 2011-2012
Time Period
Figure 8: Take up of Concessionary Pass by Other Concessions Offered
Take up is consistently higher where the concession has been extended to other
modes of transport).
1.2.10. Take-Up of Concessionary Passes by Gender
Figure 9 shows the percentage of people that have taken up the option of holding a
concessionary pass since 2003 grouped by gender.
18Take-up of Concessionary Passes by Gender
100
90
80
70
Percentage
60
50
Male
40
Female
30
20
10
0
2003-05 2006-07 2008-10 2011-12
Time Period
Figure 9: Take up of Concessionary Passes by Gender
Both males and females have seen increased take up of passes across the time
period, with females consistently being more likely to take up the option of holding a
concessionary pass. The increase in the male take up rate is higher than females
between 2003-05 and 2011-12; 31 percentage points compared to 24 percentage
points respectively. The national travel survey 9 shows men are significantly more
likely to hold a full licence, which could be a reason why female take up of
concessionary passes is higher. In 2013 for example, the percentage of those aged
70 with a full driving licence was 82% for males and 47% for females. With section
1.2.4 highlighting the higher take up for those without a car one might conclude that
take up would be higher for females as they are less likely to be driving.
1.2.11. Conclusions
We can see from this section of the analysis that by every indicator we have looked
at, the take up of concessionary passes has increased since the move from the local
half-fare to the local free schemes and then the national concessionary travel
schemes. There are perhaps no surprises regarding the characteristics of people
who take up passes, those who are in lower income households without access to
cars in metropolitan areas with frequent bus services and local bus stops are more
likely to take up a pass than those people with high household incomes, two or more
cars who live in rural areas without frequent bus services or a bus stop close by.
1.3. Average Number of Boardings per Pass per Year
1.3.1. General Number of Boardings per Pass per Year
Figure 10 shows the average number of boardings per concessionary pass in
England, as well as the take-up rate and zero-trip rate for concessionary travellers.
9 NTS0201 available at https://www.gov.uk/government/collections/national-travel-survey-statistics
19Take-up Rates, Zero Trip Rates and Average
Boardings
100 120
80 96
Percentage
Boardings
60 72
40 48
20 24
0 0
2002 2003 2004 2005 2006 2007 2008 2009 2010 2011 2012
Year
Take-up Rate Zero Trip % Average Boardings
Figure 10: Take up rates, zero trip rates and average boardings
The number of boardings per pass holder per year is calculated by dividing the total
number of bus boardings using a concessionary pass by the total number of
individuals who said they held a pass in the NTS interview.
Figure 10 shows that the average number of boardings per pass for all pass holders
has steadily decreased over time, from 118 per pass holder per year in 2002 to 94
per pass holder per year in 2012. This is a fall from 2.3 trips per week to 1.8 trips per
week – a fall of roughly one trip every two weeks for each concessionary pass
holder.
The likely explanation for the decrease in trips per pass over time is that those
people who have most need for a pass, and therefore are most likely to make a lot of
trips with it, took up the pass as soon as possible (i.e. prior to free travel in 2006).
Those with most need might include those on low incomes or lacking a car so would
take up the first opportunity to have a pass. Over time, the people who take up the
pass are therefore those who are less likely to need to use it to travel, and therefore
they make fewer trips per year than existing pass holders, reducing the number of
trips per pass holder per year made.
Another reason for the decrease over time is that there has been a slight increase in
the zero trip rates which brings down the average. The proportion of pass holders
who did not make a bus trip during the 7 day travel week in the NTS rose from 53%
in 2002 to 63% in 2012. Reasons why a person may hold a pass but not take any
trips with it could be that the card doubles up as a wider benefit card, for example to
provide discounts on certain goods and services or as a library card. Passes may
also be held by people who feel it is their right to do so as they are eligible to hold
one despite never intending to use it. It is important however to note that as it
measures those that did not make a trip during the last 7 days and not those that
have never made a trip, it could just reflect those that use it less than once a week.
20Free local bus travel for concessionaries was introduced in 2006 and we see an
increase in take up rate from 53% in 2005 before free local bus travel to 66% in 2007
after it has been in place. Free national travel started in 2008 and we see take up
rates increase from 66% in 2007 to 77% in 2010. This is to be expected as the more
that is on offer, the more enticing it is and therefore we would expect more people
who did not have one before to obtain one.
1.3.2. Note on Further Analysis
As with section 1.2.2 data has been grouped into four categories; one corresponding
to 2003-05 where a well-established statutory half-fare scheme existed; a second for
2006-07 where concessionary passengers were entitled to free local bus travel and a
third and fourth for 2008-10 and 2011-12 respectively where concessionary
passengers were entitled to free national bus travel. For each category the average
boardings data has been calculated and presented. Whilst there are drawbacks from
taking this approach as some level of detail is lost and direct comparison is not
straightforward as each period contains a different number of years, the advantage
gained is that it is possible to compare boarding levels for different levels of benefit
from holding a concessionary travel pass more easily.
1.3.3. Average Number of Concessionary Boardings by Age
Figure 11 shows the average number of boardings per pass per year according to
different age categories tracked across the four different time periods.
Average Number of Bus Boardings Using a
Concessionary Pass by Age
140
120
Boardings per passholder
100
60 - 64 years
80
65 - 69 years
60 70 - 74 years
75 - 79 years
40
80 years +
20
-
2003-05 2006-07 2008-10 2011-12
Time Period
Figure 11: Average Number of Concessionary Boardings by Age
Over the time period, the average number of bus boardings per pass holder per year
has seen decreases for most age groups, most notably the over 80’s. The reason for
these declines may be as discussed above, that new pass holders are making fewer
21trips and there has been a rise in the number of zero trip passes being held, thus
reducing the overall number of trips per person per year.
Those people in the age groupings 65-69 increased the number of journeys per pass
holder per year in the period 2006-07. This may be because of the factors discussed
in 1.3.1 discussing the general increase in trips per passenger per year in these
years before the reduction in subsequent years.
1.3.4. Average Number of Concessionary Boardings by Car Availability
Figure 12 shows the average number of bus trips conducted by people with different
levels of household car availability.
Average Number of Concessionary Boardings
by Car Availability
250
Boardings per passholder
200
150 No car / van
100 One car / van
50 Two or more cars /
vans
-
2003-05 2006-07 2008-10 2011-12
Time Period
Figure 12: Average Number of Concessionary Boardings by Car Ownership
The striking feature of this graph is that there is a large difference between the
numbers of trips made per pass holder per year for those passes holders without
access to a car as for those with access to a car. In 2008-10 those households with
access to no cars or vans made three and a half times as many trips per year on
average compared to those with access to one car or van, and nearly seven times as
many trips as those households with access to two or more cars or vans. This
logically makes sense, as those pass holders without access to cars will rely on the
bus and other forms of public transport to a much greater extent than those who
have access to private transport and therefore make more bus trips on average per
year.
Also of note is the fact that the number of trips per pass holder per year increased
between 2003-2008/10 for those who have no access to a car. This suggests that
there was a significant impact for this group from the move to free regional and then
national travel. For households with only one car available, we see a slight increase
in trips per year following the introduction of free regional travel and then a reduction
following the introduction of free national travel and for those households with access
to two or more cars we see a reduction across the period. This suggests that for
22these groups, especially following the move from free regional to free national travel,
new pass holders made fewer trips than existing ones, and there was an increase in
“zero trip” passes, as discussed above. In 2011/12 there has been a decline in no
car/van boardings but it still remains significantly higher than households with access
to one or more cars.
1.3.5. Average Number of Concessionary Boardings by Household Income
Figure 13 shows the average number of trips per pass holder per year according to
different groupings of household income.
Average Number of Concessionary Boardings by
Household Income
180
160
Boardings per passholder
140
120
100
Less than £10,000
80
£10,000 - £19,999
60
£20,000 or more
40
20
-
2003-05 2006-07 2008-10 2011-12
Boardings per pass holder per year
Figure 13: Average Number of Concessionary Boardings by Household Income
For the majority of the income groups, the number of trips per pass holder per year
has either remained fairly constant or fallen, as we would expect given the
discussion in section 1.3.1.
There has been a slight decrease in the number of trips per pass holder per year for
those people with household incomes of £20,000 a year or higher, which is likely due
to an increase in zero trip passes and new pass holders making less trips per year
than ones who have held a pass for longer.
An interesting feature of this analysis is that in 2010-11, the number of trips per pass
holder per year actually fell for those people in the less than £10,000 income
grouping. It is not clear why this reduction has been observed when for those in
income bracket £10,000-£19,999, the number of trips stays roughly the same 2006-
07 compared to 2011-12. This could be linked to the reductions in shopping trips we
see in section 1.3.10. In many cases, particularly amongst the lowest income
bracket, real income has fallen. We know shopping trips have fallen so this could
also cause a fall in the average number of boardings amongst those that would be
most affected, the under £10,000 household income.
23The number of trips per household per year increases as household income falls;
those on lower incomes are less likely to be able to access other forms or transport
(such as private cars) and are therefore more likely to rely on bus services which
they can access for free.
1.3.6. Average Number of Concessionary Boardings by Area Type
Figure 14 shows the average number of concessionary boardings per pass holder
per year grouped according to area type.
Average Number of Concessionary Boardings
by Area Type
250
Boardings per passholder
London Boroughs
200
Metropolitan built-up
150 areas
Large urban (over 250k
100 population)
Medium urban (25k to
50 250k population)
Other urban or rural
- areas (under 25k
2003-05 2006-07 2008-10 2011-12 population)
Time Period
Figure 14: Average Number of Concessionary Boardings by Area Type
The number of trips per pass holder per year falls as the area type becomes less
populated. These areas typically have less frequent bus services with fewer
destinations served (it may be that in the most rural areas, no bus services run or
there is one return service a day to the local town centre). In these instances, it is
easy to see why there will be fewer trips per passenger per year; there simply isn’t
the option to make these trips. Added to this the fact that people in rural areas are
more likely to own a car, which we know from analysis in 1.3.4 is associated with a
fewer number of trips per pass holder per year, the reason we observe lower trips
per pass holder per year for more rural areas becomes clearer.
1.3.7. Average Number of Concessionary Boardings by Access to Bus Stop
Figure 15 shows the average number of concessionary trips per pass holder per
year with people grouped according to the average walking distance to their nearest
bus stop.
24Average Number of Concessionary Boardings
by Access to Bus Stop
Boardings per passholder 140
120
100
80
6 minutes or less
60
7-13 minutes
40 14 minutes or more
20
-
2003-05 2006-07 2008-10 2011-12
Time Period
Figure 15: Average Number of Concessionary Boardings by Access to Bus Stop
Unfortunately, a low sample size means that we should be cautious in drawing any
conclusions from the changes observed in those people who live 14 minutes or more
from their nearest bus stop.
For the other two groupings, we see rises in the number of trips per pass holder per
year following the introduction of free local concessionary travel (greater for those in
the grouping where the nearest bus stop is 7-13 minutes away) and then a slight
decrease for both following the move to free national concessionary travel in 2008.
This latter trend suggests that take up of passes since 2008 has been by people who
make fewer trips than those who held a pass previously, and fits with that discussed
previously.
1.3.8. Average Number of Concessionary Boardings by Bus Frequency
Figure 16 shows the average number of bus trips per pass holder per year according
to how frequent the nearest bus service is.
25Average Number of Concessionary Boardings
by Bus Frequency
180
160
Boardings per passholder
140
120
Less than 1 every half
100 hour
80 At least 1 every half hour
60
40 At least 1 every quarter
hour
20
-
2003-05 2006-07 2008-10 2011-12
Time Period
Figure 16: Average Number of Concessionary Boardings by Bus Frequency
As figure 16 shows, the more frequent a bus service is, the greater the number of
trips per pass holder per year we observe on average. Over the time period the
number of trips per pass holder per year is relatively stable for those whose local
service runs at least every quarter of an hour, but we have observed a decrease in
the number of trips per pass holder per year for those whose local bus service runs
at least every half hour or only once an hour or less. This suggests that the large
increase in passes that has been observed for this group is comprised mainly of
people who make fewer trips per year.
The fact that the number of trips per pass holder per year increases with service
frequency is not surprising, as with greater frequency comes a greater opportunity to
use the bus and therefore a greater likelihood that people will make more trips.
1.3.9. Average Number of Concessionary Boardings by Trip Distance
Figure 17 shows the average number of concessionary trips per pass holder per
year grouped according to the trip distance made.
26Average Number of Concessionary Boardings by
Trip Distance
30
25
Boardings Per Passholder
20
Under 1 mile
1 to under 2 miles
15
2 to under 3 miles
3 to under 5 miles
10
5 to under 10 miles
10 miles and over
5
-
2003-05 2006-07 2008-10 2011-12
Time Period
Figure 17: Average Number of Concessionary Boardings by Trip Distance
Figure 17 shows that the majority of trips are between 3 and 5 miles in length but
there is low use for trips under a mile. An increasing number of trips are being made
over 10 miles, this may be because the pass now entails not only local but regional
travel.
The fact that there are very few trips 1 mile and under possibly reflects the fact that
these trips are the easiest to walk, however there is a low sample size associated
with this category so we cannot draw any firm conclusions.
Given that we have no data on take up of passes and distance travelled, it is not
possible to identify the impact of the introduction of the scheme from this data.
1.3.10. Average Number of Concessionary Boardings by Trip Purpose
Figure 18 shows the number of trips per pass holder per year according to different
trip purposes.
27Average Number of Concessionary Boardings
by Trip Purpose
70
Commuting / Business /
60 Education (including
Boardings per Passholder
escort)
50 Shopping
40
Other personal business
30 and escort
20
Visiting friends
10
- Other leisure
2003-05 2006-07 2008-10 2011-12
Time Period
Figure 18: Average Number of Concessionary Boardings by Trip Purpose
By far the most common reason for taking a trip by bus is to go shopping with over
half of all trips for this purpose. The least common trip purpose is commuting, and
this is unsurprising as many pass holders will no longer be in employment and those
that are will be unable to use their pass to get to work if they start before 9.30am
(assuming their local scheme does not have a discretionary concession).
1.3.11. Average Number of Concessionary Journeys by Gender
Figure 19 shows the average number of trips per pass holder per year according to
gender.
Average Number of Concessionary Boardings by
Gender
140
Boardings per passholder
120
100
80
60 Male
40 Female
20
-
2003-05 2006-07 2008-10 2011-12
Time Period
Figure 19: Average Number of Concessionary Boardings by Gender
28Females make more trips on average than males, although since 2006-07 there has
been a slight decrease in the number of trips per pass holder per year for both
genders. Given the increase in take up for both genders, this is suggestive of the
fact that newer pass holders make fewer trips, a common conclusion drawn from the
data. As discussed during section 1.2.10 for take up, men may have more access to
a car and therefore more likely to have a substitute to using the bus so you might
expect this to be a reason for higher average boardings for woman.
1.4. Relying on the Pass
It was clear from figure 18 and general analysis that the pass is used for many
different reasons. These reasons can largely be grouped together:
1) essential services (e.g. Doctors’ appointments)
2) access to friends and family
3) access to leisure activities (e.g. sports and days out)
The benefits associated with the wider availability, ease and removal of cost to do
these activities are available to all regardless of personal and household situation. It
is believed, however, that those with incomes below £15,000 and with lower car
availability may see increased benefits as they would be at the highest risk of losing
access in the absence of a bus. This is further discussed in Chapter 2. We have also
seen from the graphs above that this group have higher take and make more
journeys (average boardings). Using analysis from the NTS we can derive that an
estimated 830,000 people in households with no car access and incomes below
£15,000 use the concessionary pass at least once a week.
291.5. Conclusions
There has been a general downward trend in the average number of bus boardings
per pass holder per year over the time period we are considering. There is some
evidence to suggest that for some individuals bus boardings have increased since
2006, which may reflect the impact of the concessionary scheme, although this is
hard to draw out. It appears to be the case that there are factors driving the average
number of trips per pass holder down over time which remain unexplained. Data
shows an increase in “zero trip” pass holders over time, which suggests that new
pass holders are less likely to make bus trips as the value of holding a pass for them
is lower - if someone is reliant on the bus they are more likely to have held a bus
pass for a longer period of time.
Of great interest from this data is the fact that we observe significantly higher
numbers of trips per pass holder for people who do not have access to a car, have
low household income and live in densely populated areas, characterised by
frequent bus services that can be accessed by a nearby bus stop. Those people
who exhibit the opposite characteristics tend to make fewer bus trips per year.
30Chapter 2
How effective has the concession been in helping
to improve the quality of life of older people?
2.1. Introduction
Whilst the analysis in Chapter 1 provides a useful background to the concessionary
travel scheme and helps identify characteristics that might drive uptake of a pass
and increase the numbers of trips per year, we cannot draw any conclusions from
this data regarding the effectiveness of the concession in meeting its policy
objectives. In order to do this, it is essential to consider academic evidence on
whether the policy has actually increased bus use amongst the eligible population,
and to what extent the policy aims have been achieved, with an emphasis on the
social objectives.
In order to measure how adequately the English National Concessionary Travel
Scheme (ENCTS) has met its social (non-monetised) objectives, we have to recall its
main objective - to increase the ‘quality of life’ for concessionary travellers. The
literature on the relationship between the ENCTS and social objectives presents
various definitions for the term ‘quality of life’ and consequently utilises varying
proxies for the term. The recurring references regarding the interpretation of ‘quality
of life’ relate to ‘well-being’, ‘physical and mental health’, ‘standard of living’,
‘recreation and ‘leisure time’ and ‘social-belonging’. The measurement of these
variables has involved both quantitative and qualitative assessments.
This review will collate the evidence from existing literature and present any
conclusions that could be drawn. The purpose is to evaluate the various potential
benefits of the scheme identified and the extent to which they can be monetised. The
literature reviewed covers a breadth of studies at both the regional and the national
level.
2.2. Background
Chapter 1 presented some insight on who is using the concession, when and how
often. The analysis demonstrated that the percentage of eligible older people in
England who have taken up the option of holding a Concessionary pass has
increased from 51% in 2002 to 76% in 2012. Although Chapter 1 does not evidence
a strong positive correlation between patronage and the introduction of the ENCTS,
this occurrence is well evidenced throughout the academic literature.
The existing literature demonstrates the success of the ENCTS in improving bus
patronage amongst older people across a wide range of socio-economic
backgrounds; the change to zero-fare from half-fare in particular resulted in
substantial increases in patronage. However the literature fails to provide an
adequate evaluation of the wide-ranging effects of the ENCTS, to whom the benefits
from the policy accrue, and whom they exclude. Specific evidence on how and why
31bus users respond to the zero-fare intervention and how this in turn impacts their
quality of life is generally sparse.
The official policy aim was to ensure that bus travel, in particular, remains within the
means of those on limited incomes and those who have mobility difficulties. The
2005 budget announced that not only will the scheme reduce the cost of travel for
approximately 11 million people aged over 60 and approximately 2 million disabled
people, it should also help approximately 54% of pensioner households who do not
have a car to travel freely in their local area (Butcher, 2009).
Webb et al., (2011) utilised logistic regression analyses based on three waves of
data (2004, 2006 and 2008) from the English Longitudinal Study of Ageing (ELSA).
Their outcome measures were: changes in self-reported public transport use, body
mass index, waist circumference and obesity. They found that eligibility for bus travel
was significantly associated with increased patronage. Those that were eligible for
free bus travel were 1.51 times more likely to increase bus journeys than those that
were not.
The resultant increase in bus patronage does not necessarily entail an increase in
the quality of life of the users however. Andrews et al, (2012) developed a Binomial
Logit Model based on responses from 500 concessionary pass holders. They found
no significant relationship between an increase in trip frequency and the reporting of
an improvement in quality of life. Although the methodology employed may not be
robust, this finding supports Metz’s (2003) claim that the assessment of
concessionaires’ mobility should not only be concerned with patronage - rather the
meaning of the trips may be more telling.
2.3. Who benefits?
When measuring how effective the scheme has been in improving the quality of life
of older people, consideration has to be given to the fact that although the pass is
universally available, the benefits derived from the scheme are not universal. A
proportion of those eligible to hold a pass are excluded for a variety of reasons which
include personal mobility constraints and frequency/existence of bus services. In
addition, amongst those that hold a pass there is considerable variability in the level
of usage of the pass as well as variability in trip purpose. Consequently, the benefits
derived from the pass are highly variable and contingent on numerous factors.
2.3.1. Factors that constrain the benefits derived from the scheme
The predominant determinants of ownership and frequency of use of the pass are:
• access to a private car
• personal mobility
• bus frequency
• income
• gender
• walking time to the bus stop.
The existing literature states that these are they key factors that determine to whom
the benefits will accrue.
32You can also read