AGRA ROADMAP FOR A ZERO WASTE CITY - Centre for Science ...
←
→
Page content transcription
If your browser does not render page correctly, please read the page content below
AGRA ROADMAP FOR A ZERO WASTE CITY
Authors: Siddharth Ghanshyam Singh and Atin Biswas

Research support: Subhasish Parida and Ishani Sonak

Editor: Arif Ayaz Parrey

Design and cover: Ajit Bajaj and Sanjit Kumar

Production: Rakesh Shrivastava and Gundhar Das

We are grateful to the Norwegian Ministry of Foreign Affairs for its support.

© 2021 Centre for Science and Environment

Material from this publication can be used, but with acknowledgement.

Maps used in this document are not to scale.

Citation: Siddharth Ghanshyam Singh and Atin Biswas 2020, Agra: Roadmap for a Zero Waste City, Centre
for Science and Environment , New Delhi

Published by
Centre for Science and Environment
41, Tughlakabad Institutional Area
New Delhi 110 062
Phones: 91-11-40616000
Fax: 91-11-29955879
E-mail: sales@cseinida.org
Website: www.cseindia.org
AGRA
Roadmap for a Zero
    Waste City
Contents
1. About Agra 7
2. Solid waste management scenario 10
3. Challenges 23
4. Roadmap for a Zero Waste Agra 26
5. Bibliography 50
56
About Agra
Agra, located on the western bank of river Yamuna, 206 km south of the
national capital New Delhi, is a culturally rich and historically important
city. It is home to as many as 48 protected monuments (as per Archaeological
Survey of India’s classification). The very thought of Agra reminds us of the
Taj Mahal, one of the seven wonders of the world and a universal symbol of
love. Agra is a popular national and international travel destination, receiving
more than a million tourists every year.
The city is the headquarter of the Agra district of the state of Uttar Pradesh.
Agra Municipal Corporation (AMC) has jurisdiction over the entire city minus
the area under the Cantonment Board. Besides being a prominent tourist
destination of India, being centrally located on the national map, Agra forms
an important regional urban centre. Agra is a Class I town. The city stretches
over about 9 km along the Yamuna River. A major part of the city is on the
western side of Yamuna and is called cis-Yamuna, while the newer part to the
east of the river is termed trans-Yamuna.
In addition to the 1.58 million people that reside within the municipal limits (as
per Census 2011), an additional floating population of 0.3 million (as per Agra
Jal Sansthan), that includes tourists, also uses the municipal infrastructure
and services of the city. According to the Agra Smart City project, the city hosts
17 per cent of the total international tourists visiting India every year (which
is estimated to be close to 1.15 million). Taj Mahal alone receives seven–eight
million domestic and foreign tourists every year, which is the highest in the
country. The city government faces a monumental challenge in providing the
citizens and the floating population with basic civic amenities like sanitation
and waste management services.
Table 1: Agra—vital statistics
Total area of the city 141 sq km
Population (2020 estimate) 2,087,006
No. of households 0.44 million
No. of bulk waste generators 2,352
No. of commercial entities 29,081
No. of wards 100
No. of zones 4
Waste generation (2017) 712 TPD
Total processing capacity (2020) 455 TPD
Source: CSE, 2020
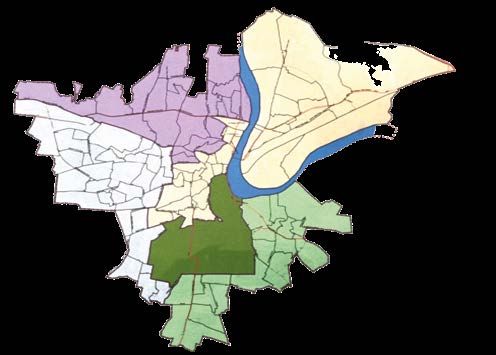
The city has 100 wards (parshad kaksh) and is divided into four zones for
operation and management of sanitation and waste management services (see
Map 1: Agra Municipal Corporation map).
7AGRA: ROADMAP FOR A ZERO WASTE CITY
Map 1: Agra Municipal Corporation map
00 Number of wards Population Total households
Chatta
28
Hariparvat
489,513
21
147,808
374,300
80,870
Tajganj
23
416,617
95,976
Lohamandi
CANTONMENT
25
451,373
106,538
Not mapped Grand total
03 100
48,170 1,779,973
8,206 439,398
Source: Agra Smart City Ltd; AMC Report, 2019
The economy of Agra has three key pillars: tourism, the shoe industry and iron
foundries. According to National Sample Survey Organization data (2000),
431 of every 1,000 male in Agra are self-employed, which grew to 603 per 1,000
in 2005, which further underlines livelihood opportunities in the tourism and
small-scale industries. There are about 12 major and medium-scale industrial
units, producing electrical goods, pipes, leather goods etc. and as many as
7,200 small-scale industrial units in the city. More than 1.5 lakh pairs of shoes
are manufactured in Agra every day by various footwear producing companies,
a significant part of them working in the informal sector.
8AGRA: ROADMAP FOR A ZERO WASTE CITY
Table 2: Summary of public institutions and commercial
establishments
Number of commercial areas 159
Number of shops 45,899
Number of healthcare facilities 257
Number of hotels 310
Number of schools 313
Number of parks 101
Number of offices 258
Number of religious places 204
Number of fruit and vegetable markets 132
Number of fish and meat markets 104
Source: CSE 2020, based on data collected by AMC
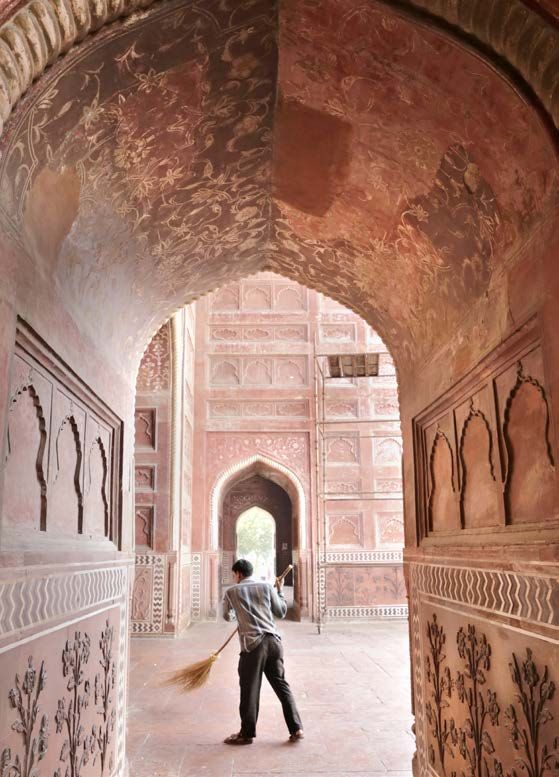
Agra Development Authority (ADA) was established in 1974 under the Uttar
Pradesh Planning and Development Act, 1973. An area of 52,020 hectares (ha)
comes under its purview, a small part of which spills outside the city limit to
cover 144 revenue villages. ADA is mandated to prepare a master plan for less
developed areas in terms of connectivity, sewer networks, road beautification
and making markets business-friendly. The master plan has produced a map
which can be a strong reference point to identify relatively more developed
habitations vs less developed ones (see Map 2: Agra Master Plan).
Map 2: Agra Master Plan
Underdeveloped
Developed
Source: Agra Mahayojana, 2021, Agra Development Authority
9AGRA: ROADMAP FOR A ZERO WASTE CITY
Solid waste management scenario
Production and consumption patterns, population, population density and
economic conditions are some of the factors that influence the rate at which
solid waste is generated in a city, town or village.
City waste profile
Quantification of solid waste
Quantification and characterization of municipal solid waste are key indicators
to plan and strategize waste management operations. AMC conducts studies
from time to time to ascertain the quantity of waste produced in the city.
Regional Centre for Urban and Environmental Studies (RCUES) prepared
a detailed project report (DPR) for Agra in 2017, when waste generation was
close to 712 TPD (excluding street sweeping waste and drain silt), at the rate
of 0.4 kilogram per capita per day. AMC has also started preparing a DPR in
2020 through the Waste Management Corporation (WMC), which will help
gain a fresh perspective from the strategic point of view. Table 3: How Agra
compares with other cities draws a comparison with a couple of other cities of
almost the same size and population.
Table 3: How Agra compares with other cities
City Population Number of wards Total waste generated (TPD)
Bhopal 2.3 million 85 877.57
Indore 2.7 million 85 1165
Jaipur 3 million 91 1050
Source: CSE, 2020
Waste distribution in wards and zones
Table 4: Waste generation in Agra provides an overview of the city’s municipal
waste situation. Ward numbers 20, 25 and 77 could not be mapped to any
zone, a total of 19.3 tonnes per day (TPD) of solid waste is generated from
these three wards.
Table 4: Waste generation in Agra
Zone number Zone name No. of wards Total waste generated
(TPD)
1 Hariparvat 21 149.7
2 Tajganj 23 166.5
3 Lohamandi 25 180.5
4 Chatta 28 195.7
All four zones 97 692.4
- Could not be mapped 3 19.3
Total 100 711.7
Source: CSE, 2020 with data inputs from AMC
10AGRA: ROADMAP FOR A ZERO WASTE CITY
Zone-wise waste generation is proportional to the number of wards in each
zone (see Graph 1: Zone-wise waste generation).
Graph 1: Zone-wise waste generation
250
No of wards and waste generation (TPD)
195.7
200 180.5
166.5
149.7
150
100
50 28
21 23 25
0
Hariparvat Tajganj Lohamandi Chatta
Zone name
No of wards Total waste generated (TPD)
Source CSE, 2020 with data inputs from AMC
On an average, each zone has approximately 24 wards, and average solid
waste generation in each zone is 173 TPD. Hariparvat has the lowest number
of wards, producing the least quantity of solid waste, and Chatta has the
highest number of wards and generates the highest quantity of solid waste.
The average waste generation per ward stands at 7.117 TPD.
Ward-wise waste generation
Within Hariparvat (Zone 1), the least quantity of waste is generated by Ward
29 (6.1 TPD) and the highest quantity of waste is generated by Ward 31 (8.2
TPD). Average solid waste generation in Hariparvat is 7.12 TPD.
Tajganj (Zone 2) is one of the prime localities in Agra; it is spread around the
Taj Mahal and is home to people who work as support staff at the historic
monument. There are a total of 23 wards in this zone. The least quantity of
waste is generated by Ward 97 (6.4 TPD) and the highest quantity of waste is
generated by Wards 15 and 48 (8.1 TPD). Average solid waste generation in
Tajganj is 7.24 TPD.
Lohamandi (Zone 3) is situated in the western part of the city. There are 25
wards in this zone. The least quantity of waste is generated by Wards 49 and
80 (6.1 TPD) and the highest quantity by Wards 75 and 84 (8.1 TPD). Average
solid waste generation in Lohamandi is 7.22 TPD.
Chatta (Zone 4) is situated in the northeastern part of the city, with a majority
of it falling east of the Yamuna. There are 28 wards in this zone. The least
11AGRA: ROADMAP FOR A ZERO WASTE CITY
quantity of waste is generated by Wards 23, 42 and 100 (6.2 TPD) and the
highest quantity by Ward 50 (8.2 TPD). Average solid waste generation in
Chatta is 6.99 TPD.
Graph 2: Ward-wise waste generation in Hariparvat
9
8.2 8.1 8.1
8 7.9 8 7.9
8 7.5
7.3 7.2
6.9 6.9
6.6 6.7 6.6 6.7
7 6.4
6.1 6.2 6.2 6.2
6
Waste generation (TPD)
5
4
3
2
1
0
11 13 26 29 31 38 43 47 51 52 56 61 71 81 85 87 90 92 93 94 96
Ward number
Source: CSE, 2020
Graph 3: Ward-wise waste generation in Tajganj
9
8 8.1 8.1
7.9 7.9 7.9 7.9 7.8 7.7
8 7.4
7.3
7.1 7.1
6.8 6.8 6.8
7 6.6 6.5 6.5 6.6 6.7 6.6
6.4
6
Waste generation (TPD)
5
4
3
2
1
0
2 4 5 15 19 21 22 27 33 35 36 44 48 57 60 62 63 70 72 78 88 97 98
Source: CSE, 2020 Ward number
12AGRA: ROADMAP FOR A ZERO WASTE CITY
Graph 4: Ward-wise waste generation in Lohamandi
9
8 8 8 8.1 8.1
7.9 7.8 7.9 7.9
8 7.6 7.5
7.4 7.3 7.4
7.1 7.1
6.8
7 6.6 6.6 6.5
6.1 6.2 6.1 6.2 6.3
6
Waste generation (TPD)
5
4
3
2
1
0
3 6 7 9 10 12 18 24 30 34 37 41 45 46 49 67 69 73 74 75 80 82 84 86 89
Ward number
Source: CSE, 2020
Graph 5: Ward-wise waste generation in Chatta
9
8.2 8.1 8.1
7.9 8
8 7.6 7.6 7.7
7.5
7.3 7.3
7.1
6.9 6.8
7 6.7 6.7 6.7 6.6
6.2 6.3 6.2 6.3 6.3 6.3 6.3 6.4 6.4
6.2
6
Waste generation (TPD)
5
4
3
2
1
0
1 8 14 16 17 23 28 32 39 40 42 50 53 54 55 58 59 64 65 66 68 76 79 83 91 95 99 100
Ward number
Source: CSE, 2020
13AGRA: ROADMAP FOR A ZERO WASTE CITY
Bulk waste generators
As per the Solid Waste Management Rules of 2016, bulk waste generators
(BWGs) includes buildings occupied by Central government departments or
undertakings, state government departments or undertakings, local bodies,
public sector undertakings or private companies, hospitals, nursing homes,
schools, colleges, universities, other educational institutions, hostels, hotels,
commercial establishments, markets, places of worship, stadia or sports
complexes with an average waste generation rate exceeding 100 kg per
day. According to secondary data collected from officials of AMC, there are
approximately 2,352 BWGs in Agra.
Nationwide Waste Management Systems (NWMS), a single-window service
provider for all waste management needs, has been appointed by the AMC
to collect and process waste (both wet and dry) from all BWGs in the city. As
per the city sanitation report, submitted by the state Department of Urban
Development to the National Green Tribunal (NGT) on 23 October 2019:
‘Door-to-door collection of dry waste is being done in special bags by AMC-appointed
collection agencies. The waste is being collected ward-wise by these agencies and brought to
the six specific collection points on a daily basis where it is weighed by NWMS. This waste is
transferred to the material recovery facility (MRF) through vehicles modified to handle only
dry waste. At the MRF, waste is segregated manually and mechanically (through a conveyor
belt system) by 60–70 workers. Segregated waste is further sifted into 15–17 categories. This
waste is then bailed and sent to recycling facilities located at Gajrola and Kashipur. Non-
recyclables are sent to waste-to-energy plants at Ghazipur. Since it is mandatory for BWGs
in the city to process their waste as per applicable norms, AMC provides them pay-and-use
facilities (with a processing fee of Rs 6 per kg and collection fee of Rs 1 per kg per km).
NWMS has set up four dry waste processing facilities with a total capacity of 210 TPD for
processing dry waste generated by the BWGs. In addition, a 120 TPD MRF has been set up at
the TediBagiya site (NH-93). These processing facilities have been set up in November 2018
and are in operation. The expenditure for the 120 TPD MRF and six dry waste collection
points at various location in the city is borne by NWMS and is approximately Rs 3.97 crore
and no expense falls on AMC’s shoulders.’ (Suitably edited.)
The sanitation report, 2019 also elucidates the manner in which AMC is trying
to address the issue of wet waste generated by BWGs in the city:
‘For the processing of wet waste from BWGs in the first phase, a plant with a capacity of 4
TPD capacity will be installed. The scientific disposal plant will be fully automatic, based
on technology of waste-to-compost developed in Netherlands, operated by NWMS, and
will treat wet waste from hotels, marriage halls, residential welfare associations (RWAs),
group housing societies (at a processing fee of Rs 12,500 per tonne and a collection fee of Rs
1,000 per tonne per km) on a pay-and-use basis. The service will provide for development,
supply, installation, and maintenance by establishing a common processing facility. AMC
will facilitate the operator by providing 750 sq m of land, at the rate of Rs 1 per sq m per year
of lease rent. The operator has paid for civil infrastructure, including boundary walls, floors,
sheds and machinery, which is estimated to be Rs 4.75 crore. NWMS is also supposed to
inspire and spread awareness by information, education and communication (IEC) activities
to BWGs regarding the resources which are generated by segregating wet and dry waste. For
doing so, NWMS will also integrate door-to-door collection with campaign meetings, and
engage rag-pickers and BWGs through various schemes.’ (Suitably edited.)
14AGRA: ROADMAP FOR A ZERO WASTE CITY
Solid waste composition and characterization
A waste composition study was carried out by RCUES in 2005 as part its
solid waste management DPR for Agra. Unfortunately, this is the latest data
available in the public domain which analyses, on the basis of an extensive
survey, the characterization of solid waste generated in Agra (see Graph 6:
Composition of waste generated by Agra).
The graph includes data regarding construction and demolition (C&D) waste
but not domestic hazardous waste as the composition study was done on the
basis of the Solid Waste (Management and Handling) Rules, 2000, which
include C&D waste but not domestic hazardous waste in the definition of
municipal solid waste.
Solid waste is very heterogeneous in nature and its composition varies with
place and time, even samples obtained from the same sampling point on the
same day but at different times may show totally different characteristics and
composition (see Graph 7: Change in waste composition as per establishment).
Usually the ‘quartering’ method is preferred for estimating the composition of
waste. RCUES’s DPR has detailed the waste composition of Agra. The report
has taken into consideration waste generation from residential, commercial
and other establishments and also taken into consideration waste generated
by the floating population in Agra (see Graph 8: Waste composition in Agra).
If we collapse the categories of waste into broader streams, we can get a sense
of the amount of wet, dry and inert material that the city generated in 2017.
The mapping study found that 58 per cent of the waste generated in the city
is wet waste, which can be taken care of by simple composting methods, close
to 29 per cent of the material had the capacity to be recycled or to be sent for
energy recovery and only 13 per cent waste was classified as inert or hazardous
(see Graph 9: Waste composition in Agra in 2017).
Graph 6: Composition of waste generated by Agra
Waste composition (2005)
5%
16%
Organic
Recyclable
44%
Drain silt
5%
street sweeping
9% C&D
Mixed waste
21%
Source: CSE, 2020, compiled from RCUES DPR for Agra, 2005
15AGRA: ROADMAP FOR A ZERO WASTE CITY
Graph 7: Change in waste composition as per establishment
60
48.3
50
42.8
40.3
40 36.9
32.4
Percentage
30
30 24.8
21.7 22.8
20
10
0
Household Commercial Dumping Site
Type of establishment
Biodegradable Recyclable Inert
Source: CSE 2020, compiled from RCUES DPR for Agra, 2005
Graph 8: Waste composition in Agra
8.5 2.3
6.5 2.3 Wooden pieces Brick
2 1.6
Paper Glass
16 2.7 Textile Rubber/leather
3.5
Thermocole Kitchen waste
2
Coconut shell Ceramics
5.3 Dry leaves PVC
11.3
3.7 Green matter Plastics
Concrete/stone Polyethylene
1 2.8 1.9
0.9 Inert Vegetables
23.7 1.1 Metals Straw
0.8
Source: RCUES, DPR for solid waste management scheme in Agra, 2017
Average per capita waste generation varied from 0.37 grams to 0.45 grams
as per the study conducted by RCUES in 2017. The study also found that
total waste generation in Agra was close to 712 TPD, of which residential
establishments contribute almost 70 per cent (approximately 487 TPD), and
commercial and institutional establishments contribute only 30 per cent
(approximately 213 TPD). It should be noted that street sweeping waste and
drain silt was not considered in this analysis, together the two contribute
another 84 TPD of waste reaching the dumpsite. So the figure of the total
burden of waste settles at 796 TPD.
16AGRA: ROADMAP FOR A ZERO WASTE CITY
Graph 9: Waste composition in Agra in 2017
Waste Composition (2017)
13
Wet
Dry
28.6 58.3 Inerts/ Hazardous
Source: CSE, 2020
Waste management operations
Till 2019, primary collection of municipal solid waste was carried out by
door-to-door collection agencies, whereas secondary collection was AMC’s
responsibility. Both collections were done using handcarts, tricycles and
small motorized vehicles. Each vehicle had a trained team accompanying it
and a specific area of operation. Private parties were monitored by an officer
of AMC, usually a Supervisor, Sanitary Inspector and Zonal Sanitary Officer.
AMC claims that the collection used to take place in three streams—in green
bins for organic and biodegradable waste, in blue bins for dry and recyclables
and in red bins for domestic hazardous waste. Street sweeping staff of AMC
was responsible for collection of inerts from commercial areas and streets of
the city.
The contracts of all the agencies were terminated in 2020. Currently, AMC is
responsible for door-to-door collection, transportation and disposal of all the
solid waste generated in the city.
Table 5: Current AMC workforce for managing solid waste
Designation Number
Sanitary Supervisors 137
Safai Karmacharis 3,890
Municipal Chief Health Officer 1
Municipal Health Officer 1
Zonal Sanitary Officers 4
Chief Sanitary and Food Inspectors 4
Sanitary and Food Inspectors 16
Source: Agra Municipal Corporation
17AGRA: ROADMAP FOR A ZERO WASTE CITY
Table 6: Current AMC fleet engaged in solid waste management
Details Number
Tippers 49
Dumper placers 44
Hook loaders 9
Loaders 43
Earth movers and chain machines 27
Refuse collector compactors 28
Total 200
Source: Agra Municipal Corporation
Other major stakeholders involved in transportation of waste:
1. NWMS is responsible for collection and transportation of wet and dry waste
generated by bulk generators up to its decentralized composting plant (4
TPD) in Dhandoopura and 120 TPD MRF at Rambagh-Tedhibagiya.
2. JRR Waste Management Services Pvt Ltd (JRR) collects and transports
biomedical waste from all hospitals and healthcare facilities (HCFs) to its
incineration facility that has a processing capacity of 20 TPD.
3. C&D waste is collected and transported by the Rise Eleven Group through
Friends Stone Crushing Company, Faridabad.
Collection of waste
Each of the city’s four zones was handled by one door-to-door collection
(DTDC) agency in the past. When the DTDC mechanism was operational, the
city average of coverage was estimated to be 91.66 per cent. It is to be clarified
here that the coverage doesn’t represent practice of source segregation and
collection of user charges. The city’s performance on these two parameters is
not good. User charges had been notified on 22 April 2018 through newspaper
advertisements. In the same order, a total of Rs 1,24,98,090 was received in
the Board Fund through the user fee collection. However, with limited fleet
and manpower, the corporation’s collection and transportation percentages
are constrained.
Primary collection
This was earlier under the scope of DTDC agencies. DTDC agencies operated
203 small vehicles of 2 m3 capacity each, with an average of two vehicles per
ward. The agencies used to collect waste from each establishment in their
respective area limits as defined in their contracts and dump the waste at
designated transfer points, community bins or dhalaoghars. Inert waste such
as from road sweeping and drain silt was collected by AMC’s sanitation staff
on a daily basis and transferred to dedicated bins as well. Since the contracts of
DTDC agencies have been revoked, AMC is handling the primary collection on
its own. Contemporary data on the coverage by AMC is not available.
Informal waste collection mechanisms are also prevalent in Agra, wherein
localities have verbal agreements with informal waste collectors who provide
services through pushcarts or tricycles and collect user charges on a monthly
basis (that vary between Rs 25–50 per family per month). Centre for Science
18AGRA: ROADMAP FOR A ZERO WASTE CITY
and Environment’s (CSE) field visit revealed that this arrangement is rather
common even in the most affluent residential establishments.
Transportation of waste
As already mentioned, transportation of waste is currently carried out by AMC
and is divided into:
• Primary transportation: From dhalaoghars and bins to secondary storage
points or transfer stations
• Secondary transportation: From secondary storage points and transfer
stations to the Kuberpur dumpsite
Primary transportation: This includes transfer of waste dumped by waste
collection agencies (at present, AMC) and informal waste workers at the
dhalaoghars or bins to secondary transfer stations. Tractors available with
the AMC are used to transfer only inert waste such as drain silt and street
sweeping waste. During CSE team’s visit, it was observed that tractors are
properly covered during the transfer of waste.
Secondary transportation of wet waste and inert waste: Vehicles with
capacity higher than 2 m3 are used for secondary transportation. They are
responsible for transfer of wet and inert waste from the respective transfer
points to the Kuberpur dumpsite.
Secondary transportation of dry waste: NWMS is responsible for collection
and transportation of dry waste once it has been brought to the transfer points.
The transfer points are:
a. ISBT
b. Four Point Hotel
c. Kalindi Plaza
d. Indian Oil Building, near Rui Ki Mandi Fatak
Only one transfer point (ISBT) could be located and was not functional during
consecutive visits by CSE. On further interaction with NWMS officials, it was
brought to our notice that at present NWMS is only collecting dry waste from
roughly 100 BWGs and not from these transfer points as the waste (at the
transfer points) is generally mixed in nature and not valuable.
Processing of wet waste
Processing of wet waste is done in four decentralized and three centralized
waste-to-compost treatment facilities. Three of the decentralized facilities are
owned by AMC and one by a private agency; together, they have a processing
capacity of 9 TPD. The decentralized composting facilities treats flower waste
and waste received from vegetable markets.
The three centralized composting plants located at the Kuberpur dumpsite
are owned by private agencies with a total processing capacity of 325 TPD.
Almost all waste that reaches the dumpsite is mixed in nature and goes
through pre-sorting, windrow management and processing sections before
reaching the finishing section. Refused-derived fuel (RDF) and segregated
19AGRA: ROADMAP FOR A ZERO WASTE CITY
Map 3: Agra waste management
Dayal Bagh
Sikandra
Kuberpur
Sahadra
AGRA
Taj Mahal
Airport
Kahrai
Azizpur
LEGEND
Decentralized facilities
1. 2 TPD near ISBT Rohta
2. 2 TPD + 1 TPD in Raj Nagar
3. 4 TPD for BWG in Dhandoopura
Transfer station
Centralized facilties 1. Tajganj transfer station
1. 300 TPD waste-to-compost 2. Lohamandi and Hariparvat transfer station
2. 20 TPD waste-to-compost
MRF
3. 5 TPD organic waste composter
4. Proposed waste-to-energy plant 1. 120 TPD Rambaug-Tedibagiya
5. Kuberpur dumpsite JRR biomedical waste management services
Source: CSE, based on data from Agra Smart City Ltd
combustible fractions (SCF) are recovered from the mixed waste using 125
mm and 80 mm sieves in the pre-sorting section. The organic fraction with
plastic contamination goes through a windrow section for stabilization using
inoculums. In the processing section, the stabilized part is again passed
through a 35 mm and 16 mm sieves, after which it is left for curing. The cured
fraction is passed through a 4 mm sieve and a de-stoner to achieve the final
product. Every batch of compost goes through a quality check, but the mixed
nature of the waste received is very likely to affect the quality of the compost,
as chances are high of heavy metal and pathogen contamination.
Processing of dry waste
Dry waste processing capacity of Agra currently stands at 120 TPD, in a
facility owned and operated by NWMS at Tedibaghiya. This plant is not
to be confused with a recycling plant and serves only as a transit point for
the dry waste generated in the city. The processes followed here are sorting,
sub-sorting, bailing and transportation. NWMS has tied up with Al-Mehtab
recyclers who take away the sorted and bailed waste at regular intervals to
20AGRA: ROADMAP FOR A ZERO WASTE CITY
HOW MUCH WASTE GOES TO THE KUBERPUR
DUMPSITE?
AMC keeps a record of the total quantity of waste that reaches the Kuberpur
dumpsite on a daily basis. CSE obtained data for the months of September,
October and November 2020. Even a cursory analysis of the data revealed that
huge quantities of waste was reaching the dumpsite. This was in variance with the
reported 712 TPD that Agra claims to generate. Three random days were picked in
each month to arrive at the average amount of waste that reaches the dumpsite
daily (see Table 7: Waste received by the Kuberpur dumpsite).
Table 7: Waste received by the Kuberpur dumpsite
Month and date chosen Waste received Daily average
for analysis by random at the dumpsite (tonnes)
sampling (tonnes)
1 September 2020 767.71
15 September 2020 681.015 759
30 September 2020 828.38
10 October 2020 868.355
20 October 2020 830.305 850
31 October 2020 851.26
1 November 2020 583.87
20 November 2020 833.9 780
30 November 2020 922.235
Source: CSE 2020, with data inputs from Agra Municipal Corporation
their recycling facilities. NWMS also claims to have six collection points for
dry waste collection, of which three could be located in Transport Nagar and
were not functional during all CSE team visits, the other three dry waste
collection points could not be located.
However, during CSE team’s visits, it was observed that recyclables from
hospitals also reach the processing facility. Such material is supposed to reach
the facility only after autoclaving, but the material seen at the site contained
sharp metal objects (including needles).
Plastic waste management
A plastic ban is in force in the city. The ban was implemented in three stages:
a. First stage: All plastics of size less than 50 microns were banned.
b. Second stage: Thermocol, disposable or one-time-use plastic products
such as spoons, plates, glasses, etc. were banned.
c. Third stage: All types and sizes of plastic and thermocol products were
banned.
However, people were found non-compliant with the ban in meetings and
during IEC activities. It became the duty of AMC to penalize offenders.
Although the number of challans issued cumulatively are not even 0.1 per cent
of the population, the penal provision has led abatement of the nuisance.
21AGRA: ROADMAP FOR A ZERO WASTE CITY
PROCESSING OF BIOMEDICAL WASTE, INCLUDING
DOMESTIC HAZARDOUS WASTE
Management of biomedical waste generated in healthcare facilities is a state
subject. JRR Waste Management has been awarded the contract for collection
and processing of biomedical waste generated in Agra. The facility for processing
biomedical waste is located in the outskirts of the city in Etmadullah, Dharera away
from residential areas and human settlement, as specified in the Biomedical Waste
Management Rules, 2016.
With the advent of COVID-19, urban local bodies (ULBs) have been roped in by
prescribed authorities to manage biomedical waste. The primary responsibility
of ULBs is to prepare an inventory of all isolation wards, quarantine camps and
homes—and ensure that waste is channelized from these hotspots to common
biomedical waste treatment facilities (CBWTFs).
CSE’s team found that around 20 TPD of biomedical waste was being treated in
Agra. The facility did not receive sanitary waste from non-COVID-19 households.
However, COVID-19 waste like PPE kits, gloves, masks and other paraphernalia was
received in huge quantities by the CBWTF. The increase in the quanity of biomedical
of waste due to the pandemic could not be ascertained.
Landfill
Agra dumps its mixed waste at the Kuberpur dumpsite, spread over 75 acres.
The site was planned as an integrated waste processing-cum-sanitary landfill.
A 750 TPD waste processing plant was installed for processing incoming waste,
and a small sanitary landfill covering an area of 15,000 sq m was developed for
residual inert from the processing plant. Kuberpur became operational for use
in December 2011. However, in 2013 the concessionaire stopped operating the
processing plant. Since then, the site has become a dumping ground for mixed
waste. As of now, an area of 30 acres is covered with unprocessed waste, with
the dumping height ranging from 5 to 20 metres. During CSE team’s visit,
it was observed that mixed waste is being dumped without any compaction,
liners or any air pollution prevention measures in place.
Biomining operations: The dumpsite is estimated to contain 800,000 tonnes
of legacy waste. In 2018, AMC floated an expression of interest (EOI) for its
management. The EOI explored options of scientific closure by biocapping
or biomining. In 2019, an agency called PAKS was awarded the biomining
contract. An estimated 1,500 TPD of legacy waste is being handled by the
concessionaire. The concessionaire is solely responsible for exploring the
market for sale of recovered or mined materials and generating revenue. The
estimated cost of the project is around Rs 26 crore.
22AGRA: ROADMAP FOR A ZERO WASTE CITY
Challenges
The solid waste management challenges that Agra faces are no different from
the ones faced by any other city administration in the country. This chapter
focuses on aspects which need to be made a priority by AMC to ensure a sound
waste management system in the city.
Quantification of waste generation
The exact quantity of solid waste generated in Agra is uncertain. As per data
provided by AMC, 680 TPD of solid waste was generated in 2001. AMC’s
Action Plan report states that this increased to 750 TPD in 2011 and stands
at 712 TPD at present (see Graph 10: Agra’s waste generation timeline). It is
unlikely that waste generation would have decreased during these years as the
city’s population increased and consumerism took deeper roots. Moreover, the
city sanitation plan report, jointly prepared by the Central Ministry of Urban
Development, AMC and Administrative Staff College of India (ASCI) states
that the city generates 824 TPD of waste. To confuse matters further, this
figure is also reported on the AMC site, along with its own estimate.
Pertinently, the report submitted by state urban development department to
the NGT does not include data on the quantity of waste generated in the city.
However, a report submitted by Central Pollution Control Board (CPCB) to
NGT indicates that about 690 TPD solid waste was being dumped into the
landfill without any treatment.
Graph 10: Agra’s waste generation timeline
760 750
740
Waste generated (TPD)
720 712
700
680
680
660
640
2001 2011 2017
Year
Source: CSE, 2020, on the basis of data provided by AMC
23AGRA: ROADMAP FOR A ZERO WASTE CITY
Operational challenges
Segregation
Although AMC claims that it segregates 40 per cent of Agra’s waste, during
CSE team’s visit to the collection sites and transfer stations it was observed
that a much lower percentage of segregation was achieved. A handful of
BWGs, mostly hotels, are definitely segregating their waste and handing it
over to the concerned concessionaire, but most of them are not practising
source segregation. Segregation majorly happens at the back of the primary
collection vehicles, with dedicated staff for taking out any resaleable high value
material like PET bottles, metals and cardboard boxes, but this cannot be in
any dimension of reality termed as source segregation. As far as commercial
establishments are concerned, some of them follow source segregation, but
the waste is given to kabbadiwallahs and it never reaches the primary waste
collection vehicle. As per the Action Plan report prepared by AMC in 2019, the
average source segregation in the city is 9 per cent.
Collection
The Action Plan report further states that the city’s average door-to-door
collection percentage was 91.66 per cent. Door-to-door collection is very
efficient in certain pockets. Collection is definitely one aspect in which Agra
has shown progress but it needs to be improved further to achieve 100 per
cent waste collection from all kinds of establishments to ensure there is no
illegal dumping and littering on the streets, especially by small commercial
establishments like petha and leather dealers. The Action Plan report
also presents a gap of 215 non-motorized vehicles, 39 motorized vehicles,
approximately 550 workers and 14 personnel for monitoring. It was observed
during the CSE team’s visit that all primary collection vehicles have been
equipped with two–four sets of three-colour coded bins (green, blue and red),
but they are not used for the intended purpose of collecting segregated waste.
Primary transportation
Primary transportation is done by AMC in 114 motorized vehicles and 1,500
tricycles, the current gross capacity of the vehicles available for primary
collection is approximately 100 tonnes (for motorized vehicles) and close to
200 tonnes (for tricycles). The gaps presented in the Action Plan have been
approved by the floating finance commission, but the funds have not yet been
disbursed due to the pandemic. Agencies that were collecting waste earlier
brought it to the dhalaoghars or community bins from where it was picked up
by AMC workers and taken to transfer stations. The waste was then transferred
to secondary transport vehicles which took the waste to the dumpsite. AMC
is trying to eradicate the culture of using community bins to dump waste.
Therefore, transfer stations have been proposed in every zone. CSE’s team
visited some transfer stations. Tajganj transfer station was functional. The
one at Transport Nagar, designed to receive waste from Lohamandi and
Hariparvat, had been commissioned but was not receiving waste on a regular
basis. Chatta does not have a transfer station, and since a major portion of it
lies across the Yamuna, it needs a transfer station of its own to cut fuel and
labour costs of primary transportation.
24AGRA: ROADMAP FOR A ZERO WASTE CITY
Secondary transportation
Secondary transportation is carried out by 93 secondary collection vehicles, of
2–9.45 tonnes capacity. The gross capacity of the fleet is 400 tonnes and most
vehicles make multiple trips every day to the Kuberpur dumpsite. A request
for fifty five 18 m3 reversible compacters has been approved by the floating
finance commission which will add approximately 450 tonnes of carrying
capacity to the fleet. Funds for this have also been approved but have not yet
been disbursed due to the pandemic. Almost all waste received at the transfer
stations is mixed. The whole idea of secondary transportation of mixed waste
is thus unsustainable and needs to be reviewed by city authorities.
Processing capacity
The combined wet waste and dry waste processing capacity of Agra is roughly
450 TPD. It can be said that the processing capacity of the city is close to 56
per cent which is commendable, but the existing facilities are not being used
to the intended scale and for the purpose for which they have been designed.
There is a clear need of decentralized processing facilities, which could
considerably reduce the transportation expenses of carrying all the waste
generated in the city to the dumpsite which is almost 15 km away from the
city limits.
Informal sector
Agra has a very strong presence of the informal sector in its solid waste
management segment. Informal rag-pickers are a common sight in the city.
The 2019 Action Plan put the number of rag-pickers operating in the city at
273, which is almost three per ward. Although the techniques and modus
operandi of the informal sector are debateable, their reach cannot be ignored.
There is a dire need to identify all informal hotspots in the city and plan their
inclusivity into the waste management operations of AMC.
Financial sustainability
To increase the financial sustainability of the overall process, the city needs to
shift focus on minimizing the cost of transportation, channelizing segregated
waste from transfer stations to relevant processing facilities, and extracting
optimum amounts of valuable resources from the waste while also creating
meaningful livelihood opportunities for the formal and informal workers in
the process.
25AGRA: ROADMAP FOR A ZERO WASTE CITY
Roadmap for a Zero Waste Agra
The challenge in Agra is to design and institute a more sustainable, affordable
and eco-friendly value chain for solid waste management around the concept
of circular economy. The city secured the 16th position in the Swachh
Survekshan 2020 by demonstrating a strong commitment to improvement in
sanitation and waste management services. By strengthening the existing weak
links, Agra could achieve an even higher ranking in the SS scorecard and get a
platinum rating in Prerak Dauur Samman (see Box: Prerak Dauur Samman).
Agra could also emerge as a model city by moving towards decentralized
PRERAK DAUUR SAMMAN
In addition to the system of score-based ranking on defined thematic areas, Swachh Survekshan (SS) 2021 has
introduced Prerak Dauur Samman (PDS) as an additional performance category to promote decentralized waste
management practices. PDS is divided into five subcategories, i.e. Divya (Platinum), Anupam (Gold), Ujjwal (Silver),
Udit (Bronze) and Aarohi (Aspiring), based on the performance of the cities on the following indicators:
• Segregation of waste into wet, dry and hazardous categories
• Ratio of wet waste processing capacity to total wet waste generated
• Processing and recycling of wet and dry waste
• C&D waste processing
• Percentage of waste going to landfills
PDS is a great value addition to the previous versions of SS and will provide significant mileage to incentivize
cities on sustainable waste management and their movement towards zero waste by bringing issues like source
segregation, processing efficiency, recycling and zero landfills into renewed focus.
Table 8: Criteria for Prerak Dauur Samman
Ranking Criteria
category Segregation Ratio of Processing C&D waste Percentage Current
of waste into processing and processing of waste sanitation
wet, dry and capacity recycling going to status (as on
domestic against of waste the landfill 31 December
hazardous total wet (dry and 2020)
(Mandatory for waste wet)
Platinum) generated
Platinum > 95 per cent > 91 per > 91 per > 50 per Up to 10 per Water +
(Divya) wards cent cent cent cent
Gold (Anupam) > 75 per cent > 81 per > 81 per > 40 per Up to 15 per ODF ++
wards cent cent cent cent
Silver (Ujjwal) > 55 per cent > 71 per > 71 per > 30 per Up to 20 per ODF +
wards cent cent cent cent
Bronze (Udit) > 35 per cent > 61 per > 61 per > 20 per Up to 25 per ODF+
wards cent cent cent cent
Aspiring > 15 per cent > 50 per > 50 per > 10 per > 25 per ODF
(Aarohi) wards cent cent cent cent
Source: SS Toolkit, MoHUA
26AGRA: ROADMAP FOR A ZERO WASTE CITY
management of solid waste, increasing its recycling and processing efficiency
and gradually decreasing the quantity of waste being brought to the dumpsite.
In order to achieve this, AMC needs to have strong institutional arrangements,
high capacity human resource at key leadership positions, ward and zone level
officials and a sanitation task force with a robust interface with the people. The
entire process has to be supervised by a multisectoral team at the corporation
led by the Commissioner.
CSE recommends a roadmap for two years as follows:
Ensuring 100 per cent source segregation
Source segregation is a non-negotiable and fundamental sustainable waste
management criterion. It must be the preamble to the agenda for change.
Solid Waste Management (SWM) Rules of 2016 created a new mandate for
segregation of waste. These Rules state that source segregation of waste is
necessary so that waste can be turned into wealth, through recovery, reuse
and recycling. All generators of solid waste, including households, have
to segregate waste into three streams: biodegradables, dry (plastic, paper,
metal, wood, etc.) and domestic hazardous (cleaning agents, diapers, napkins,
mosquito repellents, etc.) before handing it over to waste collectors.
Segregation target
(a) 100 wards, four zones
(b) 4.39 lakh households
(c) 2,352 BWGs
(d) 712 tonnes of municipal solid waste
Strategy for source segregation
a) Adopting a 360-degree communication campaign focusing on source
segregation. The campaign to include:
I. Video messages by the District Magistrate, Commissioner, Mayor,
local MP, MLA, and eminent personalities and opinion leaders in
Agra on source segregation. The video would be broadcast over social
media platforms (target audience), AMC website, cinema halls, etc.
II. A communication toolkit to engage with and educate school children
using virtual platforms with the objective to introduce segregation in
schools and at home. Agra has 319 schools with an average of 500
students per school. The reach will be about 150,000 households.
III. IEC material with messages on source segregation in the form of sign
boards, posters and leaflets.
IV. Communicating with households through push SMS (in local
vernacular) using a dedicated SMS gateway to communicate with
property tax payers.
V. Coining ‘Green Agra’ as the key message for source segregation.
b) Property tax rebate to households—AMC can adopt bye-laws to introduce
tax rebates for households giving segregated waste to doorstep collectors.
c) Inviting local industrial units to provide CSR funds for hiring volunteers
for hyper-local level campaigns of six month duration in all wards to
27AGRA: ROADMAP FOR A ZERO WASTE CITY
Table 9: Roadmap for achieving source segregation
Programme Month
component
Timeline 1 2 3 4 5 6 7 8 9 10 11 12 13 14 15 16 17 18 19 20 21 22 23 24
Source segregation Quarter-1 Quarter-2 Quarter-3 Quarter-4 Quarter-5 Quarter-6 Quarter-7 Quarter-8
Preparing
communincation
products
Campaign through
social media
Door-to-door
campaign by trained
CSR volunteers and
distribution of colour-
coded bins
Declaration of
property tax rebate
after adopting bye-
laws on the same
Declaring a cut-off
date for source
segregation including
puniive measures
Separating days for
collection of wet
and dry waste after
mapping of waste
treatment facilities
Targetting specific
locations for enforcing
source segregation in
order of priority
Developing a
monitoring tool
(mobile app based) for
ward-wise collection of
segregation data
Collecting daily data
on source segregation
(ward-wise) for
concurrent monitoring
and review
Source: CSE
reach each and every individual and institutional waste generator. The
volunteers would be trained to motivate and build capacity of waste
generators to adopt source segregation.
d) Declaring a cut-off date for enforcement of source segregation in the entire
city—ideally after the communication campaign has been rolled out city-
wide to inform citizens of the punitive measures (challan) against giving
mixed waste to collectors.
e) Separating out days for collection of wet and dry waste—wet waste would
be collected daily and dry waste weekly or bi-weekly.
f) Distribution of colour-coded bins to individual waste generators for
storing wet, dry and domestic hazardous wastes separately—CSR funds
may be utilized for procurement of bins with their branding.
28AGRA: ROADMAP FOR A ZERO WASTE CITY
g) Adopting a roadmap for implementation of source segregation and
gradually increasing it to achieve 100 per cent source segregation over a
period of 12 months. In order of priority, BWGs would be targeted first,
followed by economically progressive areas (without slum population)
and finally developing areas with slum population.
h) Developing a ward-level daily monitoring mechanism for dcollection of
segregated waste—AMC may introduce a customized mobile app and
mandate submission of daily collection and segregation data by ward-
level officials. The monitoring data would be reviewed for need-based
course correction.
Support from CSE on source segregation
(a) Developing communication tools and finalizing them in consultation with
AMC.
(b) Developing a training module for CSR volunteers on source segregation—
CSE would conduct a training of trainers (ToT) with AMC officials.
Trained master trainers would train all volunteers in a cascading mode,
keeping in view the deployment plan to achieve source segregation.
(c) CSE would assist AMC in drafting bye-laws for property tax rebate,
notification to enforce source segregation with penal provisions and
designating days for separate collection of wet and dry waste.
(d) CSE would assist AMC in developing a monitoring tool (using an
open source third party mobile app—mWater) for reporting ward-
wise segregation status along with compilation of the report on source
segregation for review by AMC officials.
Decentralized management of organic waste
Agra produces about 712 tonnes of municipal solid waste every day, out of
which about 58 per cent (412.96 tonnes) is wet or organic waste. There are two
main generators of organic waste, BWGs, which contribute about 30 per cent
(123.88 TPD), and individual households, contributing about 289.08 TPD.
AMC needs to manage organic waste in a decentralized manner so that the
dumpsite at Kuberpur receives only the inert non-hazardous fraction.
Efforts should be made to create decentralized composting facilities at
household, institution, ward, cluster of ward and zone levels, to increase the
overall treatment efficiency. Instituting decentralized management of organic
waste will have manifold benefits including improving the quality of compost,
substantial reduction in the cost of waste transportation, significant reduction
in the load on the dumpsite, and decrease in the resultant GHG emissions
and leachate. In order to increase the efficiency of decentralized organic waste
treatment, CSE recommends the following:
Target for setting up decentralized organic waste management
facilities
(a) 289.08 TPD generated by individual households.
29AGRA: ROADMAP FOR A ZERO WASTE CITY
Table 10: Roadmap for decentralized management of organic waste
Programme Month
component
Timeline 1 2 3 4 5 6 7 8 9 10 11 12 13 14 15 16 17 18 19 20 21 22 23 24
Organic waste Quarter-1 Quarter-2 Quarter-3 Quarter-4 Quarter-5 Quarter-6 Quarter-7 Quarter-8
management
Preparing
communincation
products to promote
home composting
including easy-
to-do composting
technologies
Campaigning on social
media
Door-to-door
campaign by trained
CSR volunteers to raise
awareness on home
composting
Declaration of
additional property tax
rebate for adopting
home composting
Identifying suitable
spaces for setting up
small-scale composting
facilities (starting with
the 88 wards that are
generating 5 TPD or
less waste)
Partnering with
local industries for
CSR funds to meet
the CAPEX for the
composting facilities
Partnering with local
NGOs/ companies to
run the composting
plants
Enforcing SWM 2016
rule to all BWGs
for managing their
organic waste by AMC
enlisted agencies
Developing of
monitoring tool
(mobile app based) for
ward-wise collection
data on composting
Collecting daily data
on composting (ward-
wise) for concurrent
monitoring and review
Source: CSE, 2020
(b) 114.88 TPD, the current gap between organic waste generated by BWGs
and treated.
Strategy for decentralized management of organic waste
(a) Starting a large-scale city-wide communication campaign to promote
home composting, using volunteers to take the message to each households.
30AGRA: ROADMAP FOR A ZERO WASTE CITY
(b) Incentivizing home composting practices by additional rebate on property
tax—adopting specific bye-laws in this respect.
(c) Publishing the name(s) of households adopting home composting
on the AMC website and AMC social media platforms for motivating
other households. Introducing a ‘Green Agra Household’ campaign for
households that are composting the organic waste they produce.
(d) Targeting relatively developed areas as mapped by Agra Development
Authority to promote home composting.
(e) Setting up ward-level small composting facilities, wherever possible—
beginning with wards generating around 5 tonnes or less of organic waste
per day. Currently, there are 88 such wards. Wards with higher waste
generation could be taken up either at the ward-level or as a cluster of
wards for setting up similar facilities.
(f) Building partnerships with local industrial units for leveraging CSR funds
for capital expenditure to create small-scale decentralized composting
facilities, naming the facilities after the sponsoring industrial unit to allow
brand promotion.
(g) Building partnerships with local NGOs or waste-to-compost companies
to run the composting facilities, marketing the final product with quality
monitoring.
(h) Enforcing the provision of SWM Rules, 2016 to ensure BWGs manage
their organic waste on their own by partnering with agencies enlisted with
AMC. This will help reduce the organic waste management burden on
AMC.
(i) Collaborating with the state agriculture department to create a value
chain for compost—at least 10 per cent to be procured by local fertilizer
companies.
(j) Adopting a roadmap for operationalizing decentralized organic waste
treatment facilities and gradually increasing the treatment efficiency
to 100 per cent over a period of 12 months, reinforced by a systematic
monitoring mechanism and periodic review of the progress made.
(k) Registering with the SBM scheme to avail higher selling value for the
compost.
Support from CSE on management of organic waste
(a) Developing communication tools to promote home composting and
finalizing a dissemination strategy in consultation with AMC .
(b) Developing a training module for CSR volunteers on home composting
and a simple, eco-friendly and low-cost composting technology manual.
CSE would do a training of trainers (ToT) with AMC officials. The trained
31AGRA: ROADMAP FOR A ZERO WASTE CITY
master trainers would train all volunteers in a cascading mode, keeping in
view a deployment plan to popularize home composting.
(c) CSE would assist AMC in drafting bye-laws for additional property tax
rebate to promote home composting and notification to BWGs to enforce
management of organic waste through enlisted agencies.
(d) CSE would assist AMC in developing a monitoring tool (using an open
source third party mobile app—mWater) for reporting of ward-wise home
composting and organic waste processing efficiency.
Decentralized management of dry waste
As per AMC’s 2019 report, Agra produces 161.37 TPD of dry waste, that
constitutes about 22 per cent of the municipal solid waste produced by the
city. However, RCUES’s 2017 DPR for Agra puts the percentage of dry waste
the city produces at 28.6, yielding a quantity estimate of 203.63 TPD. The
RCUES report further states that 30 per cent (61.08 TPD) of the dry waste is
contributed by BWGs and the remaining (142.88 TPD) comes from individual
generators. Agra has a good dry waste management system, especially for the
waste generated by BWGs. Dry waste collection from individual generators
can be improved if source segregation picks up.
Looking at the current situation, CSE recommends the following measures:
Target for collecting segregated dry waste from individual
waste generators and processing at the decentralized dry waste
management facilities
(a) 142.88 TPD generated by individual households
(b) 61.08 TPD generated by BWGs
Strategy for decentralized management of dry waste
(a) Introducing a system of door-to-door collection with designated days for
collecting dry waste only from individual and institutional generators—
piloting this initiative in a relatively receptive ward before scaling it up in
all 100 wards of the city.
(b) Partnering with local industrial units for CSR funds to meet the CAPEX
for strengthening existing MRFs with improved automation for secondary
segregation, sorting, baling and storing.
(c) Redesigning the waste transportation mechanism to bring the entire
volume of dry waste directly to the processing facilities or MRFs for
secondary segregation.
(d) Dispatching segregated recyclables (dry waste) to authorized recyclers
and non-recyclables to designated waste-to-energy plants, cement kilns
or brick kilns, thus ensuring nothing needs to be transported to the
Kuberpur dumpsite.
32AGRA: ROADMAP FOR A ZERO WASTE CITY
Table 11: Roadmap for decentralized management of dry waste
Programme Month
component
Timeline 1 2 3 4 5 6 7 8 9 10 11 12 13 14 15 16 17 18 19 20 21 22 23 24
Dry waste Quarter-1 Quarter-2 Quarter-3 Quarter-4 Quarter-5 Quarter-6 Quarter-7 Quarter-8
management
A roadmap for
communication
strategy to achieve
source segregation will
be adopted
The city will adopt a
bye-law for separating
out days for collection
of wet and dry
waste and notify all
concerned
Piloting collection of
dry waste separately in
one ward
Scalling up the
learning from the pilot
and implementing the
new segregatation rule
city-wide
Redesigning the waste
transport mechanism
to collect dry waste
from source to MRFs
for secondary sorting
and processing
Mapping of the
informal waste
collectors’ network
in Agra and
recommending an
economic model for
their integration in the
waste value chain
Developing a
monitoring tool
(mobile app-based) for
ward-wise collection of
data on dry waste
Collecting daily data
on dry-waste (ward-
wise) for concurrent
monitoring and review
Source: CSE, 2020
(e) Mapping the catchment areas served by informal waste collectors,
building their capacity and integrating them in the process of door-to-
door collection of dry waste on designated days or engaging them in
secondary segregation at the MRFs.
(f) Identifying potential recyclers to whom dry waste can be sold.
Support from CSE on dry waste management
(a) CSE would assist AMC in drafting bye-laws for separate collection of wet
and dry waste
33AGRA: ROADMAP FOR A ZERO WASTE CITY
(b) CSE would facilitate a pilot with support from AMC and volunteers to
encourage households to segregate their waste at source and document
the process for further review before the process is scaled up to a city-wide
level.
(c) CSE would undertake extensive research to map the informal waste
collectors’ network and the aggregators (scrap dealers) to propose a model
for integration of the informal workforce in the waste management value
chain.
(d) CSE would assist AMC in developing a monitoring tool (using an open
source third party mobile app—mWater) for reporting ward-wise
collection of dry waste to enable AMC to review the status at regular
intervals.
Decentralized management of domestic hazardous
waste
Despite a clear mandate for it in the Solid Waste Management Rules of 2016,
collection, transportation, treatment and disposal of domestic hazardous waste
is the least discussed of all waste streams. As a result of this, it does not receive
the attention it requires. Domestic hazardous waste has two broad categories:
(a) Domestic biomedical waste comprised of sanitary napkins, baby or
adult diapers, expired medicines, bandages, cotton, syringes, etc.
(b) Domestic hazardous waste that involves bulbs, tubes with mercury,
broken mercury thermometers, batteries, drain cleaners, toilet
cleaners, rat poisons, shoe polish, etc.
Data on how much hazardous waste is generated in Agra is fuzzy. The 2017
RCUES report states that 13 per cent of the waste generated in the city is
hazardous and inerts. A study done by United States Environment Protection
Agency (USEPA) set the thumb rule for calculating domestic hazardous waste;
it is 3 per cent of the total waste generated. By that calculation, Agra produces
about 21.36 TPD of domestic hazardous waste.
In order to treat biomedical components of the domestic hazardous waste
it generates, Agra may consider setting up a dedicated incinerator at an
appropriate location and adopt a roadmap to increase the collection,
transportation and treatment efficiency of domestic hazardous waste. The
other components of domestic hazardous waste—plastics, metals, glass, paper,
etc.—could be pre-treated and recycled at par with segregated dry waste.
Target (estimated) for collection of segregated domestic
hazardous waste
(a) 21.36 TPD from individual and institutional generators
Strategy for management of domestic hazardous waste
(a) Sensitizing the people of Agra on three-way segregation of waste at source
through appropriate communication tools.
34You can also read