RUHR ECONOMIC PAPERS - Cream Skimming by Health Care Providers and Inequality in Health Care Access: Evidence From a Randomized Field Experiment ...
←
→
Page content transcription
If your browser does not render page correctly, please read the page content below
RUHR
                                               ECONOMIC PAPERS

     Anna Werbeck
    Ansgar Wübker
Nicolas R. Ziebarth

                      Cream Skimming by Health Care Providers
                      and Inequality in Health Care Access:
                      Evidence From a Randomized Field
                      Experiment

                                                                #846
Imprint Ruhr Economic Papers Published by RWI – Leibniz-Institut für Wirtschaftsforschung Hohenzollernstr. 1-3, 45128 Essen, Germany Ruhr-Universität Bochum (RUB), Department of Economics Universitätsstr. 150, 44801 Bochum, Germany Technische Universität Dortmund, Department of Economic and Social Sciences Vogelpothsweg 87, 44227 Dortmund, Germany Universität Duisburg-Essen, Department of Economics Universitätsstr. 12, 45117 Essen, Germany Editors Prof. Dr. Thomas K. Bauer RUB, Department of Economics, Empirical Economics Phone: +49 (0) 234/3 22 83 41, e-mail: thomas.bauer@rub.de Prof. Dr. Wolfgang Leininger Technische Universität Dortmund, Department of Economic and Social Sciences Economics – Microeconomics Phone: +49 (0) 231/7 55-3297, e-mail: W.Leininger@tu-dortmund.de Prof. Dr. Volker Clausen University of Duisburg-Essen, Department of Economics International Economics Phone: +49 (0) 201/1 83-3655, e-mail: vclausen@vwl.uni-due.de Prof. Dr. Ronald Bachmann, Prof. Dr. Roland Döhrn, Prof. Dr. Manuel Frondel, Prof. Dr. Ansgar Wübker RWI, Phone: +49 (0) 201/81 49 -213, e-mail: presse@rwi-essen.de Editorial Office Sabine Weiler RWI, Phone: +49 (0) 201/81 49-213, e-mail: sabine.weiler@rwi-essen.de Ruhr Economic Papers #846 Responsible Editor: Ansgar Wübker All rights reserved. Essen, Germany, 2020 ISSN 1864-4872 (online) – ISBN 978-3-86788-981-0 The working papers published in the series constitute work in progress circulated to stimulate discussion and critical comments. Views expressed represent exclusively the authors’ own opinions and do not necessarily reflect those of the editors.
Ruhr Economic Papers #846
          Anna Werbeck, Ansgar Wübker, and Nicolas R. Ziebarth

Cream Skimming by Health Care Providers
    and Inequality in Health Care Access:
      Evidence From a Randomized Field
                              Experiment
Bibliografische Informationen der Deutschen Nationalbibliothek The Deutsche Nationalbibliothek lists this publication in the Deutsche Nationalbibliografie; detailed bibliographic data are available on the Internet at http://dnb.dnb.de RWI is funded by the Federal Government and the federal state of North Rhine-Westphalia. http://dx.doi.org/10.4419/86788981 ISSN 1864-4872 (online) ISBN 978-3-86788-981-0
Anna Werbeck, Ansgar Wübker, and Nicolas R. Ziebarth1

Cream Skimming by Health Care Providers
and Inequality in Health Care Access:
Evidence From a Randomized Field
Experiment

Abstract
Using a randomized field experiment, we show that health care specialists cream-skim patients by their
expected profitability. In the German two-tier system, outpatient reimbursement rates for both public and
private insurance are centrally determined but are more than twice as high for the privately insured. In
our field experiment, following a standardized protocol, the same hypothetical patient called 991 private
practices in 36 German counties to schedule appointments for allergy tests, hearing tests and gastrosco-
pies. Practices were 7% more likely to offer an appointment to the privately insured. Conditional on being
offered an appointment, wait times for the publicly insured were twice as long than for the privately in-
sured. Our findings show that structural differences in reimbursement rates lead to structural differences
in health care access.

JEL-Code: I14, I11, I18

Keywords: Health care inequality; reimbursement rates; health care access; discrimination; cherry picking;
gastroscopy; audiometry; allergy test; allergists; otorhinolaryngologist; gastroenterologist

April 2020

1 Anna Werbeck, RGS Econ and RWI; Ansgar Wübker, RWI, LSCR and RUB; Nicolas R. Ziebarth, Cornell University - We
thank Sebastian Bauhoff, Kevin Devereux, Peter Eibich, Jenke De Keyser, Brigitte Dormont and Harald Tauchmann for
excellent discussions of this work. We also thank Tigran Aydinyan, Sergej Bechtoldt, Katharina Blankart, Amitabh Chandra,
Daniel Herrera, Tom Hoe, Toshiaki Iizuka, Nima Jouchaghani, Hendrik Jürges, Christoph Kronenberg, Isabelle Maripier,
Giuseppe Moscelli, Julien Mousquès, Catia Nicodemo, Cheti Nicoletti, Simon Reif, Hendrik Schmitz, Hannes Schwandt, Erin
Strumpf, David Slusky, Chris Whaley, Daniel Wiesen, Lilia Zhurakovska and participants at the 2019 American-European
Health Economics Study Group, the 2019 ASHEcon meetings, the 2019 Annual Congress of the European Economic
Association, the 2019 IRDES-DAUPHINE Workshop on Applied Health Economics and Policy Evaluation, the 2019 RGS
conference, the 2018 Workshop of the dggö committee „Gesundheitsökonometrie“ (“health econometrics”) for helpful
suggestions and comments. Special thanks go to Alexander Haering and Paul Pangburn for excellent research assistance.
The research reported in this paper is not the result of a for-pay consulting relationship. Our employers do not have a
financial interest in the topic of the paper which might constitute a conflict of interest. The field experiment was carried
out at RWI Essen, a German publicly funded research institute, which does not have IRB approvals. All ethics guidelines
by the German Science Foundation were followed; the guidelines for good scientific practice are here http://www.dfg.de/
en/research_funding/principles_dfg_funding/good_scientific_practice/. The standardized protocols minimized the time to
inquire about appointments. No actual appointment was made. - All correspondence to: Nicolas Ziebarth, Cornell University,
Policy Analysis and Management (PAM), 426 Kennedy Hall, Ithaca, NY 14853, DIW Berlin, e-mail: nrz2@cornell.edu
1.     Introduction

       Access barriers to health care are a major performance indicator in comparative health

care system analysis (Siciliani and Hurst 2005; Sicilinani and Verzulli 2009; Jones et al. 2011,

Viberg et al. 2013). The nonpartisan Commonwealth Fund uses wait times as the main measure

of health care access in their “Timeliness to Care” category, where the United States ranks 9th

among 12 countries in the 2017 survey (Commonwealth Fund 2017). At the same time, wait times

have long been cited by critics as proof of mediocre outcomes of single-payer systems (cf.

Mackillop et al. 1995). Indeed, wait times for specialists are significantly longer in Canada as

compared to the largely private system in the United States. In Canada, 30% of patients have to

wait more than 2 months for a specialist appointment as compared to just 6% in the United States

(Commonwealth Fund 2017).

       Another major performance indicator to rate health care systems is equity in access to

health care (e.g. van Doorslaer et al. 2000)—a dimension on which the United States has

consistently ranked last among the 12 OECD countries benchmarked by the Commonwealth Fund

(2014, 2017). In the U.S., thousands of private managed care insurers individually negotiate

reimbursement rates with networks of providers. Furthermore, the public Medicaid system for

the poor pays significantly lower rates than private insurers or the single-payer Medicare system

for the elderly (CMS 2018a). Critics of this fragmented private-public U.S. system have pointed

out large inherent inequalities, even among those who have insurance (Sommers et al. 2017).

One consequence of a system with major differences in reimbursement rates could be that

providers cream-skim and discriminate against those with structurally lower reimbursement

rates which tend to be the poor and sick (Reinhardt 2011). However, although plenty of anecdotal

and descriptive evidence exists, it is difficult to show in a causal framework that health care

                                               1
providers discriminate against Medicaid enrollees and cherry-pick the privately insured because
they are more profitable.
This paper uses a randomized field experiment in a well-suited institutional private-public
payer setting to show that health care specialists cream-skim the more profitable privately
insured patients. Germany has a multi-payer two-tier system where the majority of the
population is mandatorily insured under the public system in one of the 110 non-profit public
“sickness funds” (Schmitz and Ziebarth 2017). In the public system, provider reimbursement rates
are centrally negotiated and do not vary across sickness funds. Moreover, cost-sharing is
standardized and invariant across sickness funds, while provider networks are non-existent and
enrollees can freely choose their provider (Bauhoff 2012, Bünnings et al. 2018). The situation is
similar for the 9 million privately insured residents: reimbursement rates are uniform across the
44 private insurers and provider networks do not exist; insurers mostly process claims (Atal et al.
2019). However, reimbursement rates for the privately insured are on average more than twice
as high than for publicly insured (Walendzik et al. 2008). This institutional setup is well-suited for
our study. No other country has a two-tier public-private health care system without provider
networks and with reimbursement rates that i) structurally vary between the two systems ii) but
are otherwise identical across plans within each system.
In our field experiment, we selected a total of 36 representative counties (both urban and
rural) and called a total of 991 outpatient specialists to ask for appointments for elective medical
treatments. One single test person called each practice twice, once as a fictitious privately
insured new patient and once as a fictitious publicly insured new patient, randomizing the
insurance status between the two calls. In other words, the same test person called each private
outpatient practice twice following the exact same protocol, thereby ensuring balanced
covariates by construction. This allows us to carry out straightforward statistical tests to assess
2whether extensive and intensive access barriers to health care differ significantly by insurance
status.
Our findings show that access to the health care system differs significantly between the
privately and publicly insured, both on the extensive and the intensive margin. The likelihood to
be offered an appointment is a highly significant 7% larger for privately insured patients.
Moreover, conditional on being offered an appointment, the wait times for publicly insured
patients are more than twice as long, and on average 13 weekdays longer.
This paper makes important contributions to the literature. Although the literature on
physician behavior and treatment styles is rich and has a long tradition in economics (e.g.,
Clemens and Gottlieb 2014, also see Section 2), the causal effects literature on how providers
discriminate against less profitable patients is less diverse. We contribute to a better
understanding of the role of varying reimbursement rates in determining equitable access to the
health care system for disadvantaged population groups. For example, for the Unites States,
Cooper et al. (2018) document that reimbursement rates just among the privately insured could
vary by a factor of 10 within cities and by more than 20 across the United States of America.
Natural experiment studies closely related to this research have investigated whether the
Medicaid Fee bump1 of 2013 and 2014 has increased health care access for low-income
populations in the U.S. Although studies outside economics solely investigate statistical
associations (Polsky et al. 2015; Saloner et al. 2015; Candon et al. 2018), the evidence by two
economic causal effect studies suggest that this was likely the case (Alexander and Schnell 2017;
Maclean et al. 2018).
1
The Medicaid fee bump is a provision of the Affordable Care Act that mandates states to increase Medicaid
payments to match Medicare rates for primary care visits for 2013 and 2014.
3This study is one of the first real-world studies that leverages a large randomized field
experiment to test if insurance status causally affects health care access. One single test person
called almost one thousand providers twice where we randomized the insurance status of the
caller. Unlike the few existing studies outside the field of economics, to minimize selection
concerns, our caller routinely informs providers about the insurance status and inquires wait
times without further framing. Moreover, we focus on non-urgent routine specialist visits which
have external validity for everyday interactions between patients and providers in a multi-payer
system with a public-private mix of insurers. We believe that our findings have external validity
for similar systems, such as the U.S. system where—just as in the German case—healthier and
wealthier populations are typically covered by better paying private insurance, whereas the
public Medicaid system pays doctors much lower rates and covers sicker and poorer populations.
Our findings yield important insights into the driving forces of inequality in health care
access (cf. Chen et al. 2019). They suggest that uniform reimbursement rates (or reimbursements
rates that are higher for disadvantaged population groups) could help mitigate inequality in
health care access and align economic incentives with medical needs and priorities. At the same
time, we do not dispute that differences in reimbursement rates can be the outcome of an
efficient system if patients have the choice between differently priced plans and make informed
decisions (cf. Handel and Kolstad 2015).2
The next section describes the literature on this topic, followed by a discussion of the
institutional setting in Germany. Section 4 explains the setup of our field experiment and Section
2
However, the large majority of Germans cannot choose between the private and public system; the institutional
rules separate the public from the private insurance market (see Section 3).
45 the data. After that, we outline the statistical approach of this study before discussing the
findings. Section 8 concludes.
2. Previous literature
This paper relates to various literature strands in economics. However, while many
descriptive papers on socio-economic differences in health care access exist, the causal effects
literature on discrimination in the health care sector is thin.
In contrast, the economics literature has a long tradition of investigating theoretically and
empirically the role of physicians as (imperfect) agents of their patients, see McGuire (2000) for
an excellent overview. In addition, economists have investigated how physician behavior and
productivity changes in response to the reimbursement method, in outpatient as well as in
inpatient settings (Ellis and McGuire 1986; Nicholson et al. 2008). Baker and Royalty (2000) show
in the U.S. context that expanded Medicaid eligibility increased access to physician services.
Similarly, Decker (2009) finds that cuts in Medicaid physician fees reduced the number of visits
for Medicaid patients compared to privately insured patients. For Germany, Schmitz (2013)
shows that newly introduced practice-level budgets for the publicly insured reduced the
likelihood of follow-up visits.
For ethical reasons, real-world field experiments are almost impossible to implement to
study actual treatment behavior, which is why researchers have conducted audit studies (Bauhoff
2012) or investigated hypothetical physician behavior in the lab; see, for example, Brosig-Koch et
al. (2017) for lab experiments in Germany. In one of the few real-world causal effects studies
leveraging relative price changes in the Medicare outpatient market, Clemens and Gottlieb
(2014) demonstrate that higher relative reimbursement rates increase treatments, especially for
elective procedures.
5Absent price variation in single-payer markets, implicit rationing of medical care through
wait times is another popular topic of inquiry for economists (e.g. Lindsay and Feigenbaum 1984).
Cullis et al. (2000) provide a comprehensive overview of the topic in addition to the theoretical
analyses of Siciliani (2006), Gravelle and Siciliani (2008), and Felder (2008). The link between wait
times and socio-economic status has also drawn researchers’ interest. For example, Monstad et
al. (2014) find a negative statistical correlation between income and wait times as well as
education and wait times in Norway. Laudicella et al. (2012) show that the same correlations
exist in England and that they hold up over the entire wait time distribution.
The impact of insurance status on wait times is a highly policy relevant topic in countries
with co-existing insurance systems that pay providers differently, such as the United States,
Switzerland and Germany. In the U.S., the means-tested state-level program Medicaid covers the
poorest members of society (which also are disproportionately sick). Medicaid pays by far the
lowest reimbursement rates of all insurance systems. Several papers have studied the association
between insurance status and wait times of patients (Roll et al. 2012; Sundmacher and Kopetsch
2013; Ramos et al. 2018). All of them find that patients whose insurer pays lower rates have to
wait longer for an appointment. However, because enrollment in ”lower rate” insurers such as
Medicaid is correlated with specific socio-demographics as well as Managed Care elements such
as gatekeeping or capitation, it remains challenging to identify causal effects of insurance status
on discrimination through providers. Similar arguments hold for the case of Germany.
To our knowledge, there exist three studies (two outside the field of economics) which
are similar in design to ours and called providers at least twice with the insurance status
randomized. First, between 2002 and 2003, Asplin et al. (2005) called around 500 ambulatory
clinics in 9 U.S. cities twice and randomized the insurances status of the caller. They find that a
6higher share of privately insured patients was offered an urgent ambulatory follow-up visit within
a week (i.e. they only requested appointments within a week). Second, Kuchinke et al. (2009)
scheduled appointments at around 500 acute care hospitals in Germany. They find that privately
insured callers are offered appointments 1.6 days faster than publicly insured callers.3 However,
differences in wait times were only estimated conditional on the hospital inquiring about the
insurance status (only 25% did).4 Moreover, while private insurance may cover more generous
(or different) treatments for privately insured, reimbursement rates do not vary between public
and private insurance for inpatient care in Germany. Third, Heinrich et al. (2018) called 163
specialists and evaluated a 2015 reform that intended to reduce wait times for the publicly
insured in Germany. They compare data from 2014 to data from 2016, but do not find evidence
that the reform reduced wait time differences.
In contrast to these studies, in our setting, a test person deliberatly called each practice
twice following a standardized protocol, where the insurance status of the caller was randomized.
Moreover, the same person called all private specialist practices and always indicated the
insurance status when trying to schedule a non-urgent medical examination. In Germany,
telephone calls are the most common and most natural approach to schedule appointments.
Non-urgent settings are those where most patient-provider contacts occur. In addition, our
3
In a third study outside of economics, Lüngen at al. (2008) also find that privately insured patients were offered
appointments faster than publicly insured patients. However, they only called each practice once and the “inclusion
rates” differed by insurance status; the authors do not show whether practice covariates were balanced and whether
the randomization was successful. Two other field experiments also contacted practices only once to estimate
discrimination based on socioeconomic status in Canada (Olah et al. 2013) and Austria (Angerer et al. 2019). The
former study called 375 family practices in Toronto. They find that mentioning being employee of a major bank vs.
a welfare recipient increases the likelihood of getting an appointment. The latter requested 1,310 appointments by
email. They find that closing with “Dr.” increases the likelihood of an appointment. Another study outside of
economics from the U.S. leveraged experimental data to assess the associations between primary care clinics’
provider mix and their accessibility to prospective new patients. Clinics with more non-physician clinicians were
associated with better access for Medicaid patients (Richard and Polsky 2016).
4
In a spin-off paper, Schwierz et al. (2011) investigate effect heterogeneity and differentiate the findings by the
financial soundness of the hospital.
7randomized experiment uses a contemporaneous setting and took place over the course of one
year between 2017 and 2018. Finally, we called almost one thousand practices located in a
representative set of 36 German counties—more than any other study, which allows us to carry
out a detailed subgroup analysis. As mentioned, we focus on elective care among outpatient
specialists. These treatments reflect the regular day-to-day access barriers to health care much
better than studying medical emergencies.
3. The German Health Care System
Germany has a two-tier health insurance system with a co-existing multi-payer public and
an individual private market. Ninety percent of the population are covered by the public system
and one of the 110 non-profit sickness funds (GKV Spitzenverband 2018). They pay income-
dependent contribution rates for a standardized benefit package with very little cost-sharing. For
historical reasons, selected population subgroups have the right to leave the public system
permanently and fully insure their health risks on an individual long-term health insurance
market with relatively little regulation. Applicants can choose between thousands of plans but
are also experience-rated when signing their first individual private contract (in subsequent
years, premiums are community rated). Schmitz and Ziebarth (2017), Pilny et al. (2017), and
Bünnings et al. (2018) provide more details on the overall structure of the German health
insurance market. Atal et al. (2019) provide additional specific details of the private market. Note
that 64 million Germans, or 77% of the total German population, are mandatorily insured with
the public scheme (BMG 2019). Those people do not have the choice between public or private
insurance.
Table A1 in the Appendix uses representative data from the German Socio-Economic
Panel Study to compare mean characteristics of the publicly and privately insured in Germany.
8The first column shows sociodemographic averages for the publicly insured and the second
column shows sociodemographic averages for the privately insured. The last three columns
further differentiate by the four population subgroups that can be privately insured (civil
servants, high income, self-employed, non-employed). As seen, the privately insured—not just
on average but also in all four subgroups separately—have significantly higher gross wages
(€4,708 vs. €2,403) and significantly higher post-tax post-transfer household incomes per person
(€40,031 vs. €23,228). They are on average more than 3 years older, are 10 percentage points
less likely to be smokers, have lower BMIs and report fewer physical and mental health
limitations. They are also less likely to be hospitalized and have fewer hospital days per year.
Interestingly, their number of outpatient visits is identical to those that are publicly insured.
Reimbursement Rates in Statutory Health Insurance (SHI)
In the outpatient SHI sector, primary care physicians and specialists are members of and
sign contracts with the state-level “Regional Association of Statutory Health Insurance
Physicians”, ASHIP (Kassenärztliche Vereinigungen), see KBV 2018a. There are 17 ASHIPs, who
are responsible for the provision of health care services in their region. These ASHIPs all have
contracts with the 110 sickness funds who pay out a “total reimbursement sum’’
(Gesamtvergütung) to each of these 17 ASHIPs who, in turn, reimburse their member physicians
on a quarterly basis.
In SHI, the so-called “Unified Assessment Scale’’ (Einheitlicher Bewertungsmaβstab, EBM)
lists services that the SHI benefit package covers. The existence of the EBM is stipulated by the
German Social Insurance Law (§ 87f. SGB V, KBV 2018b). The EBM assigns a point value for each
health care service, similar to the Relative Value Units (RVU) to outpatient providers in Medicare
9in the U.S. (CMS 2018a). The relative point values intend to represent the relevant use of
resources for each service to provide an adequate compensation. 5
Similar to Medicare, by defining annual values per point, the point values are then
converted into monetary reimbursement amounts. For example, in 2018, the value per point was
10.654 euro cents (BMG 2018)6. For a colonoscopy for preventive reasons, including visits to
prepare and inform the patient, the EBM lists 1945 points under “fee position”
(Gebührenordnungsposition) 01741 (KBV 2018b). Consequently, the total basic compensation for
such a colonoscopy would be €207.23.7 In comparison, for the state-level Medicaid insurance for
low-income populations in the United States, Halpern et al. (2014) report reimbursement rates
between $83.94 in New York and $598.20 in Alaska for a colonoscopy.
Reimbursement Rates in Private Health Insurance (PHI)
In PHI, the physician has a private contract with the patient. Patients have to pay
providers first (after receiving an invoice), and then submit their claim to the insurer to get
reimbursed. In PHI, the “Fee Schedule for Physicians” (Gebührenordnung für Ärzte, GOÄ) lists all
reimbursable services along with their baseline prices. As with SHI, each medical service has a
specific number and point value; the latter expresses the relative resource utilization for the
5
In SHI, when physicians provide more services than allocated by the “standardized service volume’’
(“Regelleistungsvolumen”), which is defined by the sum of last quarter’s services and the average in the specialist
group, the point value can decrease (§87b SGB V). However, since 2012, these budget caps, set by the sickness funds
in cooperation with the ASHIPs are optional, see Simon, 2017. For example, North Rhine still imposes budget caps
(KVNO 2018).
6
Geographic adjustment factors take differences in regional living costs into account.
7
Interestingly, the reimbursement rates for colonoscopy in the U.S. under Medicare are similar. Under CPT code
45380 “Colonoscopy and biopsy“, the Medicare feel schedule lists a reimbursement of $212.70 (CMS 2018b).
10treatment. Point values are multiplied with a fixed value of 5.82873 euro cents to obtain the
baseline reimbursement rate.
Depending on the complexity of the treatment and the time spent on its provision, the
physician has the freedom to multiply the baseline rate with “adjustment factors” between 1.15
for laboratory services and 2.3 for personal services. In specific cases, an adjustment factor of 3.5
can be applied for personal services (§5 II-IV GOÄ).8 Also, the physician can perform and charge
treatments not listed in the GOÄ, using prices of similar treatments as a reference (Simon 2017).
Overall, the GOÄ is a classic fee-for-service schedule without any budget caps or cost
containment elements. For example, a standard colonoscopy is listed as number 687 with 1500
points and a baseline value of €87.43 (GOÄ 2018).
Comparison of the SHI and PHI Reimbursement
A direct comparison of the SHI and the PHI reimbursement scheme is difficult. First, the
treatments and services listed in each schedule usually do not exactly correspond. Second, the
SHI schedule is closer to a bundled payment schedule and reimbursement rates include
consultations and follow-up visits. In PHI, physicians typically charge every single service
separately under a pure fee-for-service (FFS) schedule. Third, the GOÄ does not include any
budget caps. Moreover, the EBM has been constantly updated, whereas the GOÄ has not been
updated since 1996.
Walendzik et al. (2008) analyze and compare differences in the reimbursement amounts
for the same treatments under SHI and PHI. They compare data from the largest German sickness
8
If the adjustment factor is larger than 2.3, the calculation must include a justification for the multiplier chosen
regarding the degree of difficulty and time required for the treatment.
11fund with more than 10 million enrollees (Techniker Krankenkasse). For the same services, they
find that providers charge 2.28 times higher reimbursement rates for privately as compared to
publicly insured patients.
Table A2 (Appendix) shows a comparison of what providers typically charge for the
medical examinations inquired in our experiment (KBV 2017, 2018b, GOÄ 2018). The first two
columns yield the points and euro values for publicly insured patients, whereas the next two
columns yield the points and euro values for the privately insured. While specialists do not have
much leeway when charging sickness funds for treatments for the publicly insured, because of
the pure FFS schedule and private contracting, specialists have more leeway when charging
private insurers for the privately insured.9 Hence, the last two columns of Table A2 list actual
charges for privately insured’s treatments when the diagnosis contained the ICD-10 code T78
(“allergy”) as well as K29 (“Gastritis and duodenitis”), K30 (“Functional dyspepsia”) or K31 “(Other
diseases of stomach and duodenum”). We obtained these claims data from one of the largest
private German insurers with about half a million enrollees from 2005 to 2011 (Karlsson et al.
2016). As seen, reimbursement rates for allergy tests are three to four times higher for privately
insured (€49 vs. €184/201). The absolute and relative price difference for hearing tests is much
smaller but rates for the privately insured are still 50% higher (€16 vs. €23). For upper
gastrointestinal endoscopies, reimbursement rates for the privately insured are two to three
times higher than for the publicly insured (€89 vs. €163/204/244).
Finally, the Federal Statistical Office provides detailed statistics about the net revenue
(revenue after costs) of outpatient practices by specialty and type of practice. Accordingly, the
9
Note that managed care basically does not exist in Germany; private insurance essentially represents a purely
financial contract (cf. Atal et al.).
12net revenue per specialist owning a practice was €183K for ear-nose-throat (ENT) doctors, €206K
for internal medicine and €225K for dermatologists (Destatis 2018c).
4. The Experiment
Selection of Counties
Before sampling outpatient providers, we first selected a set of counties that are jointly
approximately representative for Germany. We considered the following three indicators:
household income per capita, area in square kilometers, and the population (BBSR 2018; Destatis
2018a, b). Appendix B describes in detail how we select the counties.
[Insert Figure 1 about here]
Figure 1 shows Germany with its 401 counties, where the dark gray-shaded counties are
part of the field experiment. As seen, the geographic distribution of all 36 counties is relatively
even across all 16 German states as well as between East and West Germany. Comparing the
monthly household income per capita of the 36 counties to the monthly household income for
the whole of Germany, we only find minor differences (€1,723 vs. €1,753). Also, the physician
density per 100,000 population is almost identical when comparing the 36 counties to Germany
as a whole (174 vs. 168 physicians per 100,000 population, see Versorgungsatlas 2018).
Sampling of Outpatient Specialists and Treatments
Next, for these 36 counties, we sampled outpatient specialists to schedule appointments
using Google Maps along with the websites of the three major German telephone books. To
identify operating outpatient specialists in each of the 36 counties, we used “The Telephone
Book”, “Yellow Pages” and “The Local” (Das Telefonbuch 2018).
13In a pre-test, we called specialists anonymously and scheduled appointments for six different
non-urgent medical examinations in the cities of Berlin, Cologne, Bonn, Leverkusen, Hamburg
and Munich. The treatments were an allergy test, a hearing test, an eye examination, a
gastroscopy, a magnet-resonance-therapy of the right knee, and a pulmonary function test.
After this pre-test, in the remaining 30 counties, using the exact same protocol as in the pre-
test, we called gastroenterologists, otorhinolaryngologists, and allergists to schedule
appointments for the following three examinations: (a) an upper gastrointestinal endoscopy, (b)
an audiometry (hearing test), and (c) an allergy test. We chose these three (out of six)
examinations because they are the most popular, non-urgent routine examinations and are
relatively easy to schedule.
Study Design
In total, we called 991 private practices to schedule appointments. The same test person
(the “caller”) made the calls over the course of one calendar year, between April 6, 2017 and May
3, 2018. Importantly, the test person called each practice twice and clearly indicated the
insurance status of the fictional patient. 10 We randomized whether the caller would pretend to
be privately or publicly insured. Moreover, we made the two calls in time intervals of at least two
weeks to not trigger any suspicion about being part of an audit study. Specifically, we randomized
the insurance status of the caller, conditional on (i) day of week, (ii) time of day and (iii) week of
the year. However, we did not randomize (i) to (iii) which is why we control for these variables in
10
When asked about the name of the insurer, we provided a real name. Because reimbursement rates are centrally
determined for publicly and privately insured (Section 3) and not individually negotiated between insurers and
providers, the actual insurer is not crucial in the German setting.
14our regression models, and why balance tables would only show variation in (i) to (iii) but in none
of the other variables.11
During each call, we followed a pre-determined standardized protocol on how to start
and end the call and what answers to give in response to the most frequently asked questions.
All calls were made between Monday and Friday during the regular office hours of each
practice.12 During the call, the caller mentioned that she had a referral by her Primary Care
Physician (PCP). When asked for the name of the PCP, the caller gave a fictional name and
indicated that the practice was in her hometown. Finally, the caller ended all calls without fixing
the suggested appointment to not occupy a slot that could be used for a real treatment. Also,
recall that all requests were for elective non-urgent treatments.
As mentioned, we called 991 unique private practices in the 36 German counties
displayed in Figure 1. Figure A1 in the Appendix shows the distribution of the contacted practices
across the 36 counties. The number of contacted practices varies between 1 in two very small
and low populated counties and 126 in one big German city. The mean number of practices
contacted was 26 per county. In most counties, all three specialists were available.
11
Imagine we would not randomize and always pretend to be publicly insured on the first of the two calls. Then we
could not disentangle insurance status effects from week-of-year seasonal effects. Depending on the specific
setup, such a nonrandomized design may also confound time-of-day and day-of-week effects with treatment
effects. Obviously, supply and demand side factors vary systematically by day of week, time of day and week of
year. We thank an attentive referee for this remark.
12
If voicemail indicated special office hours, the follow-up calls were made during these special hours. When nobody
answered the phone, the practice was flagged as “not available” after three unsuccessful attempts. When the line
was busy in one of these three attempts, the maximal number of attempts was raised to six.
155. Data
Sample Selection
First, we exclude practices from our study for the following reasons: (i) the specialist is
not active anymore (19, 1.9%), (ii) the practice offers only treatments for privately insured
patients13 (43, 4.3%), and (iii) other reasons14 (55, 5.5%). These reasons reduce the number of
unique practices in our study by 117 from 991 to 874.
Second, there are other reasons why practices were unresponsive and we could
(structurally) not make appointments; e.g. the practice was closed for at least one week, for
example during vacations; the practice did not make fixed appointments; the practice
temporarily did not accept new patients or the practice was not reachable after several
unsuccessful attempts. In cases where we could only schedule one appointment, we only
consider the practice once; for example, when the vacations were over. In other words, for all
eligible practices that are not entirely excluded due to reasons (i) and (ii) above, we either tried
to make an appointment during the first call under insurance status A, during the second call
under insurance status B, or in both cases.15 We call this unbalanced sample “Sample A;” it has
1,426 observations of successfully contacted practices. Figure A6 shows a sample selection chart
and Table 1 shows the descriptive statistic for this full sample.
13
Practices have the option to entirely opt out of treating publicly insured patients and declaring themselves an
exclusive practice for privately insured only and people who pay entirely out-of-pocket. These practices, however,
are then banned from charging sickness funds, even when demand from private patients is low. We do not consider
these practices as relevant to the experiment.
14
E.g. practices for children only and misleading telephone numbers.
15
Practices provided several reasons for why no appointment could be offered, some of which may be true and
others excuses. For example, a common justification was that the practice would not make fixed appointments or
temporarily would not accept new patients. We remain agnostic about why specifically no appointment was offered
but test whether, overall, the insurance status had an impact on the likelihood to receive an appointment.
16By contrast, our “Sample B” only includes caller-appointment observations where the
practice offered an appointment to both fictional patients, the publicly and the privately insured.
This sample is balanced, includes 502 unique private practices, and 1,004 caller-appointment
observations.
Main Outcome Variables
We generate two main outcome variables, both of which measure access to the health
care system. The first variable is binary and called apptm. It indicates whether the successfully
contacted practice was willing to schedule an appointment with the fictional patient. As seen in
Table 1, in 85% of all cases, the practice was willing to schedule an appointment.
The second variable is continuous and called dayswait. It counts the number of workdays
(which equal weekdays) from the calling date to the offered appointment.16 It has only valid
values for the 85% of cases when the practice offered an appointment. Figure A2 shows the
distribution of dayswait and Table 1 shows the summary statistic. As seen, the minimum wait
time is an immediate appointment, when patients could be seen on the same day. The maximum
wait time is 171 weekdays and the average wait time is 19 weekdays (almost 4 weeks). Figure A2
shows a left-skewed distribution with a long right tail.
16
This means that we excluded weekends (Saturday, Sunday) as well as public holidays. In a robustness check, we
also excluded weekdays between a public holiday and weekends (Brückentage) as many Germans take vacation days
during these days to have an extended weekend off. We call this variable dayswait II (see Table 1).
17Main Control Variables
The main variable of interest is privately insured. Even in the unbalanced Sample A with
1,426 caller-appointment observations, this variable is almost perfectly balanced with 49.5% of
all observations representing a privately insured fictional patient (Table 1).
Other important control variables indicate the day of the week, the exact calendar date,
the time of the day when the call was made, whether the randomized insurance status was
privately or publicly insured during the first call, and the specialty of the practice. Recall that we
randomize the insurance status conditional on calling a specific practice on a specific day, which
implies that controlling for these variables is warranted.
County-Level Control Variables
The final panel in Table 1 lists the county-level control variables. These have been
provided by the Federal Statistical Office (Destatis 2018a, b) and by the Federal Institute for
Construction, Urban and Space Research (Bundesinstitut für Bau-, Stadt- und Raumforschung),
see BBSR (2018). As seen, the average age of all residents in the 36 counties is 43 years, the
average net income is €1,786 and the average unemployment rate is 7.9%.
6. Statistical Methods
Most important for causal inference in this setting is the fact that we set up a field
experiment, where a test person called each specialist practice twice, where we randomized the
public and private insurance status. Calling each practice twice and randomizing the insurance
status guarantees balanced covariates by design (except for day-of-week, time-of-day and week-
of-year, see above). Because the same test person called all 991 practices and strictly followed a
18pre-determined protocol, simple descriptive statistics and nonparametric bivariate tests should
yield first reliable evidence about access differences between the two insurance groups.
As our main statistical approaches, we run OLS and count data regression models which
routinely control for the calendar date, the day-of-the-week and the time during the day of the
call—in addition to practice-level and county-level controls. Our first model uses the unbalanced
Sample A:
ܽ ൌ ߙ ߚܲܫܪ ܺᇱ ߬ ܼᇱ ߠ ߛܹܱܦ ᐶܱܶܦ ߜ௧ ߩ ݁ ሺͳሻ
where ܽ stands for our first outcome variable apptm, which is binary and indicates—
using the unbalanced Sample A—whether practice offered the fictional patient ݅an
appointment or not. The main variable of interest is ܲܫܪ and indicates whether the caller
indicated to be publicly or privately insured. The model also controls for a set of practice-level
controls ܺᇱ , in particular the specialty group, as well as a set of county-level controls ܼᇱ such as
the county-level unemployment rate or the physician density (see Table 1). As mentioned, the
model routinely controls for the day-of-the-week during which the caller called a practice
(ܹܱܦ ) as well as the time-of-the-day (ܱܶܦ ሻof the call.
In the saturated specifications, we add calendar-date fixed effects, ߜ௧ . Similarly, we
replace the practice-level controls with practice fixed effects ߩ in some specifications. We
routinely cluster the standard errors ݁ at the practice level and estimate linear probability
models using OLS. (However, we also test the robustness of the coefficients using probit models
and calculating marginal effects which are available upon request.)
Our second model uses the balanced Sample B and is:
19ሺݓ ሻ ൌ ߙ ߚܲܫܪ ܺᇱ ߬ ܼᇱ ߠ ߛܹܱܦ ߜ௧ ߩ ݁ ሺʹሻ
where ݓ stands for our second outcome variable dayswait, and measures the wait time
in weekdays for fictional patient ݅ in practice p. It is continuous but skewed to the left (Figure A2),
which is one reason why we replace 0s with 0.01 and take the logarithm. The coefficient
estimates of the main variable of interest, ܲܫܪ , then approximate the wait time differential
between publicly and privately insured patients in percent. The other control variables are
defined as above. We also test the robustness of the results by using the plain ݓ variable and
running negative binomial count data models that consider excess zeros and overdispersion.
In extended specifications, we test for effect heterogeneity by interacting ܲܫܪ with
regional and other variables and add these interaction terms to the model.
7. Results
Nonparametric Findings
We start by plotting nonparametric results. In a perfectly randomized setting, they should
very well approximate the parametric findings that additionally control for date, day-of-week,
time-of-day and practice fixed effects.
Figure 2 plots bar diagrams of the first outcome variable apptm along with 95%
confidence intervals. As can be seen with bare eyes, the share of privately insured who were
offered an appointment (88%) is larger than the share of publicly insured who were offered an
appointment (83%). The five percentage point difference is statistically significant at the 5% level.
A formal t-test has a t-value of 2.5 and is statistically significant at the 5% level.
[Figure 2 about here]
20Next, Figure 3 plots the distribution of the second outcome variable dayswait separately
for the privately and publicly insured using the balanced Sample B. Again, it is easy to see that
the wait time distribution for the privately insured is much more left-skewed than the wait time
distribution for the publicly insured. The former has a lot more mass over the 0 to 20-weekday
support region, and the latter has more mass exceeding 20-weekdays of wait time as well as a
much longer right tail.
[Figures 3 and 4 about here]
Figure 4 plots bar diagrams along with 95% confidence intervals to illustrate mean
differences in wait times between the publicly and privately insured, also using Sample B. As
seen, the mean wait time for publicly insured is almost twice as long and 25 weekdays, whereas
the mean wait time for privately insured is below 12 weekdays. The confidence intervals clearly
do not overlap, indicating a highly significant difference in wait times, depending on the insurance
status. This prior is confirmed by a formal t-test which is significant at the 0.1% level with a t-
value of 9.8.17
Finally, Figures A4 and A5 show the same bar diagrams for apptm and dayswait but
separately for the three specialist groups. In conjunction with the differences in reimbursement
rates (Table A2), this heterogeneity test may link cream-skimming to actual differences in patient
profitability. It is reassuring to see that, on the extensive margin, systematic patient selection
only exists for gastroenterologists and allergists where the absolute and relative price differences
are the largest. By contrast, we do not find evidence for systematic patient selection for
otorhinolaryngologist (hearing tests), where reimbursement rates are much lower and the
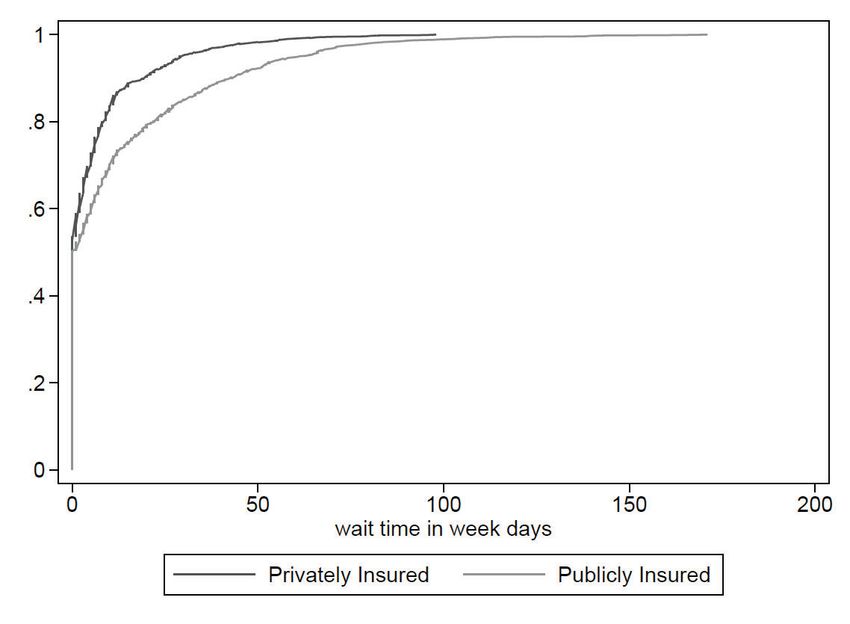
17
Figure A3 in the Appendix shows the cumulative density functions (cdf) of wait time in weekdays for all successfully
contacted practices that offered an appointment under both insurance types (i.e. Sample B). The cdf of privately
insured patients dominates the cdf of publicly insured patients over the entire region of support.
21absolute and relative price differences much smaller (€16 vs. 23). Reassuringly, the same pattern
also holds for dayswait—although we also find significant wait time differences for hearing tests,
they are much smaller than for allergy tests and gastroscopies.
Parametric Findings
Next, we move on to our parametric findings and multivariate regression models. Table 2
shows the findings from our first model in equation (1), which uses the binary apptm measure as
outcome variable. These models assess the impact of the insurance status on the likelihood to
be offered an appointment for non-urgent treatments. Each column in Table 2 represents one
model. The models only differ by the inclusion of different sets of covariates as indicated in the
bottom panel of the Table.
[Table 2 about here]
Table 2 shows the following: First, we find that the insurance status of the caller has a
highly significant impact on the willingness to schedule an appointment. Two coefficient
estimates are significant at the 1% level, and two are significant at the 5% level. Being privately
insured increases the likelihood of an appointment by 4.4 to 6.2 percentage points or by about
7% relative to the mean of 0.85. Second, the estimates are robust across all model specifications
and far from statistically different from one another. The inclusion of week-of-year fixed effects,
county fixed effects, and even practice fixed effects barely alter the size of the coefficients. Third,
the findings are also robust to running probit models and calculating marginal effects (available
upon request).
Table 3 follows the same setup as Table 2 but estimates our second model and equation
(2). It is basically identical to equation (1), but uses the second continuous outcome variables
dayswait, which counts the wait times in weekdays. The coefficient estimates then indicate the
22impact of being privately insured on the mean wait time in weekdays, relative to being publicly
insured.18 In the Appendix, in Table A3, we replicate Table 3 but do not take the logarithm of the
dependent variable. All six models in Table 3 and Table A3 use our balanced Sample B and only
include the 502 unique practices that offered specific appointments to both callers, the publicly
and the privately insured.
[Table 3 about here]
Table 3 and Table A3 show the following: All six model coefficients are highly significant
at the 1% level. Moreover, the estimates are very robust to the sets of covariates included,
reinforcing that our randomization was very successful. It also implies the absence of structural
differences in terms of the week-of-the-year or the county of residence. Moreover, because the
differences are very close to the differences of simple t-tests, it also suggests the absence of
structural imbalances by day-of-the-week or the time of the day when the call was made.
The results show that privately insured patients wait on average 13 fewer weekdays for
an appointment, conditional on being offered one. In other words, publicly insured patients have
to wait more than twice as long for an appointment; the mean wait time for the publicly insured
is 24.9 weekdays (or about 5 weeks on average), whereas the mean wait time for privately
insured patients is only 11.6 weekdays (or a little more than 2 weeks on average).
Table A4 shows regressions for apptm and dayswait but separately for the three specialist
groups. The estimates in Panel A (apptm) all have the expected sign but are statistically not
18
Note that the models in Table 3 use the logarithm of the wait time in weekdays as dependent variable. For
example, in our preferred model in column (4), the difference in wait times in percent would be exp(-1.1381)-1=
-0.6796 or about -68%. In contrast, Figure 4 shows the unconditional mean differences which are 24.89 vs. 11.57
days wait time or a (13.32/24.89)*100= 54% difference. See Section 6 for a discussion of the randomization process
and why the regression models control for seasonal, regional and other covariates.
23significant plausibly due to the smaller sample size. The estimates in Panel B (dayswait) are very
similar to the main analysis and statistically significant for each specialty. In terms of effect size,
although we do find significant waiting time differences for hearing tests, they are smaller than
the effect sizes for allergy tests and gastroendoscopies. This finding is in line with the smaller
reimbursement rate differences between PHI and SHI for hearing tests (also see discussion
below).
Next, we test for heterogeneity in inequality in health care access. Technically, we interact
our variable of interest Privately Insured with one of the following stratifying county-level
covariates: Physician density, population density, household income, East Germany, share of
privately insured in state. Then we add the interaction term along with the two variables in levels
to the models in equations (1) and (2). Panel A of Table 4 shows the results for apptm and Panel
B of Table 4 shows the results for dayswait.
[Table 4 about here]
As seen, few of the interaction terms (which indicate differences in insurance status by
the stratifying covariate) are statistically significant. The findings for East Germany are relatively
large and the sign of the effects consistent with the notion that the differences in East Germany
are smaller than in West Germany. However, the two interaction terms in column (4) of Table 4
are only significant at the 20% level and rather suggestive. Second, the findings for physician
density (column 1), household income (column 3) and share of PHI-patients (column 5) are all far
from being significant in both panels. Finally, the finding in column (2) of Panel B suggests that a
higher population density, e.g. in cities as compared to more rural counties, is associated with
more discrimination and inequality in access.
24In summary, we find that inequality in wait times is larger when the population density in
the county is larger. We also find suggestive evidence that inequality in access is less pronounced
in East as compared to West Germany, possibly indicating a long-term effect of socialist norms
(Alesina and Fuchs-Schündeln 2007; Rainer and Siedler 2009). For example, in a recent survey,
PWC (2017) finds that a 10 percentage point higher share of West as compared to East Germans
have a positive attitude towards more competition in the health care sector (59% vs. 49%).
Discussion
Our field experiment has clearly established that privately insured patients (i) are offered
appointments at significantly higher rates and (ii) are offered appointments with shorter wait
times, compared to publicly insured patients with lower reimbursement rates. This holds in the
German context with its two-tier health care system where reimbursement rates structurally vary
between the two systems but are otherwise identical across plans within each system.
As we randomized the insurance status of the fictional patient in our study, our “cream-
skimming” interpretation of the findings allows for several specific mechanisms. To be specific,
while it is well-known—particularly among medical professionals—that private insurers pay
much higher rates, it is also true that the privately insured have higher incomes, are better
educated and are healthier, see Table A1 (Appendix). However, we believe that all specific
explanations can ultimately be subsumed as: practices structurally select more profitable
patients.19
19
Note that, in Germany, no official quotas or rules for how to provide appointments for publicly and privately
patients exist. Essentially, absent emergency cases, private practices determine how they schedule appointments.
Unlike in the U.S., e.g. for Medicaid patients, 90% of the population are publicly insured and not seen as charity
cases. Rather, lots of anecdotal evidence suggests that the privately insured are regarded as particularly profitable
and thus offered faster appointments and longer time slots during appointments (Soester Anzeiger 2019).
25First, doctors may expect to not only receive a significantly higher reimbursement from
the privately insured but also deal with healthier patients who have fewer co-morbidities. Given
a specific diagnosis, healthier patients imply shorter treatments and interactions and more
profitable patients, especially when payments are bundled. (A counterargument is that
comorbidities and the health status are less relevant for highly standardized treatments like
hearing tests, allergy tests or gastroscopies.)
Second, one could hypothesize that doctors prefer better educated patients because of
the patient’s education itself. Some studies have shown that doctors prefer patients with a good
job or high socioeconomic status (Olah et al. 2013; Angerer et al. 2019). We would argue,
however, that a high socio-economic status is a proxy for more profitable, wealthy patients (and
not vice versa). Moreover, there is evidence that doctors consider highly-educated,
“empowered” patients as rather annoying, time-consuming and difficult (Neuberger 2000;
Rankin 2011).
Third, in Germany, the privately insured have, without any doubt, higher incomes (Table
A2) and their reimbursement is 100% fee-for-service (Section 3). Hence, it may not just be the
very narrowly defined one-time reimbursement rate differential in Table A2, but a broader
definition of profitability that makes doctors cream-skim the privately insured. For example,
doctors may schedule profitable follow-up visits or sell additional, medically unnecessary and not
covered services to the more affluent privately insured. On the other hand, public insurance plans
have basically zero cost-sharing and public insurers also directly pay providers without intensive
claim reviews.20 Private insurers usually share costs, review claims, and do not pay providers
20
In Germany, the review of SHI-claims is mainly the physician associations’ task (see § 106d of the social code book
V (SGB V)). In practice, these reviews are probably less strict for the publicly insured than for private patients where
PHI directly reviews claims and have a strong(er) incentive to deny reimbursement. E.g. the German Health Expert
26You can also read