A cross-sectional study of owner-reported health in Canadian and American cats fed meat- and plant-based diets
←
→
Page content transcription
If your browser does not render page correctly, please read the page content below
Dodd et al. BMC Veterinary Research     (2021) 17:53
https://doi.org/10.1186/s12917-021-02754-8

 RESEARCH ARTICLE                                                                                                                                    Open Access

A cross-sectional study of owner-reported
health in Canadian and American cats fed
meat- and plant-based diets
Sarah A. S. Dodd1,2, Cate Dewey1, Deep Khosa1 and Adronie Verbrugghe2*

  Abstract
  Background: Cats, being obligate carnivores, have unique dietary requirements for nutrients most commonly
  found in dietary ingredients of animal origin. As such, feeding a diet devoid of animal-derived ingredients has been
  postulated as a possible cause of nutrient imbalances and adverse health outcomes. A small proportion of cat
  owners feed strictly plant-based diets to the cats in their care, yet the health and wellness of cats fed these diets
  has not been well documented.
  Results: A total of 1325 questionnaires were complete enough for inclusion. The only exclusion criterion was failure
  to answer all questions. Most cats, 65% (667/1026), represented in the survey were fed a meat-based diet and
  18.2% (187/1026) were fed a plant-based diet, with the rest fed either a combination of plant-based with meat-
  based (69/1026, 6.7%) or indeterminable (103/1026, 10%). Cat age ranged from 4 months to 23 years, with a median
  of 7 years, and was not associated with diet type. No differences in reported lifespan were detected between diet
  types. Fewer cats fed plant-based diets reported to have gastrointestinal and hepatic disorders. Cats fed plant-based
  diets were reported to have more ideal body condition scores than cats fed a meat-based diet. More owners of
  cats fed plant-based diets reported their cat to be in very good health.
  Conclusions: Cat owner perception of the health and wellness of cats does not appear to be adversely affected by
  being fed a plant-based diet. Contrary to expectations, owners perceived no body system or disorder to be at
  particular risk when feeding a plant-based diet to cats. This study collected information from cat owners and is
  subject to bias, as well as methodological limitations. Further research is warranted to determine if these results are
  replicable in a prospective investigation.
  Keywords: Alternative pet diet, Feline nutrition, Health perception, Pet feeding practices, Pet owner survey, Vegan cat

Background                                                                              requirements [3, 4]. Briefly, in comparison to their om-
The domestic cat, Felis catus, is a small mammal of the                                 nivorous counterpart, the domestic dog, the cat’s re-
order Carnivora considered to be an obligate carnivore,                                 quirement for total protein is higher, and they require
based on their evolutionary anatomical, physiological                                   dietary provision of taurine, long-chain polyunsaturated
and metabolic adaptations to a diet exclusively com-                                    fatty acids and vitamin A [1, 5–8]. Protein content and
prised of prey [1, 2]. As a consequence, cats have unique                               quality, in terms of amino acid digestibility, bioavailabil-
nutritional adaptations resulting in particular dietary                                 ity and balance, is typically higher in animal-derived as
                                                                                        opposed to plant-derived ingredients [9]. Moreover,
* Correspondence: averbrug@uoguelph.ca                                                  taurine, arachidonic acid, eicosapentaenoic acid (EPA),
2
 Department of Clinical Studies, Ontario Veterinary College, University of
Guelph, 50 Stone Rd. E, Guelph, Ontario N1G 2W1, Canada
                                                                                        docosahexaenoic acid (DHA), and vitamin A are predom-
Full list of author information is available at the end of the article                  inantly or exclusively found in animal tissues [10, 11].
                                         © The Author(s). 2021 Open Access This article is licensed under a Creative Commons Attribution 4.0 International License,
                                         which permits use, sharing, adaptation, distribution and reproduction in any medium or format, as long as you give
                                         appropriate credit to the original author(s) and the source, provide a link to the Creative Commons licence, and indicate if
                                         changes were made. The images or other third party material in this article are included in the article's Creative Commons
                                         licence, unless indicated otherwise in a credit line to the material. If material is not included in the article's Creative Commons
                                         licence and your intended use is not permitted by statutory regulation or exceeds the permitted use, you will need to obtain
                                         permission directly from the copyright holder. To view a copy of this licence, visit http://creativecommons.org/licenses/by/4.0/.
                                         The Creative Commons Public Domain Dedication waiver (http://creativecommons.org/publicdomain/zero/1.0/) applies to the
                                         data made available in this article, unless otherwise stated in a credit line to the data.
Dodd et al. BMC Veterinary Research   (2021) 17:53                                                           Page 2 of 16

Nevertheless, plant-based [PB] diets (diets entirely devoid    number of responses for each question varied as a result
of animal-derived ingredients, aka vegan diets) exist com-     of non-responses to individual questions. Demographic
mercially and are marketed for feeding to domestic cats.       data of respondents are shown in Supplementary Table
  Associations between nutrition and health are known          S1. Post-hoc power calculations confirmed the sample
regarding domestic cats. Not only do cats require a diet       size was adequate to attain statistical significance for
providing balanced nutrition in order to avoid adverse         comparison of the number of health disorders, specific
health outcomes, certain disease states are also known         health disorders (GI and hepatic) and lifespan between
to be associated with imbalances or inappropriate              cats fed PB and MB diets.
provision of particular nutrients [12–16]. Considering            The proportion of respondents keeping cat(s) only
this, the type of diet a cat is fed may influence their day-   (653/1325 49%) did not differ from those keeping dog(s)
to-day health, disease status, and even their longevity. As    and cat(s) (672/1325, 51%). The median number of cats
obligate carnivores, it has long been considered that cats     kept per respondent was two (range 1–18). Most cats
require a diet that contains animal-derived ingredients        were acquired from shelters, rescues or veterinarians
to provide the essential nutrients they require, and the       (664/1241, 54%), followed by tamed stray, feral or found
implications of feeding PB diets to cats are yet to be well    cats (214/1241, 17%) or inherited or gifted from friends
described. However, nearly 1% of all cat owners, and           and family (167/1241, 13%). Less commonly, cats were
10% of vegan cat owners, choose to feed an entirely PB         purchased online (64/1241, 5.2%), from backyard
diet to their cat [17].                                        breeders, farms, or homebred (59/1241, 4.8%), from reg-
  Previous publications regarding feeding of PB diets to       istered breeders (44/1241, 3.5%) or from pet stores (29/
carnivorous cats have focused either on the content of         1241, 2.3%). Cats were acquired by respondents at kit-
some essential nutrients in PB cat food or on measure-         tenhood (645/1241, 55%) or later in their life (538/1241,
ment of some indicators of nutrient status in the blood        45%). Cats had been kept by the respondents for less
of cats fed PB diets for at least 1 year [18–21]. Results      than 1 to 25 years (mean 6.0 years, std. dev. 4.85).
from these studies have varied, with dietary nutrient in-
sufficiencies documented [18, 19, 21], but no adverse
health or nutritional outcomes detected [20, 21]. Never-       Cat characteristics
theless, it has been suggested that feeding PB diets to        Cat characteristics are shown in Table 1, grouped by
cats may predispose them to health disorders, including        diet type. There was a significant association between
lower urinary tract diseases [21, 22]. Other studies have      diet and breed type, with more MB cats being domes-
investigated the motivations and attitudes of cat owners       tic longhairs (66/656, 10% MB; 8/182, 4.4% PB), while
towards feeding their cat, finding that meat-abstainers        more PB cats were mix breeds (58/656, 8.8% MB; 29/
were the only ones who fed their cats PB diets, and that       182, 16% PB), or their breed unknown (46/656, 7.0%
their impetus to do so was based largely on ethics or          MB; 25/182, 14% PB) (P = 0.004). No significant dif-
morality [17, 20, 23]. Currently, only one study investi-      ferences in breed types were detected between PB+
gating owner perception of health in cats fed PB has           MB and PB or MB. Mean cat age was reported to be
been published [20]. The objective of this study was to        7.5 years (std. dev. 4.85). There was no association be-
survey a wide sample of cat owners in order to describe        tween cat age and diet. Most cats lived indoors only
beliefs and practices regarding cat health and nutrition       (749/1246, 60%), many had unlimited outdoor access
and compare between owners of cats fed PB or meat-             (373/1246, 30%), some had limited or controlled out-
based [MB] diets. It was hypothesized that resources           door access (113/1246, 9.1%), and few lived outdoors
used for feline nutrition and factors influencing dietary      exclusively (11/1246, 0.88%). The majority of respon-
decisions would differ between owners feeding cats PB          dents indicated that their cats did not hunt prey
or MB diets and that there would be a higher prevalence        (949/1241, 76%). Some respondents recognized that
of health disorders among cats fed PB diets. In particu-       their cats could hunt but they did not believe that
lar, it was hypothesized that more cats fed PB diets           they did so (91/1241, 7.3%) and less than a quarter
would be reported to have lower urinary tract disorders        acknowledged that their cat did hunt prey (201/1241,
as compared to cats fed MB diets.                              16%). Though there was no association between ac-
                                                               cess to the outdoors and diet, significantly (P =
Results                                                        0.005) more PB cats were reported to not to hunt
Response rate and demographic information                      (129/186, 69%) or to have the ability to hunt but not
A total of 1325 questionnaires were voluntarily under-         do so (23/186, 12%). Of the cats fed a PB diet, 35%
taken and included for analysis, responses were excluded       (65/187) were reported unlimited access to the out-
if they failed to answer all questions in the questionnaire.   doors, suggesting their diet could be supplemented
Partially completed surveys were included, thus the            with hunted prey to some degree (PB+MB/H).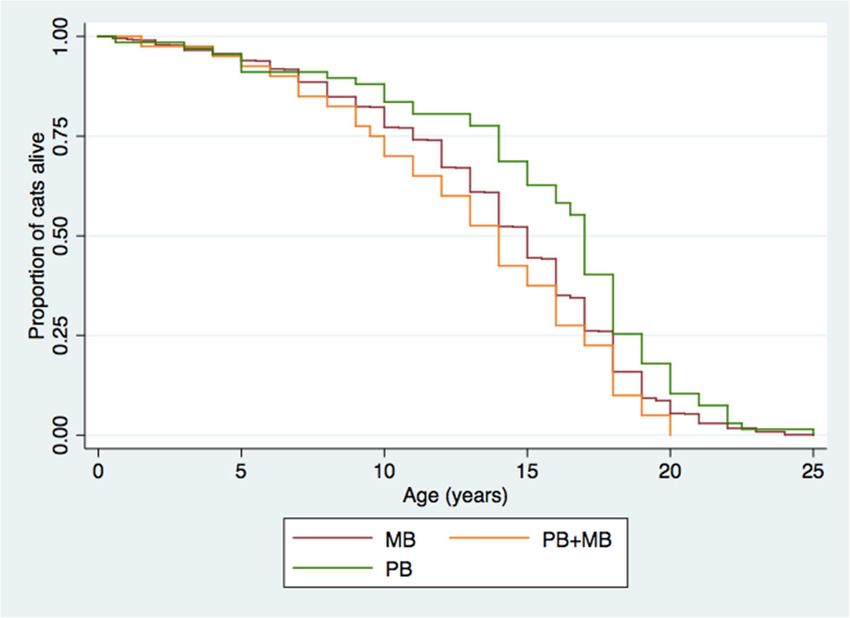
Dodd et al. BMC Veterinary Research           (2021) 17:53                                                                      Page 3 of 16

Table 1 Characteristics of cats as reported by participants in the                 Cats had been reportedly fed their current diet their
“Pet Health and Wellbeing” survey                                                whole life (534/1034 52%) or had changed from at least
                          MB (n = 667) PB (n = 187) PB+MB (n = 69)               one previous diet to their current diet (500/1034, 48%).
Sex                                                                              Cats had been fed their current diet for a mean of 3.8
  Male (n = 611)          321 (48%)        94 (50%)         34 (49%)             years (std. dev. 3.95). There was no difference in dur-
                                                                                 ation of feeding the current diet between cats fed MB
  Female (n = 653)        342 (51%)        93 (50%)         35 (51%)
                                                                                 (mean 3.6 years, std. dev. 3.69) PB (mean 3.6 years std.
Sex status
                                                                                 dev. 4.38) or PB+MB (mean 3.0, std. dev. 3.27) diets.
  Intact (n = 41)         17 (3%)          10 (5%)          3 (4%)               Less than half of cats received treats (386/1026, 38%) or
  Desexed (n = 1223) 646 (97%)             177 (95%)        66 (96%)             table scraps (220/1026, 21%) in addition to their main
Breed type                                                                       diet. More cats fed MB (308/667, 46%) than PB (29/187,
  DSH (n = 660)           362 (54%)        93 (50%)         36 (52%)             16%) or PB+MB (16/69, 23%) received treats (P < 0.001),
                                                                                 though more cats fed PB (63/187, 34%) than MB (128/
  DMH (n = 60)            35 (5%)          6 (3%)           5 (7%)
                                                                                 667, 19%) received table foods (P < 0.001). No significant
  DLH (n = 95)            66 (10%)         8 (4%)           1 (1%)
                                                                                 differences in feeding of table foods were detected be-
  Asian (n = 50)          32 (5%)          8 (4%)           2 (3%)               tween PB+MB and PB or MB. Significant differences in
  American (n = 35)       21 (3%)          4 (2%)           1 (1%)               the feeding of table foods was evident between PB and
  European (n = 58)       34 (5%)          8 (4%)           2 (3%)               MB cats (P < 0.001). The most common table foods fed
  Other (n = 9)           2 (0%)           1 (0%)           0 (0%)               to MB cats were meat (66/667, 9.9%), dairy or eggs (64/
                                                                                 667, 9.6%) and fruits or vegetables (20/667, 3.0%). The
  Mix (n = 134)           58 (9%)          29 (16%)         9 (13%)
                                                                                 most common table foods fed to PB cats were fruits or
  Unknown (n = 131) 46 (7%)                25 (14%)         11 (16%)
                                                                                 vegetables (34/187, 18%), nuts, seeds, legumes or grains
Age (years)                                                                      (21/187, 11%), and plant-based meat alternatives (16/
  Less than 1             29 (4%)          7 (4%)           3 (4%)               187, 8.6%). Cats fed PB+MB were most commonly of-
  1–2                     92 (14%)         28 (15%)         6 (9%)               fered dairy or eggs (10/69, 14%), fruits or vegetables (7/
  3–4                     105 (16%)        24 (13%)         6 (9%)               69, 10%), or meat (5/69, 7.3%). Supplements were fed to
                                                                                 less than a quarter of cats (n = 193/1026, 19%), more so
  5–6                     83 (12%)         34 (18%)         14 (20%)
                                                                                 to those fed PB (75/187, 40%) than PB+MB (17/69, 24%)
  7–8                     90 (13%)         24 (13%)         6 (9%)
                                                                                 or MB (91/667, 14%) (P < 0.001). Not only were the
  9–10                    65 (10%)         19 (10%)         12 (17%)             number of cats offered supplements different between
  11–12                   61 (9%)          21 (11%)         5 (7%)               diet groups, but also the types of supplements given.
  13–14                   41 (6%)          18 (10%)         5 (7%)               Overall, ‘functional foods’ such as cranberry powder,
  15–16                   40 (6%)          6 (3%)           6 (9%)               coconut oil and yeast were the most common supple-
                                                                                 ments offered (77/923, 8.3%), followed by fibre, pre- or
  17–18                   16 (2%)          6 (3%)           2 (3%)
                                                                                 probiotics (38/923, 4.1%) and vitamins and/or minerals
  19–20                   9 (1%)           2 (1%)           0 (0%)
                                                                                 (36/923, 3.9%). Cats fed PB were given more ‘functional
  Greater than 20         1 (0%)           0 (0%)           0 (0%)               foods’ (55/187, 29%), supplements marketed for specific
Numbers of cats per category may not add up to total due to non-responders       disorders (14/187, 7.5%), and digestive enzymes (8/187,
and indeterminable diet type. Thirty-four specific breeds were reported,
including: Abyssinian, American bobtail, Balinese, Bengal, Birman, Bombay,       4.3%), than cats fed PB+MB (functional foods 6/69,
British shorthair, Burmese, Chantilly, Chartruex, Chaussie, domestic shorthair   8.7%; specific disorders 2/69, 2.9%; enzymes (0/69, 0%)
(DSH), domestic medium hair (DMH), domestic longhair (DLH), Havana brown,
Himalayan, Korat, Maine coon, Manx, Norwegian forest cat, Oriental, Persian,
                                                                                 or MB (functional foods 16/667, 2.4%; specific disorders
Ragdoll, Rex, Russian blue, Siamese, Siberian, Snowshoe, Somali, Sphynx,         19/667, 3.9%; enzymes 9/667, 1.4%). There were no dif-
Tonkinese, Toyger, Turkish angora, Turkish van                                   ferences between diet groups and the feeding of marine
                                                                                 derived fatty acids, multivitamin/minerals, fibre or pre/
Cat diet                                                                         probiotics, amino acids, cannabis products, or herbs.
Diet was described by 1026/1325 respondents. Most cats
were fed a MB diet (667/1026, 65%), less than a quarter                          Cat health and wellness
were fed strictly PB (187/1026, 18%), and a small pro-                           Cat BCS ranged from 1 to 9. Most cats were reported to
portion were fed a combination of PB and MB (PB+MB,                              be in ideal condition (677/1233, 55%), and more cats
69/1026, 6.7%). Diet type was indeterminable for 10%                             were overweight (405/1233, 33%) than underweight
(103/1026) of cats. For cat health and wellness compara-                         (151/1233, 12%); median BCS was 5. Cat BCS differed
tive analyses, cats that were fed PB but had access to the                       significantly between cats fed PB and MB (P = 0.13).
outdoors and ability to hunt were re-classified as PB+                           More owners of cats fed strictly plant-based reported
MB/H (139/1026, 14%).                                                            their cat to have an ideal BCS (83/117, 71%) and fewer
Dodd et al. BMC Veterinary Research (2021) 17:53 Page 4 of 16
reported overweight (23/117, 20%), as compared to cats only with dental, GI and hepatic, and ocular disorders.
fed MB (358/666, 54% ideal; 226/666, 34% overweight). Age was associated with most health disorders.
No difference was detected for PB+MB/H compared to Respondents’ perception of their cat’s health, from
PB (P = 0.196) or MB (P = 0.635). poor to very good, was predominantly very good (813/
Based on FS, most cats were reported to have normal 1206, 67%). Few respondents indicated their cat was in
faeces (920/1047, 88%), few were constipated (33/1047, fair (47/1206, 3.9%) or poor (11/1206, 0.91%) health. An
3.2%) or had soft to diarrhoeic faeces (94/1047, 9.0%); ordered logistic regression model was designed to deter-
median FS was 2 (range 1–7) on a 1–7 scale, with 3–4 mine if owner perception of cat health was associated
being ideal, 1 being constipation and 7 being diarrhoea. with diet. Increasing cat age (Odds Ratio [OR] 0.84, 95%
There were no significant differences in FS between cats CI 0.808–0.863, P < 0.001) and male sex (OR 0.71, 95%
fed MB, PB or PB+MB/H diets. CI 0.523–0.976, P = 0.035) were associated with lower
Health disorders were reported by the respondent and odds of ranking cat health as very good. Conversely, a
categorized by body system or systemic disorders as ap- BCS of 5 (OR 7.72, 95% CI 2.67–22.29, P < 0.01) or 7
propriate. The number of health disorders reported per (OR 4.55, 95% CI 1.552–13.337, P = 0.006) as compared
cat ranged from 0 to 6 (median 0), and half of all cats to 1, and feeding a PB (OR 1.99, 95% CI 1.194–3.329, P
(628/1208, 52%) were reported to have no health disor- = 0.008) or PB+MB/H (OR 2.19, 95% CI 1.360–3.511, P
ders. Prevalence of the most commonly reported health = 0.001), as compared to MB, were associated with
disorders are shown in Table 2. A negative binomial greater odds of ranking cat health to be very good, after
model was designed to determine if the number of controlling for cat demographics. Respondents also
health disorders a cat had was associated with diet. With ranked their cat’s wellness based on seven Likert scale
cat age and sex included in the model, the number of items (Table 4), and eight visual scales ranging from 0
disorders per cat differed significantly based on diet, (lowest) to 100 (highest) (Figs. 1 and 2).
after controlling for demographic and lifestyle variables. Lifespan was indicated when respondents were asked
Cat age (Coef. 0.09, 95% CI 0.070–0.100, P < 0.001) about previous cats. Mean lifespan was reported to be
and male sex (Coef. 0.16, 95% CI 0.004–0.308, P = 14 years (std. dev. 4.88). Previous cats were fed MB (841/
0.044) were associated with increased number of disor- 1161, 72%), PB (77/1161, 6.6%), a combination of MB
ders, while PB (Coef. -0.40, 95% CI -0.641 – 0.155, P = and PB (41/1161, 3.5%) or indeterminable (258/1161,
0.001) and PB+MB/H (Coef. -0.33, 95% CI -0.589 - 22%). There was no significant difference in reported
-0.075, P = 0.011), as compared to MB, were associated lifespan based on diet detected by log rank test (Fig. 3).
with fewer disorders. The relationships between diet and
individual health disorders were investigated using logis- Diet changes
tic regression models, results are shown in Table 3. Owners typically fed their current cat the same type of
Overall, after controlling for age, sex, breed type, and diet (i.e. PB or MB) as they fed their previous cat(s). Of
body conditions score, diet was significantly associated the owners who fed their previous cat(s) a PB diet, only
Table 2 Prevalence of feline health disorders as reported by participants in the “Pet Health and Wellbeing” survey, with comparison
between cats fed different diets
Health disorder Total MB PB PB+MB/H
n = 1208 % n = 667 % n = 117 % n = 139 %
Cardiac disease 26 2.2 17 2.6 2 1.7 20 0
Dental disease 208 17 131 20 21 18 16 11.5
Dermatopathy 137 11 82 12 12 10.3 13 9.4
Endocrinopathy 38 3.2 24 3.6 3 2.6 3 2.2
GI and hepatic diseases 126 10 90 13 3 2.6 11 7.9
Lower urinary tract disease 132 11 74 11 13 11 12 13
Neoplasia 21 1.7 10 1.5 2 1.7 4 2.9
Neurological 19 1.6 15 2.3 3 2.6 0 0
Obesity 100 8 64 9.6 7 6.0 9 6.5
Ocular disorders 57 5 39 5.9 4 3.4 1 0.7
Renal disease 42 3 31 4.7 1 0.9 2 1.4
MB meat-based, PB plant-based, PB+MB/H plant-based with animal-derived treats/snacks/supplements and/or ability to hunt
Numbers of cats per category may not add up to total due to non-responders and indeterminable diet type. No statistically significant differences were detectedDodd et al. BMC Veterinary Research (2021) 17:53 Page 5 of 16
Table 3 Results from multivariable logistic regression models of associations between reporting of health disorders and cat diet
type, with confounders (age, breed type, sex, body condition score) controlled for
Health Disorder Variable Odds Ratio 95% CI P-value
Cardiac Age 1.15 1.045–1.258 0.004
Breed type, DLH 3.58 1.006–12.700 0.003
Diet, PB 0.69 0.152–3.162 0.636
Diet, PB+MB/H –
Dental Age 1.11 1.070–1.152 < 0.001
Diet, PB 0.84 0.495–1.434 0.528
Diet, PB+MB/H 0.51 0.287–0.891 0.018
Dermatological Age 1.08 1.038–1.129 < 0.001
Diet, PB 0.79 0.415–1.512 0.480
Diet, PB+MB/H 0.64 0.337 0 1.215 0.172
Endocrine Age 1.37 1.234–1.519 < 0.001
BCS, 3 0.13 0.030–0.561 < 0.001
BCS, 5 0.07 0.018–0.272 < 0.001
BCS, 7 0.07 0.015–0.315 0.001
BCS, 9 0.05 0.008–0.359 0.003
Diet, PB 0.57 0.156–2.113 0.248
Diet, PB+MB/H 0.47 0.131–0.356 0.404
GI and hepatic Age 1.09 1.049–1.140 < 0.001
Diet, PB 0.16 0.051–0.530 0.003
Diet, PB+MB/H 0.53 0.273–1.028 0.060
Lower urinary tract Age 1.10 1.057–1.152 < 0.001
Sex, male 2.88 1.836–4.518 < 0.001
Diet, PB 0.96 0.508–1.827 0.908
Diet, PB+MB/H 1.20 0.678–2.127 0.534
Neoplasia Age 1.32 1.180–1.487 < 0.001
Diet, PB 1.10 0.228–5.305 0.907
Diet, PB+MB/H 1.83 0.543–6.194 0.329
Neurological Diet, PB 1.14 0.326–4.014 0.834
Diet, PB+MB/H –
Obesity BCS, 9 8.50 1.064–67.940 0.041
Diet, PB 0.84 0.360–1.977 0.695
Diet, PB+MB/H 0.74 0.347–1.582 0.438
Ocular Breed type, mix 3.66 1.609–8.321 0.003
Diet, PB 0.64 0.218–1.849 0.406
Diet, PB+MB/H 0.11 0.015–0.923 0.027
Renal Age 1.30 1.196–1.411 < 0.001
Diet, PB 0.16 0.021–1.250 0.081
Diet, PB+MB/H 0.27 0.061–1.168 0.080
Referent categories: Breed type = domestic shorthair, Diet = meat-based, BCS = 1, sex = female
DLH domestic longhair, PB plant-based, PB+MB/H plant-based with animal-derived treats/snacks/supplements and/or ability to hunt, BCS body condition score.
Odds ratios for categories with insufficient numbers could not be computed (−)
4.0% (2/50) added some animal products and 2.0% (1/ continued to feed PB+MB diet (10/25, 40%), while rela-
50) changed to a MB diet for their current cat. Of the tively even proportions changed to a completely PB (6/
owners who fed a PB+MB to their previous cat(s), most 25, 24%) or MB (8/25, 32%) diet for their current cat. OfDodd et al. BMC Veterinary Research (2021) 17:53 Page 6 of 16
Table 4 Responses to seven Likert scale questions asking respondents to rank indices of cat wellness, with comparison between
cats fed different diets
Wellness Indicator Total MB PB+MB/H PB
n = 1025 % n = 665 % n = 138 % n = 117 %
Frequency of vomiting Not at all 629 61 395 59 100 72 76 65
A little 369 36 256 39 37 27 38 32
Quite a bit 24 2.3 14 2.1 1 0.7 3 2.6
Frequency of inactivity Not at all 783 76 492 74 115 83 103 88
A little 208 20 147 22 19 14 13 11
Quite a bit 34 3.3 28 4.2 4 2.9 1 0.9
Happy appearance Not at all 3 0.3 1 0.2 0 0 1 0.9
A little 31 3.0 23 3.5 1 0.7 3 2.6
A moderate amount 316 31 206 31 39 28 34 29
A great deal 675 66 437 66 98 71 79 68
Distress vocalization Not at all 826 81 530 80 112 82 99 85
A little 174 17 119 18 22 16 17 15
A moderate amount 19 1.9 14 2.1 2 1.5 1 0.9
A great deal 4 0.4 3 0.5 1 0.7 0 0
Demonstration of affection Not at all 7 0.7 6 0.9 0 0 0 0
A little 54 5.3 26 3.9 6 4.4 8 6.8
A moderate amount 309 30 217 33 38 28 24 21
A great deal 654 64 417 63 94 68 85 73
Contact avoidance Not at all 735 72 762 70 114 82 92 79
A little 236 23 170 26 18 13 23 20
A moderate amount 43 4.2 28 4.2 5 3.6 1 0.9
A great deal 7 0.7 4 0.6 1 0.7 1 0.9
Curious behaviour Not at all 10 1.0 8 1.2 2 1.5 0 0
A little 94 9.2 64 9.6 8 5.9 7 6.0
A moderate amount 417 41 268 40 58 42 52 44
A great deal 502 49 326 49 69 50 58 50
MB meat-based, PB plant-based, PB+MB/H plant-based with animal-derived treats/snacks/supplements and/or ability to hunt
the owners who previously fed their cat(s) a MB diet, the = 0.002), and for a diet to contain animal ingredients
majority of owners continued to feed this diet type to high on the list of ingredients (0/187, 0% PB; 0/69, 0%
their current cat (514/637, 81%), though more changed PB+MB; 30/667, 4.5% MB; P = 0.008). More owners
to an entirely PB diet (73/637, 11%) than a PB+MB (31/ feeding their cats a PB diet were wanted to see inclusion
637, 4.9%). of particular nutritional additives (e.g. specific vitamins)
(12/187, 6.4%) as compared to PB+MB (0/69, 0%) or MB
Diet selection (8/667, 1.2%) (P < 0.001). There were no differences be-
Cat food was predominantly chosen based on whether tween diet groups and the desire to avoid specific plant-
or not it was complete and balanced (775/1106, 70%). derived ingredients (e.g. corn, soy). Respondents indi-
Table 5 shows the most common criteria reported for cated the resource(s) they used for information about fe-
cat food selection. Of the 14% of owners (156/1106) who line nutrition. The common sources of information and
reported concern regarding specific ingredients in their significant differences between diet groups are shown in
cat’s diet, significant differences were found between Table 6. Veterinary professionals were the most com-
feeders of MB, PB and PB+MB diets. Owners feeding mon (707/1022, 64%), followed by internet and social
their cats MB most commonly reported a desire to avoid media (681/1022, 62%). Of the respondents who indi-
ingredients like by-products, grains, ‘fillers’ or additives cated using the internet as a resource for feline nutrition,
(4/187, 2.1% PB; 2/69, 2.9% PB+MB; 60/667, 9.0% MB; P over half (396/681, 58%), also used a veterinarian.Dodd et al. BMC Veterinary Research (2021) 17:53 Page 7 of 16 Fig. 1 Owner ranking of positive cat wellness indicators based on visual sliding scale ranging from 0 (lowest) to 100 (highest), with comparison between cats fed different diets. n = 1147. MB = meat-based, PB = plant-based, PB+MB/H = plant-based with animal-derived treats/snacks/ supplements and/or ability to hunt Fig. 2 Owner ranking of negative cat wellness indicators based on visual sliding scale ranging from 0 (lowest) to 100 (highest), with comparison between cats fed different diets. n = 1145. MB = meat-based, PB = plant-based, PB+MB/H = plant-based with animal-derived treats/snacks/ supplements and/or ability to hunt
Dodd et al. BMC Veterinary Research          (2021) 17:53                                                                                      Page 8 of 16

  Fig. 3 Kaplan Meier survival function of previous cats as reported by participants in the “Pet Health and Wellbeing” survey, with comparison
  between cats fed different diets. No statistically significant differences were detected by log-rank test, P = 0.192. MB = meat-based (n = 807), PB =
  plant-based (n = 67), PB+MB = plant-based with animal-derived treats/snacks/supplements (n = 40)

Discussion                                                                      methodology was not random, but invited cat owners to
Response rate and demographic information                                       self-select to participate in the study. This may have
Participants in this study typically represented the demo-                      biased the types of owners and cats represented by the
graphics of previously reported pet food and pet health                         study. The sampling included owners of both dogs and
survey respondents [17, 24, 25], supporting the likeli-                         cats, not just cats exclusively, though only responses re-
hood that the sampled population was consistent with                            lating to cats were included in these analyses. In the
other publications in the field. However, the sampling                          USA, almost half (47%) of cat owners also own dogs

Table 5 Factors influencing pet food purchasing as reported by participants in the “Pet Health and Wellbeing” survey, with
comparison between owners of cats fed different diets
Criteria                                 Total                          MB                             PB                             PB+MB
                                         n = 1025            %          n = 667            %           n = 187           %            n = 69           %
Complete and balanced                    775                 70         462                69a         151               81b          51               74a,b
Convenience                              321                 29         198                30          51                27           23               33
Human grade                              150                 14         84                 13a         39                21b          7                10a
Natural/organic/holistic                 327                 30         152                23a         95                51b          36               52b
                                                                                               a                               b
Palatability                             316                 29         218                33          47                25           16               23b
Price                                    314                 28         204                31a         42                22b          22               32a
Skin/coat/hairball health                272                 25         174                26          44                24           11               16
                                                                                               a                               b
Specific ingredients                     156                 14         115                17          21                11           4                5.8b
Stool quality                            133                 12         83                 12          25                13           8                12
                                                                                               a                           b
Therapeutic/vet recommended              186                 17         144                22          4                 2            7                10c
MB meat-based, PB plant-based, PB+MB plant-based with animal-derived treats/snacks/supplements
Superscript characters denote significant (P < 0.05) differences between the diet categories
Values may add up to > 100% since respondents could indicate that they selected pet food based on more than one criterion and numbers of cats per category
may not add up to total due to non-responders and indeterminable diet type
Dodd et al. BMC Veterinary Research (2021) 17:53 Page 9 of 16
Table 6 Resources used to acquire feline nutrition information as reported by participants in the “Pet Health and Wellbeing” survey,
with comparison between owners of cats fed different diets
Source of information Total MB PB PB+MB
n = 1022 % n = 665 % n = 187 % n = 69 %
Book, pamphlet or printed resource 174 16 95 14a 43 23b 16 23b
Breeder or shelter 20 2 17 2.6 1 0.5 0 0
a b
Discussion group 272 25 145 22 67 36 24 35b
a a
Friends and/or family 186 17 100 15 30 16 18 26b
Internet and social media 681 62 361 54a 164 88b 53 76c
Manufacturer 21 2 13 2.0 3 1.6 3 4.4
a b
Pet store or vendor 229 21 143 22 26 14 17 25a
School or courses 39 4 31 4.7 2 1.1 0 0
a b
Veterinary technician, clinician, specialist, student 707 64 465 70 87 47 38 55b
MB meat-based, PB plant-based, PB+MB plant-based with animal-derived treats/snacks/supplements
Superscript characters denote significant (P < 0.05) differences between the diet categories
Values may add up to > 100% since respondents could indicate that they sought information from more than one source and numbers of cats per category may
not add up to total due to non-responders and indeterminable diet type
[26], making the input of these owners as relevant as the PB reported their cat to be in very good, as opposed to
input of cat-exclusive owners. good, overall health. Additionally, owners of cats fed PB
diets reported fewer health disorders in their cats. In pre-
Cat characteristics vious evaluations of the health of cats fed PB diets, no ad-
Cat keeping characteristics, including number of cats, verse health outcomes attributable to diet were found, and
cat acquisition, and indoor/outdoor lifestyle, as well as most parameters measured were within the normal refer-
cat characteristics such as median age, breed, sex and ence range or above minimum thresholds [20, 21].
sex status, were similar to previous publications in Among veterinarians, animal nutritionists and veterin-
Canada, the USA and worldwide [27–29], supporting the ary nutritionists, it is generally considered contraindi-
likelihood that the sampled population was representa- cated to feed a strictly PB diet to cats [19, 30, 31].
tive of the general cat population in the regions of Considering this, it was predicted that feeding a strictly
interest. PB diet to cats may result in poorer health and/or well-
ness. However, this was not supported by the findings of
Cat diet, health and wellness this study. Owner perception of health and wellness, as
Despite their carnivorous physiology and metabolism, reported by participants in the study, were largely com-
approximately 1% of cat owners feed a PB diet to their parable between cats fed MB and PB diets (Table 4, Figs.
cat [17]. A previous study evaluated the attitudes of cat 1 and 2), and in some cases better for cats fed PB. PB di-
owners and compare between cats fed vegetarian and ets have also been effectively used as growth and main-
conventional MB diets [20]. In that study, over three tenance diets for other captive carnivores, including
quarters of owners feeding their cats a vegetarian diet American alligators and carnivorous fish [32–35], sug-
considered the diet to be beneficial for decreased risk of gesting that the maintenance of carnivorous cats using
cancer, healthy coat, longevity, weight control and/or re- PB diets may not be as novel or unconventional as is
duced risk of allergies, and just over 10 % considered commonly considered. It must be noted, however, that
there to be no benefit. When queried regarding the risks diets for animals intended for human consumption are
of vegetarian diets, over three quarters reported concern typically designed to maximize some component of pro-
for retinal atrophy, taurine deficiency, lower urinary tract duction and are not necessarily designed for optimal ani-
disease, protein deficiency, dilated cardiomyopathy, mal health or longevity. Nevertheless, longevity of cats,
while less than a quarter considered there to be no risk as reported by the study participants, did not vary be-
to health. In a recent investigation, though nearly two- tween cats fed PB or MB diets, and was comparable to
thirds of owners feeding their pet a PB diet reported the recognized lifespan of domestic cats [36].
concern for the diet providing incomplete nutrition, Specific concerns raised regarding PB diets for cats
though less than half reported a concern regarding risk have typically been for the total protein content in com-
to health [17]. This apparently positive perception of PB parison to feline requirements, risk of taurine deficiency
diets previously documented was supported by the find- and related disorders, and the carbohydrate content of
ings of the present study, where more owners of cats fed the diet and risk of obesity and diabetes. Though totalDodd et al. BMC Veterinary Research (2021) 17:53 Page 10 of 16 protein in commercial PB cat foods has been demon- levels are also commonly considered by pet owners and strated to be sufficient, the amino acid profiles may be veterinarians alike to be general indicators of health. variable. In one study, five of six diets intended for feed- Prevalence of health disorders in the overall study ing to cats failed to meet the recommended minimum population were comparable to the reported prevalence value for one or more amino acids [18]. In the two in general populations as determined from veterinary canned products, taurine was below the recommended visits [48, 49]. When total number of disorders was com- minimum. Thus, concern for taurine deficiency and pro- pared, significantly fewer were reported in cats fed PB tein malnutrition appears warranted. Nevertheless, to compared to MB diets. When comparing individual dis- the authors’ knowledge, no case reports of protein mal- orders, reporting of GI and hepatic disorders was lower nutrition or taurine deficiency in cats fed PB diets have in cats fed PB as opposed to MB diets. No disorders been published. Interestingly, despite the concern for were reportedly higher in cats fed PB. It is possible that amino acids, a common supplement in human PB nutri- PB diets confer some protection against these particular tion, few cats were offered protein or amino acid supple- disorders, namely renal disorder and GI and hepatic dis- mentation. Though three times as many cats fed PB orders; indeed this has been demonstrated in humans than MB received supplements in addition to their food, [50–53]. However, in humans the health benefits of a PB the supplements fed were most commonly ‘functional diet have primarily been with respect to obesity, dia- foods’ (30%), and those marketed for treatment or pre- betes, cardiac and neoplastic disorders [54–58], and, un- vention of specific health disorders (7.5%), neither of like in humans, no statistically significant differences which are likely to have contributed greatly to the nutri- were reported in the prevalence of these disorders in tional value of the cats’ diet. cats. Of interest, the reported prevalence of disorders ex- In addition to concerns for health disorders related to pected to be higher in cats fed PB diets, such as urinary inappropriate protein and amino acid provision, con- tract disease [22], did not differ between diet groups in cerns regarding the carbohydrate content of PB diets this study. At this time, to the authors’ knowledge, no have also been raised. Carbohydrates have been sug- cases of any adverse health outcome associated with PB gested by some to contribute to feline obesity [37, 38]. diets in cats have been published, though a lack of evi- The proportion of cats reported by the owner to be dence should not be interpreted as evidence of lack of overweight in this study was in close agreement with the risk. Nutrient deficiencies and imbalances may take proportion reported to be overweight by the largest many years to develop clinical signs, particularly in adult USA-based survey of pet owners [26]. Interestingly, BCS animals, and may go undetected. were reportedly more ideal and less overweight in cats fed PB than MB diets. The current body of evidence Diet changes points towards imbalanced energy intake versus expend- It is possible that upon diagnosis of a health disorder a iture as being the predominant cause of obesity, as op- cat’s diet is changed, most likely to a therapeutic diet. posed to intake of any single macronutrient, though fat, Considering no current therapeutic diets for cats are PB, being the most energy-dense and lipogenic nutrient, is it is possible that some cats diagnosed with a health dis- of more concern than carbohydrates as a predisposing order are changed from a PB to a MB diet, thus reducing factor for feline obesity [39–41]. For a recent review of the number of cats with health disorders in the PB cat- the role of carbohydrates in feline nutrition, see Ver- egory. Given the study design, this information was not brugghe and Hesta, 2017 [42]. It is possible that PB able to be discerned. Interestingly, when comparing the foods fed to cats may have lower dietary fat than MB di- diet of previous cats to current cats, few owners changed ets, and likely that the higher fibre levels in plant ingre- diet type, most continued to feed either PB or MB to dients versus meat ingredients may reduce energy current cats if that is what they fed their previous cat. density, help to regulate glucose tolerance and insulin Only a single owner who fed PB previously changed en- sensitivity, and thus be protective against obesity, as has tirely to a MB diet, while about 10% of owners who pre- been demonstrated in humans [43–46]. Similarly, viously fed MB changed entirely to a PB diet. though diets with high levels of carbohydrates have been Comparing diets of previous cats to current cats does postulated to contribute to faecal abnormalities in cats not give any indication as to whether the diet of the [42, 47], with high levels of digestible carbohydrates and current cat was changed in response to diagnosis of an soluble fibres potentially causing diarrhoea and high adverse health disorder, but the lack of dietary change levels of insoluble fibres potentially contributing to con- between cats may support a hypothesis that the incident stipation, no difference in FS was attributable to a PB of diet change from PB to MB may be low. Further re- compared with a MB diet. Body and faecal condition are search would be required to determine if this is indeed two health markers pet owners can easily keep track of the case. The present data only indicates that cat owners at home. Similarly, hair condition, behaviour and activity who fed PB to previous cats continue to feed PB to new
Dodd et al. BMC Veterinary Research   (2021) 17:53                                                             Page 11 of 16

cats, while a proportion who fed MB to previous cats           being a human grade food product, being marketed as
may adopt a PB diet for their new cat. This supports the       natural, organic or holistic, and had less concern for the
suspicion that this trend is likely actively growing at this   palatability of the diet or the presence or lack of specific
point in time, as has previously been hypothesized [17].       ingredients. While human grade, natural, organic or hol-
It is suspected that this may occur in conjunction with        istic products are not recognized by many practitioners
increasing proportions of people choosing to follow a          to be superior to their conventional counterparts, it is
vegan lifestyle for themselves, and not because of a per-      positive to note the increased awareness or concern of
ception of PB diets being healthier for cats. Previous re-     owners feeding PB regarding the labelling of a diet being
search has demonstrated that a lack of concern for risk        complete and balanced. While a statement of nutritional
of negative impact on health was a determining factor          adequacy in accordance with industry guidelines is not a
for vegans feeding a PB to their pet, though a perception      guarantee that the product is indeed appropriate for the
of improved health has not been reported [17]. This            animal for which it is intended to be fed [60, 61], it is a
warrants further investigation as to what health benefits      benchmark by which pet foods are compared and is a
may be perceived to be associated with PB diets for cats.      minimum standard to ensure nutritional sufficiency.

Diet selection                                                 Limitations
Of interest are the differences in the sources where cat       The findings presented in this study must be interpreted
owners sought information about feline nutrition and           with recognition of the inherent bias and limitation asso-
the criteria used to select a diet for their cat reported in   ciated with the methodology. The sampling strategy
the present study. Overall, veterinary professionals were      employed allowed for self-selection into the study which
equally represented with the internet and social media         likely introduces bias with respect to the nature of the
as being the resources used by the most cat owners,            participants. This sampling strategy was employed as the
which is in good agreement with previous reports [59].         intention was to collect a large number of responses
It is unclear if this referred to using a veterinary profes-   from broad sample of pet owners, representing the di-
sional as well as a separate internet resource, or whether     versity within the pet owning population and avoiding
this indicated the use of a virtual veterinary resource,       targeting of specific subsections only. It is likely, how-
such as a veterinary blog or clinic website. However,          ever, that pet owners with exceptional interest in pet
when comparing between owners of cats fed PB or MB,            health and wellness would be most likely to voluntarily
significantly fewer owners feeding PB considered their         participate in the study. This could affect the results in
veterinary team, instead relying much more heavily on          different ways. Firstly, pet owners with specific interest
the internet and social media, as well as discussion           in their pet’s health and wellness may be highly percep-
groups and books and printed resources to a lesser ex-         tive and aware of conditions affecting their pet, resulting
tent. This finding is not surprising, as it has been sug-      in their pet being presented to their veterinarian more
gested that pet owners feeding PB diets may not feel           often. This could either prevent health disorders by
comfortable discussing their feeding practice with their       implementing appropriate prevention strategies or result
veterinarian and may not view their veterinarian as an         in earlier diagnoses. These two potential outcomes
informed resource for discussing PB nutrition [17]. This       would have opposing effects on the number of health
may be an issue not specific to PB feeding practices, per      disorders reported as prevention would decrease the
se, but to practices considered unconventional or alter-       number of heath disorders occurring while timely diag-
native to the mainstream, as it has been reported that         nosis could increase the number of health disorders re-
feeders of raw MB diets also show a decreased trust in         ported. By collecting health data reported by cat owners
veterinarians and seek nutritional information elsewhere       and not health professionals, objective evaluation of cat
[24]. A large risk of reliance on resources online or in       health could not be performed. Collection of data from
print is the lack of quality control and critical evaluation   veterinary practitioners has limitations as well, since less
these media undergo. While some websites, books, or            than half of cat owners present their cats to a veterinar-
other media may be useful resources with up-to-date            ian on a regular basis [26], and many veterinary visits
and accurate information, it may not be apparent to the        are as a result of a health disorder [49]. This could result
pet owner which are useful and which may be mislead-           in overestimation of health disorders. Utilising a survey
ing and potentially harmful. For this reason, discussion       of pet owners, if representative of the general pet-
of pet diet with the pet’s veterinarian is recommended.        owning population, should better represent owners of
The criteria used to select pet food differed as well be-      healthy pets as well as pets with health disorders. This
tween feeders of MB or PB diets. In comparison to the          was the goal of the study presented here. With respect
owners feeding MB, those feeding PB had a greater con-         to the methodology employed, the sampling strategy
cern for the diet being labelled complete and balanced,        likely targeted pet owners with particular interest in
Dodd et al. BMC Veterinary Research   (2021) 17:53                                                             Page 12 of 16

health and wellness and it is likely that pet owners with      Methods
particular interest in unconventional diets were included      The study was approved by the University of Guelph Re-
as it has been demonstrated that pet owners feeding un-        search Ethics Board (REB # 18–07-039).
conventional diets have a strong interest in pet health
and wellness [24]. This would potentially bias the results
to include a higher proportion of pets fed unconven-           Survey design
tional diets. As unconventional diets have been sug-           A questionnaire was designed by the authors using the
gested to increase risk of health disorders, this may have     Qualtrics (Qualtrics XM, Provo, Utah, USA) online plat-
resulted in reporting of more health disorders than            form. The questionnaire included questions based on
would be expected in a general population of pets. In          previously validated survey items and was piloted by the
order to compensate for this, the questionnaire was not        authors before being made available to potential partici-
only advertised online, but also to customers of pet retail    pants. Respondents were incentivised to participate by a
stores, with the expectation that many of the customers        random draw to obtain a gift certificate for a pet store of
would purchase commercial pet foods from these stores          their choosing. Eight prizes of $25CAD gift cards were
and thus be representative of pet owners feeding con-          available, and participants could choose to enter the
ventional foods. However, other commercial establish-          prize draw by including their email address at the end of
ments where pet foods are sold, such as grocery stores         the main questionnaire. These sensitive data were re-
or “big box” stores, were not targeted for survey adver-       moved from the main data and stored separately until
tising, which could impact the types of respondents rep-       the end of the data collection period. After the winning
resented in the study. As the questionnaire was available      participants were contacted, all sensitive data were de-
online, the number of potential pet owners who saw the         leted. The questionnaire included 36 multiple-choice, 8
link but chose not to participate (non-respondents) was        short answer, 7 Likert scale (0–100), and 1 ranking ques-
indeterminable. As such, there was no ability to evaluate      tions. The dataset included responses for dogs as well as
the response rate, nor quantify the proportion of re-          cats, dog data is presented elsewhere [62]. The question-
sponses obtained through advertisement a pet stores as         naire used flow logic to show questions related to cats
compared to online. This impairs interpretation of how         only to participants indicating that they owned cats.
representative the sample is of the general pet-owning         Questions were designed to collect demographic infor-
population. Another limitation of survey-based studies         mation about pet owners, pet species, breed, sex, age, ac-
in general is the reliance on accurate reporting and rep-      quisition, lifestyle (indoor/outdoor), as well as
resentation by the pet owner, a form of recall bias. In        information on pet health, clinical signs and wellness.
this case, despite careful review of the diet reported uti-    Cat BCS was selected by the respondents based on im-
lised to determine what type of diet the cat was fed, a        ages from the World Small Animal Veterinary Associ-
potential for misclassification exists if the diet reported    ation BCS chart, randomly ordered to avoid bias [63].
by the cat owner did not accurately reflect what the cat       For this 9-point score system, a score between 1 and 3 is
was actually being fed. This is challenging to control or      considered under ideal, 5 ideal, and 7 to 9 over ideal.
compensate for and represents a limitation of the study        Faecal score (FS) was selected by the respondent based
methodology that warrants consideration. Lastly, the           on images corresponding to the Bristol stool chart [64],
findings presented here represent the opinions and be-         randomly ordered to avoid bias. A score of 1 to 2 being
liefs of cat owners, not the definitive health status of the   abnormally hard to constipated, 3 to 4 being normal,
cats, and must be interpreted as such.                         and 5 through 7 ranging from soft to diarrhoea. To de-
                                                               termine prevalence of health disorders, body systems
                                                               and common disorders were listed, along with an “other”
Conclusions                                                    category, and respondents were asked to select the
Owners who fed their cats PB diets had a positive per-         appropriate system and describe their cat’s specific dis-
ception of their cats’ health, and reported a belief of bet-   order. These included: behavioural, cancer, cardiovascu-
ter general health, better body condition, and fewer           lar (heart), dental, dermatologic (skin), diabetes, ear,
health disorders as compared to owners who fed their           endocrine, eye, GI, hyperthyroid, kidney, liver, musculo-
cats MB diets. Furthermore, the reported lifespan of cats      skeletal, neurologic, obesity, parasites, reproductive, sei-
did not differ based on diet type. While these data are        zures, trauma/injury, urinary, other. Fifteen indicators of
owner reported and thus warrant follow-up research in-         cat wellness were adapted from previously validated
volving more objective evaluations, the hypothesis that        survey items [65–67], and answered as seven Likert scale
owners of cats fed a PB diet would report higher preva-        questions and eight on a visual sliding scale. The ques-
lence of negative health outcomes was not supported by         tionnaire is available as a supplementary file (see Add-
these findings.                                                itional files).
Dodd et al. BMC Veterinary Research (2021) 17:53 Page 13 of 16
Survey distribution input by the respondent. Owner-reported ‘other’ health
A link to the survey was distributed via email and post- disorders were categorized by a veterinarian (SD) and in-
cards to customers of Canadian and American pet food cluded for analyses. Based on the responses, behavioural,
retailers, including deliberate distribution to clients of musculoskeletal, parasites, reproductive and trauma/in-
the largest PB pet food retailer in Ontario, Canada. As jury were dropped. True behavioural disorders were dif-
well, the survey was promoted in online groups of cat ficult to differentiate from issues of training or lifestyle
owners on social media (Facebook, Inc., Menlo Park, (such as “a little too sassy”, “jealous”, “grumpy” or “claws
California, USA). The survey, which was available in door frames and harasses our girl cat). Reported muscu-
English only, was made accessible for 9 months, from loskeletal issues were difficult to interpret, with ambigu-
June 2018 to March 2019. Respondents represented a ous descriptions often associated with suspected
convenience sample of cat owners voluntarily participat- previous injuries. The parasite category was dropped as
ing in the study. responses were typically regarding kitten worming or in-
dicated that the cat was regularly treated with endo- or
Survey analyses ectoparasite medications, similarly the most common re-
Surveys were included for analysis for each question that productive disorder reported was either having kittens
was completed. Breeds were categorized into breed types or desexing surgery. The trauma/injury category con-
based on phylogenetic similarities and historical origin tained mostly anecdotes of incidents that were believed
[68]. Description of cat diet was collected in an open- to have occurred prior to current ownership, such as
text question and, where sufficient information was ob- “broken jaw before we adopted him”, “picked up by a
tained, categorized based on ingredients (MB, PB) and bird of prey prior to rescue from the street at 6 weeks”,
processing (commercial heat-processed, homemade, “one rear leg amputated from abuse” and “he sustained
raw) or a combination of the aforementioned (i.e.: some an injury before I got him that made his back half a bit
cats were fed more than one type of food on a regular wonky”. The remaining variables recategorized to: car-
basis). The term PB referred to a diet that contained no diac, dental, dermatologic (including ear infections and
animal ingredients, while the term MB referred to a diet polyps), endocrine, GI and hepatic, lower urinary tract,
that included animal-derived ingredients. Thus, while a neoplasia, obesity, ocular and renal.
MB diet could include plant-derived ingredients (e.g. a
kibble made from chicken and soy), a PB diet could in- Statistical analyses
clude no animal-derived ingredients. In addition to the All analyses were performed using Stata/IC 15.1 (Stata-
main diet, information was also collected regarding the Corp, College Station, Texas, USA) statistical software
feeding of treats (commercial heat-processed, raw, package. Descriptive statistics included frequency (n)
homemade), table foods and supplements, and catego- and percentage (%) presented for most data (type of pets,
rized based on ingredients (MB or PB). Cats fed a PB location and time of cat acquisition, breed, indoor/out-
diet but also given treats, table foods, snacks and/or sup- door management, hunting activity, diet and supplemen-
plements containing animal-derived products, were cate- tation, motivators for selection of cat food, resources for
gorized as PB+MB. All cats fed a MB diet were included information about feline nutrition) [72]. Frequency and
in the MB category, even if their diet included PB treats, percentage were also used within category for data col-
snacks and/or supplements. Due to the likelihood of eat- lected using Likert scales and for ranked data. Mean and
ing prey even if not reportedly known to hunt [69–71], standard deviation were presented for normally distrib-
cats fed PB diets with unrestricted outdoor access or uted data (cat age, duration of cat ownership, duration
ability to hunt, were added to the PB+MB category, of feeding (measured in years), and lifespan of previous
which was then re-classified as PB+MB/H for compara- cats) [73]. Median and range were presented for ordinal
tive analyses. For comparisons of pet food purchasing data (BCS, FS) and count data (number of cats kept,
motivations (Table 5) and use of nutrition resources number of health disorders per cat).
(Table 6) comparison was made between cats fed PB, Univariate comparisons between diet categories and
PB+MB, and MB. For comparison between health out- responses related to pet food purchasing behaviours
comes (Tables 2, 3, Figs. 1 and 2), consideration of abil- and pet nutrition information resources were con-
ity to hunted prey (PB+MB/H) was included as this may ducted using χ2 testing (see Tables 5 and 6). These
have an effect on cat health as compared to a strictly PB analyses were performed when comparing between
diet. Cat wellness indices measured by Likert scale were diet categories only (pet food purchasing, nutrition re-
reported directly, while sliding scale data was translated sources, hunting activity), without consideration of
by the survey software into a value reported ranging potential confounders. Age of previously owned cats
from 0 to 100. Cat health disorders were offered in at death was also compared among diet groups using
multiple-choice questions, with the option of ‘other’ for Kaplan-Meier statistic [74].Dodd et al. BMC Veterinary Research (2021) 17:53 Page 14 of 16
Statistical models were selected based on the nature of access. Variables were assessed for correlations and col-
the variable of interest – count, binary, or continuous linearity prior to inclusion in the model, no collinearity
data [75]. The relationship between number of health corrections were required. Backward stepwise regression
disorders per cat, measured as count data, and diet type was used to eliminate non-significant variables from the
was modelled using multivariate negative binomial re- final multivariate model. Significant independent vari-
gression. Within the model, the dependent variable was ables kept in the final multivariate model were cat age,
the number of health disorders per cat. Independent var- sex, BCS and diet.
iables considered included cat diet (3-level categorical: For all analyses, statistical significance was set at P <
PB, PB+MB/H compared to MB) and potential con- 0.05. A-priori sample size estimations were made using
founders: cat age (years), sex (2-level categorical: male data regarding prevalence of feline health disorders [48].
compared to female), sex status (2 level categorical: in- Considering the suggested increased risk of urinary tract
tact compared to desexed), breed type (9-level categor- diseases in cats fed PB diets [22], this health disorder
ical: domestic medium hair, domestic longhair, mixed was chosen for sample size estimation. Assuming the
breed, Asian, American, European, other, unknown, proportion of cats fed MB with urinary tract disorders
compared to domestic shorthair), BCS (ordinal: 3, 5, 7, 9 was 4%, calculation of the sample size comparing two
compared to 1) and indoor/outdoor access (3-level cat- different proportions with the estimation that three
egorical: indoor/outdoor access, outdoors only, com- times as many cats fed PB would have urinary tract dis-
pared to indoor only). Variables were assessed for orders (12%), yielded a required sample size of 116 cats
correlations and collinearity prior to inclusion in the per diet category. Post-hoc power calculations were per-
final model, no collinearity correction was required. formed comparing the mean values or proportions of
Using backward stepwise elimination to remove non- each variable of interest between diet groups, consider-
significant variables, the final model included cat age, ing an α value of 0.95 and a β of 0.8 as the cut-off
sex and diet. Model fit was visually evaluated by assess- points. Power less than 80% was considered too low and
ment of distribution of the residuals. represented an insufficient sample size to detect signifi-
Logistic regression models were used to assess the as- cant (P < 0.05) differences.
sociation between individual health disorders and diet.
One model was developed for each individual health dis- Supplementary Information
order as the dependent variable (cardiac, dental, derma- The online version contains supplementary material available at https://doi.
org/10.1186/s12917-021-02754-8.
tological, endocrinological, GI and hepatic, neoplastic,
obesity, ocular, renal and urinary), measured as a binary
Additional file 1. eSurvey wording. eSurvey questionnaire. Word
present/absent outcome. Independent variables consid- document transcription of electronic survey questionnaire.
ered included cat diet (MB, PB, PB+MB/H) and poten- Additional file 2 : Table S1. word document containing table of
tial confounders: cat age, sex, sex status, breed type, BCS demographic data of survey respondents.
and indoor/outdoor access. Variables were assessed for
correlations and collinearity prior to inclusion in the Abbreviations
model, no corrections for collinearity were required. BCS: Body condition score; FS: Faecal score; GI: Gastrointestinal; MB: Meat-
based; PB: Plant-based; PB+MB: Plant-based main diet with meat-based
Backward stepwise regression was used to eliminate snacks or treats, or animal-derived supplements; PB+MB/H: Plant-based main
non-significant variables from the final multivariate diet with meat-based snacks or treats, or animal-derived supplements, and/
model for each health disorder. Significant independent or plant-based diet with access to outdoors or the ability to hunt
variables kept in each multivariate model differed based Acknowledgements
on health disorder (Table 3). Though non-significant for The authors acknowledge the assistance of Mikhail Goussev and Eric
some disorders, age was forced into the model due to Weisman in distribution of the questionnaire to their client base of PB pet
food consumers.
the known associations between increasing age and risk
of health disorders as was diet, as it was the variable of Authors’ contributions
interest. Model fit was assessed by Hosmer-Lemeshow Designed the study: SD, DK, CD and AV. Performed the study: SD. Data
analysis: SD, DK and CD. Data interpretation: SD, DK, CD and AV. Drafted the
goodness-of-fit test. manuscript: SD, DK, CD and AV. All authors contributed to manuscript
Ordered logistic regression modelling was used to preparation and approved the final manuscript.
evaluate the relationship between owner perception of
cat heath, ranked in four levels: “poor”, “fair”, “good”, Authors’ information
The study is within the scope of the Population Medicine PhD Degree, of
and “very good”. The dependent variable was health SD, who received a PhD scholarship from the Ontario Veterinary College,
ranking, with odds ratios reported in comparison to the University of Guelph.
referent outcome “very good”. Independent variables
Funding
considered included cat diet (MB, PB, PB+MB/H), cat Funding for this research was provided by a Mitacs Accelerate grant in
age, sex, sex status, breed type, BCS and indoor/outdoor association with Vecado. The funding body, Mitacs, had no role in studyYou can also read