Esri News for State & Local Government
←
→
Page content transcription
If your browser does not render page correctly, please read the page content below

Esri News
for State & Local Government Summer 2019
Yolo County Provides a Trailblazing
Election to Its Citizens
Introduction The Solution
In Yolo County, California, recently elected elections official Improving communication between the field and election
Jesse Salinas approached the Information Technology (IT) divi- headquarters required a mobile solution to automate requests
sion of the county’s General Services Department, interested in for services, resolve supply shortages, and address problems
how he could significantly streamline the elections process. More at polling stations. The county developed an app using Esri’s
specifically, he planned to use geographic information system Survey123 for ArcGIS to empower poll workers to input work
(GIS) technology to rethink the elections experience for the con- order requests on their mobile devices. Once entered, the in-
stituents and his staff. The goal was to provide the public with a formation is pushed to the elections base for prioritization and
modern feel on Election Day by the 2018 midterm election. handling. The workflow was enhanced by feeding the collected
requests data to Workforce for ArcGIS, an app that helped
Challenge assign tasks, route and track field personnel, and provide work
The county had four challenges: improve resource allocation, status updates back to the office on a digital dashboard.
reduce response time through efficient routing to polling stations, Strengthening communication with citizens meant delivering
strengthen communication to citizens on election results, and timely and accessible election results through a public-facing
increase future turnout through targeted outreach and education. web app. Using Elections Results, a configurable solution
continued on page 3
A Story Map of the Postelection Results on Yolo County’s Public-Facing Website
Contents                                            Summer 2019

1   Yolo County Provides a Trailblazing Election to Its           Esri News for State & Local Government is a
    Citizens                                                      publication of the State and Local Government
4   Seeing the Forest and the Trees in the City of                Solutions Group of Esri.
    Arborly Love                                                  Contact the Esri Order Center at 1-800-447-9778
6   Resources                                                     or, from outside the United States, +1-909-793-2853.
8   Citywide Health Initiative Improves Lives in                  Visit the Esri website at esri.com.
    Rancho Cucamonga                                              View Esri News for State & Local Government online at
10 The Stress Index Application, City of Philadelphia             go.esri.com/gov-news.

12 Virginia’s Historic Steeplechase Horse Race Gets
   Real-Time GIS for Safety                                       Advertise with Us
14 Anchorage Pinpoints Assets with High-Accuracy                  Email statelocalads@esri.com.
   ArcGIS Enterprise
16 Wisconsin Provides a Map-Based App to Guide Hunters            Submit Content
                                                                  To submit articles for publication in
18 Appraising Property Using a GIS-Centric Workflow:
   Shawnee County, Kansas                                         Esri News for State & Local Government, email
                                                                  statelocalarticles@esri.com.

                                                                  Manage Your Subscription
                                                                  Subscribe or make changes to your Esri subscriptions at
                                                                  go.esri.com/gov-news. If outside the United States, please
                                                                  contact your international distributor; visit
                                                                  esri.com/distributors.

                                                                  Circulation Services
                                                                  For back issues, missed issues, and other circulation
                                                                  services, email infoupdates@esri.com or call
                                                                  909-793-2853, ext. 2778.

                                                                                                                                        Copyright © 2019 Esri.
                                                                                                                                        All rights reserved.
                                                                                                                                        Printed in the United States of America.

                                                                  The information contained in this work is the exclusive property of Esri or its licensors. This work is protected under United States

Knowledge Is Power.
                                                                  copyright law and other international copyright treaties and conventions. No part of this work may be reproduced or transmitted in
                                                                  any form or by any means, electronic or mechanical, including photocopying and recording, or by any information storage or retrieval
                                                                  system, except as expressly permitted in writing by Esri. All requests should be sent to Attention: Contracts and Legal Services
                                                                  Manager, Esri, 380 New York Street, Redlands, CA 92373-8100 USA.
                                                                  The information contained in this work is subject to change without notice.

Be the First to Know.
                                                                  @esri.com, 3D Analyst, ACORN, Address Coder, ADF, AML, ArcAtlas, ArcCAD, ArcCatalog, ArcCOGO, ArcData, ArcDoc, ArcEdit,
                                                                  ArcEditor, ArcEurope, ArcExplorer, ArcExpress, ArcGIS, arcgis.com, ArcGlobe, ArcGrid, ArcIMS, ARC/INFO, ArcInfo, ArcInfo Librarian,
                                                                  ArcLessons, ArcLocation, ArcLogistics, ArcMap, ArcNetwork, ArcNews, ArcObjects, ArcOpen, ArcPad, ArcPlot, ArcPress, ArcPy, ArcQuest,
                                                                  ArcReader, ArcScan, ArcScene, ArcSchool, ArcScripts, ArcSDE, ArcSdl, ArcSketch, ArcStorm, ArcSurvey, ArcTIN, ArcToolbox, ArcTools,
                                                                  ArcUSA, ArcUser, ArcView, ArcVoyager, ArcWatch, ArcWeb, ArcWorld, ArcXML, Atlas GIS, AtlasWare, Avenue, BAO, Business Analyst,
                                                                  Business Analyst Online, BusinessMAP, CityEngine, Community, Community Analyst, CommunityInfo, Community Maps, Companion,
                                                                  Database Integrator, DBI Kit, Drone2Map, EDN, Esri, esri.com, Esri—Team GIS, Esri—The GIS Company, Esri—The GIS People, Esri—The

Sign up for the State and Local Government                        GIS Software Leader, FormEdit, GeoCollector, GeoEnrichment, GeoEvent, Geographic Design System, Geography Matters, Geography
                                                                  Network, geographynetwork.com, Geoloqi, GeoPlanner, Geoportal, Geotrigger, GIS by Esri, gis.com, GISData Server, GIS Day, gisday.com,
                                                                  GIS for Everyone, Indoors, Insights, JTX, MapIt, Maplex, MapObjects, MapStudio, ModelBuilder, MOLE, MPS—Atlas, Ortho Maker, PLTS,

e-brief to receive news that could impact your work.              Rent-a-Tech, SDE, SML, Sourcebook•America, SpatiaLABS, Spatial Analyst, Spatial Database Engine, Story Map Basic, Story Map Cascade,
                                                                  Story Map Crowdsource, Story Map Journal, Story Map Series, Story Map Shortlist, Story Map Spyglass, Story Map Swipe, Story Map Tour,
                                                                  StreetMap, Tapestry, the ARC/INFO logo, the ArcGIS Explorer logo, the ArcGIS logo, the ArcPad logo, the Esri globe logo, the Esri Press
                                                                  logo, The Geographic Advantage, The Geographic Approach, the GIS Day logo, the MapIt logo, The Science of Where, The World’s
                                                                  Leading Desktop GIS, Water Writes, and Your Personal Geographic Information System are trademarks, service marks, or registered marks

go.esri.com/govnews                                               of Esri in the United States, the European Community, or certain other jurisdictions.
                                                                  Other companies and products or services mentioned herein may be trademarks, service marks, or registered marks of their respective
                                                                  mark owners.

2   Esri News for State & Local Government Summer 2019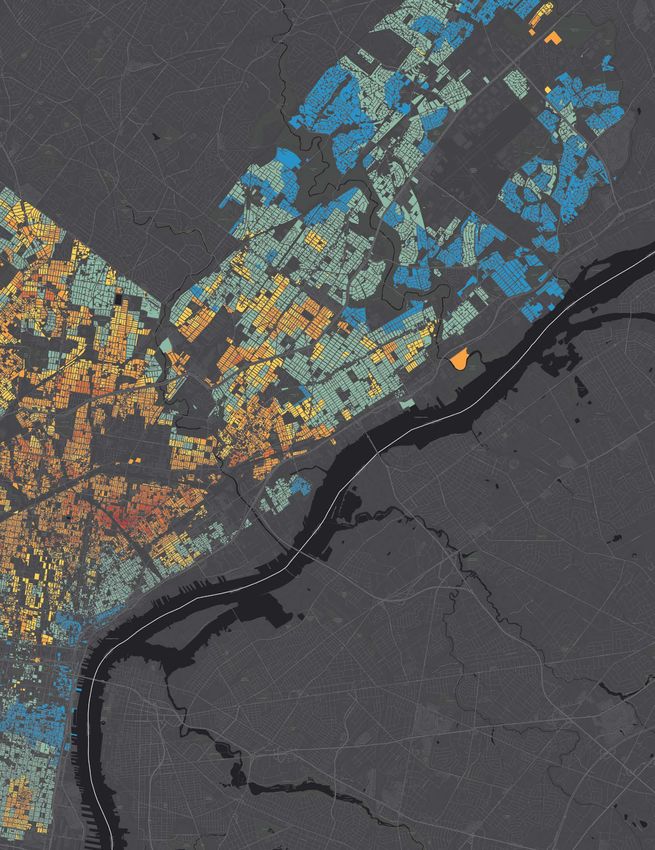
Yolo County Provides a Trailblazing Election to Its Citizens
continued from page 1
template, the county moved from a static representation of This new process allowed Salinas’s team more time to focus
election results to a dynamic visualization and interactive tool. on other aspects of the election, such as increasing efforts
Salinas now has 2018 voting data and plans to collect future to engage the community and provide timely election results
data to monitor historic voting patterns and use analytical tools to throughout the night. “The GIS data we’ve collected is now
improve elections outreach and education. This location-based in a format to begin conversations with our community about
information will help pinpoint neighborhoods that have a low voter neighborhood voter participation,” said Salinas. “We can now
turnout and will target voter education for groups that need a begin to look at patterns of low participation in the various
greater understanding of the voting process and voter options. neighborhoods and start to develop strategies to change the
less engaged election patterns of the past toward greater
The Results participation in the future.”
Yolo County’s election headquarters had its quietest early Yolo County discovered that GIS not only allowed it to
morning Election Day in comparison to previous years. The effortlessly collect data but also dive deeper into what that
Election department had significantly fewer incoming calls from information means. By partnering with the IT and GIS teams,
polling stations asking for additional resources and support. the Election department was able to modernize its election
The integration of Survey123 for ArcGIS with Workforce for management workflows, enable the county to enhance com-
ArcGIS ensured that the back-office staff were instantly notified munication, increase government dependability and trust, and
and able to route the nearest available field personnel to assist provide essential outreach to its citizens.
polling places. For more information on modernizing Election Day opera-
tions, visit go.esri.com/Elections-Yolo.
An operations dashboard of all service requests on Election Day allows the Election department to monitor updates in real time.
Summer 2019 esri.com/localgov 3
Seeing the Forest and the Trees
in the City of Arborly Love
By Peter Godfrey and Chris Kulchak, POWER Engineers
There may be no city in America that
loves trees more than Philadelphia. More
than 10 percent of Philadelphia’s land
area—16 square miles—is home to the
largest managed urban park system in
the world. With more than 1.63 million
park and street trees, Philadelphia’s
living assets outnumber people.
Under the care of the Philadelphia
Department of Parks and Recreation
(PP&R), the city’s trees thrive and grow
not only in size but also in number. The
city and its residents have planted more
than 300,000 trees since 2010 when a
corporate-sponsored program called
TreePhilly set a goal of establishing a
30 percent urban tree canopy by 2025.
About the same time TreePhilly
Whether in the back office or the field, PP&R staff can quickly and easily access valuable tree
kicked off, PP&R partnered with POWER information.
Engineers and EBA Engineering on a
three-phase implementation of Esri well as individual tree and planting site As the comprehensive discovery, pilot,
ArcGIS solutions and the Cityworks asset conditions. They also needed to be able and testing phases near completion,
management platform. The initial phase to efficiently assign work to contracted deployment of the full right fit pilot is
of the project established multiple re- vendors and to field crews using iPads scheduled for later this year. John Piller,
quirements for this vast number of highly who respond to about 22,000 public PP&R project manager, is already eager
dynamic assets that, unlike pipes and service requests per year. to go live.
poles, appreciate in value and consist- ArcGIS provided the dynamic and “We look forward to managing our street
ently change as they grow and age. authoritative database the city needed to and park trees as true assets and leverag-
On the operational side, PP&R needed track and analyze tree data. The compati- ing the Esri and Cityworks platforms to
a GIS-centric asset registry for risk man- bility of Esri’s ArcGIS Online, applications, enhance our business processes with the
agement of disease- or storm-damaged and add-ons, as well as the foundation of goal of greater efficiency and customer
trees, plus data for capital planning. On Cityworks’ asset management technol- service to the citizens of the City of
the ecological side, PP&R needed to ogy and mobile native apps, allowed the Philadelphia,” said Piller.
store information to support proactive configuration of a “right fit” solution for This emerging coordination between
management of tree diversity and envi- office, field, and mobile applications. departments and other stakeholders,
ronmental impact modeling for storm- To capture visual asset data to be made possible by technology, will enable
water management, canopy cooling, and stored in the GIS, the team also lever- the City of Philadelphia to take a holistic
carbon dioxide sequestration. aged CycloMedia’s cycloramas to record and data-driven approach to managing
In terms of technology performance, and extract spatial features with street these living assets. In turn, the city’s
PP&R required reliable remote data view photography for reference in the dynamic urban canopy will continue to
capture to record the dynamic infor- field. PP&R interns gathered accurate tree enrich environmental health and quality
mation about each tree—including condition information from cycloramas and of life for generations to come.
diameter, condition, height, and chang- added standardized height measurements
ing canopy coverage. Staff needed to from field inspections to fully populate For more information, visit
easily document customer requests as existing tree and planting site data fields. go.esri.com/cw-philly.
4 Esri News for State & Local Government Summer 2019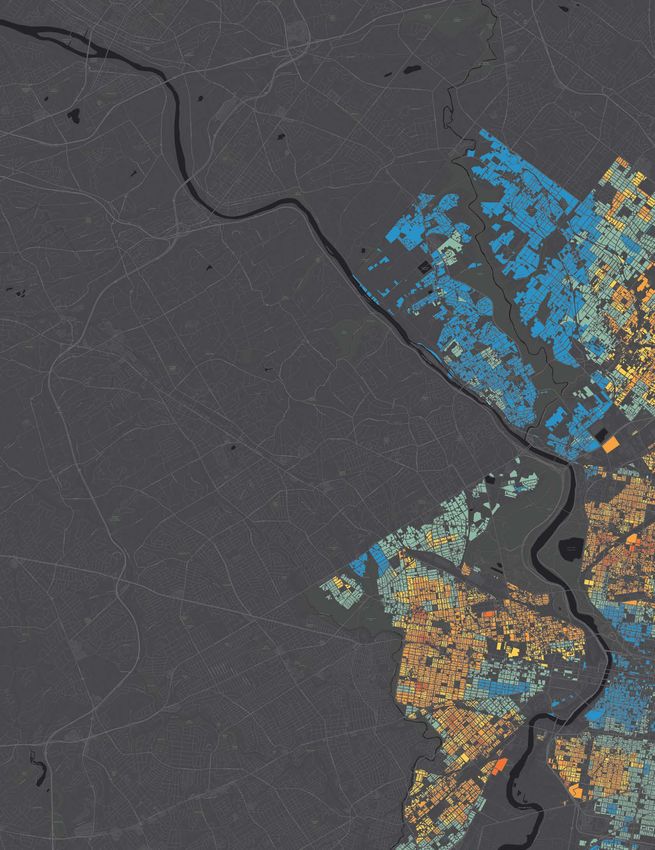
Resources

Impacting Every Corner of Your Community with GIS
Technology—Solving the Conflict between Humans and Nature
Utah Department of Natural Resources (DNR) uses Esri GIS technology to manage
conflict between humans and nature as the state’s population continues to grow rapidly.
See how staff use ArcGIS maps to provide real-time tracking and analysis capabilities,
enabling the department to reduce the risk of dangerous pelican strikes at Salt Lake City
International Airport and prevent vehicle collisions with moose and deer on major roads
and highways.

Watch the full video at go.esri.com/UtahDNRvideo.

Imagine Oshkosh: A Success Story in Redevelopment
Seeing industrial businesses leave their community, staff at the City of Oshkosh,
Wisconsin, decided to use technology to develop a plan, called Imagine Oshkosh, that
would secure economic and investment opportunities for the future. Kelly Nieforth,
economic development services manager for the City of Oshkosh, discusses how
ArcGIS and Esri partner Houseal Lavigne Associates helped promote the community to
investors and businesses.

Watch the full video at go.esri.com/Oshkosh-Redev.

E-book: Maximize Traffic Safety Interventions with Location Intelligence
Learn how GIS technology—with its inherent capabilities for capturing, managing, and analyzing data to
engage stakeholders—is critical to achieving systematic road safety improvements.

In this e-book, you will learn how to
•• Ensure accurate crash data collection in the field.
•• Improve data management and safety data integration across systems.
••Analyze crash data and monitor the effectiveness of countermeasures.
•• Communicate with and engage stakeholders.

Download the e-book today at go.esri.com/RoadSafetyNow.

Challenges in Airport Management Never Greater
Smart airports are turning to the power of information and a location intelligence strategy to inform
decisions. GIS technology allows airport managers to improve their operations; performance; and,
ultimately, bottom line.

Download the white paper Managing Complexity with Location Intelligence to explore best practices
and solutions for managing a modern airport.

Download the white paper today at go.esri.com/GIS4Airports.

6    Esri News for State & Local Government Summer 2019

Citywide Health Initiative Improves Lives
in Rancho Cucamonga
Introduction improve community health and how their The Challenge
In 2008, the City of Rancho Cucamonga, processes and workflows could change The primary goal of Healthy RC was to
California, faced the sad fact that the to support the Healthy RC initiative. make a positive difference in the lives
health of its citizens was declining. Through interdepartmental collabora- of Rancho Cucamonga’s citizens. While
Obesity and diabetes were on the rise, a tion and comprehensive community the city knew that health problems were
phenomenon that is occurring in many engagement, staff developed a strategy on the rise, staff needed more specific
cities and towns across the United States. for Healthy RC—asking residents, busi- information—more data—to help them
In response, the city decided to develop nesses, schools, faith communities, and make good decisions and take appropri-
the Healthy RC initiative. It started out as other stakeholders how to improve the ate action.
a special project in which staff reviewed health of individuals, families, and neigh- In most cities, the location and com-
local health rates and compared that borhoods. The strategic plan included position of neighborhoods can represent
information with county data. The find- eight health priorities: healthy eating and significant disparities between incomes
ings indicated that half the city’s adult active living, community connections and access to nutritious food and health
population was overweight or obese. and safety, education and family support, care. Citizens living in one neighbor-
City staff knew that success for the mental health, economic development, hood may have limited or no access to
initiative would require collaboration clean environment, healthy aging, and amenities such as parks, farmers markets,
across all departments, community- disaster resiliency. and grocery stores, while nearby, other
based organizations, businesses, cultures, Staff recognized that location intelli- people have opportunities for healthy
and public institutions. They started by gence was essential to understanding the lifestyles. Whereas one area could be
getting the departments together and health of their community and finding so- seen as dangerous or unsafe for children
asking what each was currently doing to lutions that improved the lives of citizens. to walk to school, another may have
community gardens that are not available
to people living close by. Even zoning,
which determines the type of permitted
land use, can contribute to negative
health effects for some of the population.
Food Access Map
Crime Layer/Traffic Collision Data Heat Map/School Locations/Park Walkability Radius
Analysis Layer (helps staff understand some of the reasons people may or may not walk to
parks; in particular, was used to assess the area around Los Amigos Park in Southwest Rancho
Cucamonga)
8 Esri News for State & Local Government Summer 2019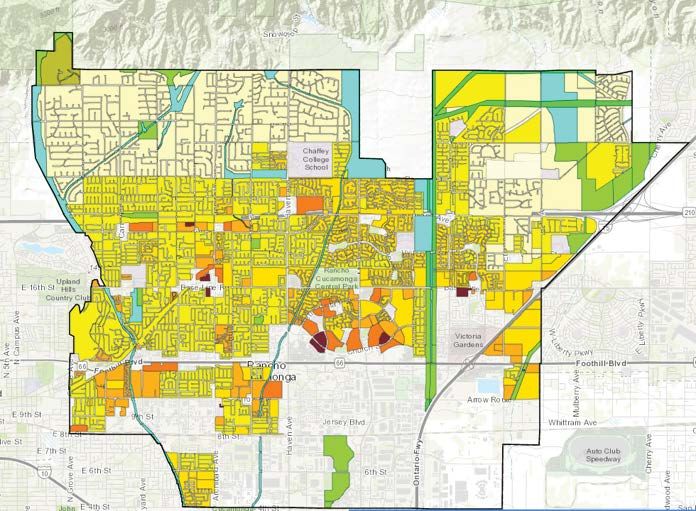
or were needed. To learn which areas
were considered unsafe, they connected
the data with the survey information,
crime statistics, and community stories.
Through collaboration, citizens were
able to use maps to identify places that
were unsafe for their children to walk or
play in. Residents also communicated
where they would most like to see a com-
munity garden or a farmer’s market.
Bringing all this information together
Policy in Action—Community in ArcGIS allowed the city to investigate
Garden Zoning Policy Before
how current zoning was impacting
neighborhood health and how changes
to the zoning could benefit different
neighborhoods.
The more information the team
Policy in Action—Community Garden Zoning After gathered, the faster the city could make
informed decisions and take meaning-
For the City of Rancho Cucamonga, first analyzed neighborhood-level data ful action. Additionally, the Healthy RC
perhaps the biggest hurdle to getting and identified the most disadvantaged team began using smart technology to
the data it needed was in reaching out areas, where health issues were greatest speed data collection. Fieldworkers used
and engaging the citizens themselves. To and healthy options were most scarce. Survey123 for ArcGIS on smart tablets
achieve the granularity of localized data, Next, they compared those areas with to collect data more accurately, which
staff needed to do the in-person health Rancho Cucamonga’s overall poverty and allowed them to identify issues at the
surveys necessary for understanding the median income data to better under- census tract level. By going digital, the
lives of citizens in different parts of the stand the disparities between different team was able to expedite companion
city. The data would serve as a baseline parts of the city. projects, such as the Safe Route to School
for verifying their assumptions about To establish a baseline, the team mem- initiative, which was designed to work with
the neighborhood characteristics and, bers created a paper-based survey that kids to show where safer crosswalks and
ultimately, help them develop targeted they could take into the field as they went lower speed limits were needed.
strategies to improve health outcomes. door to door to interview people. They
To meet the goals and objectives of also held community events, went to city Results
Healthy RC, the city had to consider parks and trails, and deployed an online Ten years later, the Healthy RC team
all these factors. The Healthy RC team survey. This way, the team could connect surveyed the community again, hoping
needed a way to bring the data together with people wherever they were. to see improvements from the imple-
in one place so it could be analyzed With this initial set of new information mented programs. The positive results of
and the findings presented to decision- entered in ArcGIS, staff were able to Healthy RC are staggering.
makers and the public. quickly determine food deserts—areas In the first couple years, many issues
where it is difficult to purchase afford- were identified and policies changed.
Solution able, healthy food. Using maps, the team With community input, the city changed
Using ArcGIS, a mapping and analytics members could see where sidewalks, zoning so that the farmers markets and
platform, the Healthy RC team members grocery stores, and parks already existed community gardens were made more ac-
cessible to all neighborhoods. The $1,500
conditional use permit fee for those
“We used location intelligence to engage the public amenities was waived. These were just
in a new and powerful way. It improved the quality of two policy changes among many, includ-
the relationship between the city government and its ing completing streets, setting nutrition
and beverage standards, and designat-
citizens, which resulted in a healthier community.” ing smoke-free areas. Additionally, there
Erika Lewis-Huntley, were several infrastructure
Management Analyst, City of Rancho Cucamonga continued on page 17
Summer 2019 esri.com/localgov 9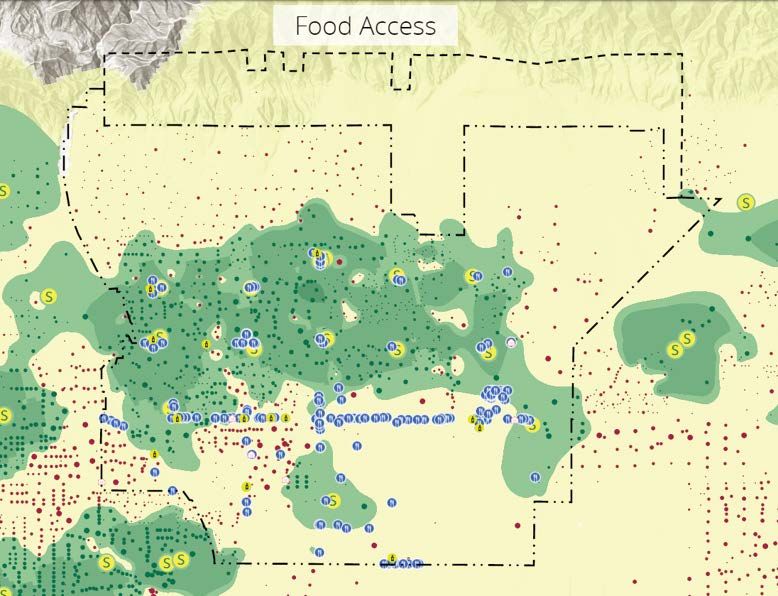
If you understood who was most a
      Composite Index

                           where you could make the bigges
                           would you make the same decision
 Unemployment
 Asthma
 Heat Stress
 Poverty

                                       Composite Index
                                       of Stress Indicators
 Drug Crimes
 and More

10              Esri News for State & Local Government Summer 2019
at risk and
st impact,
ns?
T
he Stress Index application, from the City of
Philadelphia, forces us to ask ourselves that
very question. Using the key measurements
of poverty, health, education, employment, and
quality of life, the city’s Stress Index helps identify
Philadelphia neighborhoods that are experiencing
the most stress. Explore this map, along with other
variables, on the Esri Maps for Public Policy site, a
complimentary resource to help you make data-
driven decisions.
Gain inspiration from forward-thinking organizations
that are tackling today’s community challenges.
Visit go.esri.com/philly-stress-index.
Summer 2019 esri.com/localgov 11Virginia’s Historic Steeplechase Horse Race
Gets Real-Time GIS for Safety
By Ryan Lanclos, Esri
Each spring, on the first the laws and making people feel com-
Saturday in May, equestri- fortable and safe,” Acors said.
ans and fans gather for the The use of a drone eliminated the labor-
Virginia Gold Cup stee- intensive mapping of the grounds and
plechase horse race. This provided dispatchers and officers with a
event sits atop the social near real-time overhead view of the facility.
calendar in Virginia’s horse country—the
epicenter of the nation’s horse and hunt Trial Event for Real-Time
community. Technology
Competitions for tailgating, wide- The origin of this type of horse race traces
brimmed hats, and wagers on the to colonial times when races would begin
winners—along with a steady flow of the at one church steeple and end at another,
event’s mint julep signature cocktail— with stone walls and stream crossings
can prove to be a volatile mix. adding danger and spectacle.
The event attracts close to 70,000 While horse racing in the region has
participants, turning a rural corner of been popular for a long time, the Gold
the county into a density of revelers the Cup was formalized in the 1980s with
size of a small city. To help contend with the donation of a 380-acre property The use of a drone eliminated the labor-
intensive mapping of the grounds and
the event’s complex security demands, and the formation of the Great Meadow provided dispatchers and officers with a near
organizers recently started using real-GIS. Foundation. Pari-mutuel betting was real-time overhead view.
“Everybody’s been cooped up for the added in 2013, and attendance at the
winter, and they come out dressed in their event has steadily grown ever since. Visibility on a Complex Course
best clothes to let their hair down a little In addition to the spring Gold Cup The race plays out across a broad field.
bit,” said Ray Acors, division commander race, an International Gold Cup event Around the edges of the field, large,
of the Fauquier County Sheriff’s Office. takes place every year in October, draw- white sponsor tents host guests for
“When you get a lot of people drinking ing a smaller, more sedate crowd of catered sit-down meals, rail spots allow
alcohol, some tend to make bad choices. fewer than 35,000 spectators. The most spectators to watch the race behind
“We want people to have a good time, recent fall event provided a good testing temporary fencing, and parking areas fill
so we’re being discreet but still enforcing ground to roll out real-time technology. up with tailgating revelers. The complex-
ity and expansive geography of the event
make it difficult for law enforcement
personnel, who need to ensure complete
coverage and the ability to respond
quickly should an incident occur.
“There aren’t many permanent struc-
tures, so our standard aerial imagery
doesn’t reflect the infrastructure of the
day,” said Dan Stell, GIS analyst with the
Fauquier County GIS department. “We
used a drone to capture up-to-date
imagery of the course.”
This imagery provides the backdrop
for map-based apps distributed on
64 smartphones provided by Verizon to
This aerial shot of the course provides perspective. emergency medical services personnel,
12 Esri News for State & Local Government Summer 2019the Virginia State Police, and Fauquier Police officers, firefighters, and rescue
County Sheriff deputies. The phones personnel took to the technology quickly.
allowed each person to be tracked on a “We worked really hard to make sure
large dashboard in the command center that the apps were easy to use,” said
bus parked at the event. Each person Drew Fioranelli, GIS director for Fauquier
with a phone could record and share in- County. “We were very direct and
cidents in the apps and see the location concise about how to use the applica-
of others on the map—all using a current tions, and all the officers had to do was
map showing where the temporary to have the device on their person for the
structures are located around the field. real-time capability to work.”
“Adding this capability as part of our This is one of the first times that all the
Incident Action Plan helped us to have an technology has come together in a rural
integrated response between local and area for such a large event. The lessons
state agencies,” said Stacie Neal, deputy learned and the successes will go a long
director and critical infrastructure program way in managing the more hectic Virginia
manager with the Virginia Fusion Center, Gold Cup steeplechase horse race in
who was integral in bringing together spring 2019.
people and technology for this test. “Using “The radio traffic was cut in half, and
Fauquier County Sheriff Robert Mosier
a common and current map, combined communication was quicker because
receives an update on event-driven, real-
with real-time first responder and incident we could see our assets in the field in time data feeds and reviews a mobile
locations, provided great situational aware- real time,” Acors said. application to support field reporting and
resource tracking during the event while in
ness for all the partner agencies.” the dispatcher’s station aboard the Fauquier
The Parts of the Solution County Sheriff’s communications mobile
command center.
Speeding Up Response Times For incident response at the Virginia Gold
The race runs for an intense eight or nine Cup, planners have long created maps. and share that same live view with the
minutes, with video feeds broadcast- “In previous years, we’ve just relied state fusion center, which is a collabora-
ing on big-screen televisions spread on static paper maps that we would tive hub of state, federal, and local law
throughout the course, and a race produce for law enforcement,” said Stell. enforcement working together to prevent
announcer giving a lively account of the “Every year we would have to digitize the and respond to terrorist and criminal
show. After this short burst of activity, locations of tents and map access points activity.
everyone goes back to partying. and staging areas. Using a drone really The dashboards incorporated live traf-
“There were a couple of jockeys that changed the view and made it much fic, weather feeds from WeatherOps and
fell off horses, which is expected; how- easier to deliver an up-to-date map.” AccuWeather, mentions of the event on
ever, no injuries were reported, which is The drone imagery was processed social media provided by DataCapable,
phenomenal for an event like this, and no using Drone2Map for ArcGIS, adding and news feeds of events in the sur-
real violations of the law,” Acors said. labels to the imagery rather than map- rounding area provided by NC4. Any inci-
Throughout the event, dispatchers ping each feature, to greatly reduce the dents logged by officers were displayed
kept close tabs on the locations of first time it takes to capture course details. by location and aggregated by type.
responders. This gave officials the ability The Fauquier County Sheriff’s Office “My vision is to incorporate this capabil-
to send the closest officer to an area of deployed Survey123 for ArcGIS for incident ity into daily operations,” said Acors. “We
concern rather than use the traditional mapping. This application provides a can track vehicles, but we can’t track
approach of dispatching the officer as- survey function with menus and built-in people deployed outside of their vehicles.
signed to the area who might be farther location capturing so that field personnel We have a lot of wooded and mountain-
away from the incident. The same view of can log and share incidents as they happen. ous terrain, and I hope we can keep better
real-time first responders’ locations and The security team members used track of our folks and deploy them directly
incidents were duplicated at the main Workforce for ArcGIS to track assets to any issue within my lifetime.”
communications center at the sheriff’s in the field in real time. Operations
office seven miles away in case a large Dashboard for ArcGIS allowed them To get started with real-time capabilities,
incident occurred and more resources to display and share different views of visit go.esri.com/realtimenow.
were needed. live information at the command center
Summer 2019 esri.com/localgov 13Anchorage Pinpoints Assets with
High-Accuracy ArcGIS Enterprise
On the edge of the Alaska wilderness, municipality-provided imagery.
Anchorage residents enjoy some of the “We would get all the data on the map,
world’s purest water, treated and deliv- but some points were lost,” senior GIS
ered by the municipal-owned Anchorage analyst Dave Boulier said. “We would have
Water and Wastewater Utility (AWWU). to go out and get the GPS points again.”
AWWU is a forward-thinking organiza- In addition, when validating the points
tion whose mission statement champions against municipal imagery in the GIS, it
“Reliable Infrastructure.” Last year, the was clear these were not always within
leadership team commissioned a best the six-foot range of error.
practices road map for AWWU’s GIS—its “The legacy GPS units said they were
primary system of record for water and submeter, but we were not always getting
sewer assets. that,” Boulier said.
“Our goal is to make the best use
of the GIS,” AWWU GIS manager Ed A Real-Time, Reliable Solution
Sorenson said. Previously, the AWWU GIS team had
California-based consultancy already tested five new GPS receivers,
NorthSouth GIS (NSGIS) provided across iOS and Android, and determined
AWWU with a GIS Master Plan, de- that the Arrow 100 GNSS receiver from
signed to keep AWWU on the cutting Esri Silver partner Eos Positioning Systems
edge of asset management. Two of would replace its legacy GPS units.
NSGIS’s recommendations targeted GPS “The Arrow 100 was the clear winner,”
Approximately 50 field crew members
improvements: Boulier said. “Once you get a signal and it
share 18 Arrow 100 GNSS receivers when
1. Better, easier, faster, and more reliable locks on, it’s almost instant collection. We’re writing data to Collector for ArcGIS.
and rugged GPS data capture getting submeter locations, and a lot of the
2. Capable of collecting data in real time times, it’s even better than half a meter.” Last fall, AWWU rolled out the new
With improved field GPS—delivered By eliminating postprocessing, AWWU workflow organization-wide.
reliably and in real time—AWWU could eliminated repeat field trips at an esti- “It has been a seamless rollout,”
reduce costs, cut manual labor, improve mated savings of 25 percent. Boulier said. “A lot of times it can be
data quality, and more. “It’s big-time cost savings,” Boulier said. challenging to ask your colleagues to
The GPS workflow also seemed like a Next, the GIS team members worked adopt new technology. But with this, it
natural place to start, because AWWU with the Technical Services team to set seemed to click with everybody. The
had already been targeting improve- up Esri Portal for ArcGIS. This enabled whole GPS program has really pushed
ments to a legacy workflow. secure, server-based, read-and-write the utility to move forward with using
access to the GIS in real time. They de- ArcGIS Online and Portal for ArcGIS.”
Challenges with Legacy GPS ployed Collector for ArcGIS to 50 iPhones. For more information on how your or-
AWWU’s legacy GPS units could take “Our field crews are able to look directly ganization can optimize field operations
from thirty seconds to a few minutes to at our local database, pull that data, and using EOS products, visit go.esri.com/
record a location. That time added up, write directly to the database, without Eos-gnss.
as field crews validate an average of a having to postprocess,” Boulier said.
couple of hundred points per month. Meanwhile, they also installed Explorer for
The utility’s legacy GPS units did not ArcGIS so everyone could pull up live, reli-
record in real time, so data would be cap- able GIS data from the Esri Enterprise portal,
tured in the field and have to be taken back whether they were in the field or office.
to the office for postprocessing. Afterward, “As long as their screen is refreshed in
the GPS points would be entered in the the portal, someone in the office can see
GIS and validated against imagery aggre- what’s being done in the field instantly,”
gated from a variety of sources, including Boulier said.
14 Esri News for State & Local Government Summer 2019Summer 2019 esri.com/localgov 15
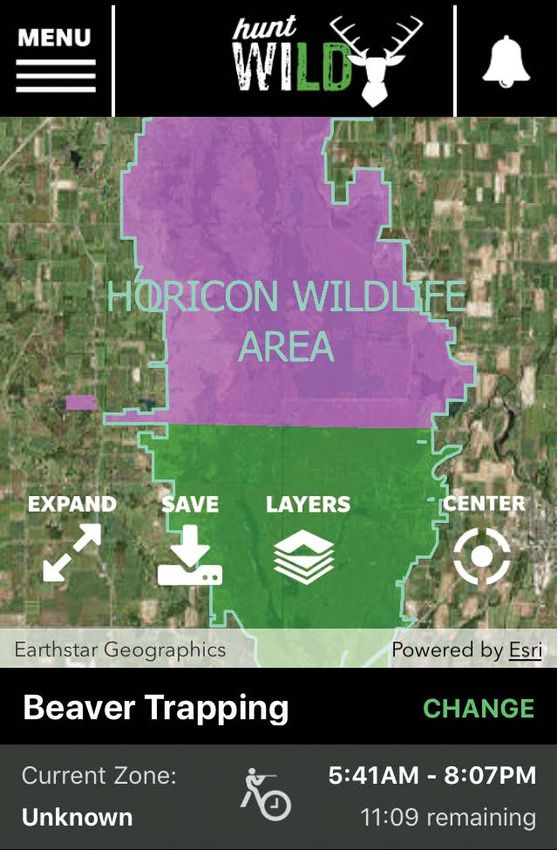
Wisconsin Provides a Map-Based App
to Guide Hunters
By Mike Bialousz, Esri
Not long ago, hunters in minutes of hunting, and happy that he
Wisconsin had to consult and all Wisconsin hunters no longer need
a Wisconsin Department to take a hard-copy regulations book into
of Natural Resources the woods.
(DNR) map for key pieces
of information. To see Accessing Location Information
where and at what times of the day they The Hunt Wild Wisconsin app tailors the
could hunt, for example, they searched experience, based on the species that
for hunting zones, marked on the map the hunter is pursuing. Both satellite and
along longitude lines. Now, hunters can topographic maps can be customized to
use an app on their smartphones to get save a favorite hunting location. Maps can
details about the exact location where be downloaded to the phone for access
they may be standing. and use in areas where there isn’t a cell
“I’ve been leaving the stand too early signal. Hunters can also use the app to
for 20 years,” said Scott Karel, regulation track themselves, helping them remember
policy specialist at Wisconsin DNR. Karel their trail and get back to their vehicle.
is both a hunter and one who adminis- The US Fish and Wildlife Service re-
ters regulations, and he appreciates a cently conducted a national survey about
hunter’s need for accuracy and simplicity. the popularity of hunting and found that
Every year, his group hunts deer in an hunting has declined 50 percent over the
area that’s close to the border of another past 50 years. With this decline in mind,
hunting zone.” The app said we were the app was designed to offer maps The content and functionality of the
in the other zone, and I was sure it was and information to anyone interested in map may evolve and expand over time.
wrong,” Karel said. I checked it against a exploring the state’s public lands, even if “We’ve already heard a number of
more detailed map, and—sure enough— the user is not a hunter. Knowing public suggestions from the public in terms
the app corrected our mistake.” land boundaries helps people in pursuits of things that they would like to see,”
Karel’s happy to have erred on the such as hiking, bird watching, and wildlife said Jeff Walters, project manager at
side of caution (leaving early rather photography (all of which are on the rise) Wisconsin DNR. “They’d like us to add
than staying late), happy to have more find new outdoor opportunities. trails to the map, other types of lands,
access points, and parking lots. Where to
park is always a huge issue for people.”
Getting a Mobile Advantage
Delivering maps and regulation informa-
tion via the Hunt Wild Wisconsin app
has helped streamline communication. It
allows the Wisconsin DNR to send impor-
tant push notifications to hunters, such as
the message that the season is closed if
a quota on a species has been reached. It
also solves a paper-based problem.
“We would have 600,000 to 700,000
publications, printed and distributed
across the state, in hard copy,” Walters
Wisconsin hopes to encourage a new generation of hunters.
said. “If a last-minute change came in
16 Esri News for State & Local Government Summer 2019Citywide Health Initiative
Improves Lives
continued from page 9
enhancements. Sidewalks and bike
lanes were put into place where
the need was identified, and parks
were added.
As stated in a recent report, the
survey showed that childhood obe-
sity had decreased by 13 percent;
the number of overweight students
had decreased by 7 percent; and
the incidence of heart disease,
diabetes, and cancer had de-
creased by 20, 14, and 21 percent
respectively.
Maps are central to many of the Hunt Wild Wisconsin app features.
The city was able to use GIS
technology not only to identify
regarding some specifics, we could to fine-tune the hunting experience. areas where government involve-
update our online version, but the The app ties neatly into the recruitment, ment was needed but also to make
printed version already in circulation retention, and reactivation (R3) strategy that intervention relevant and
would not reflect those changes. Now, that many state DNRs have adopted to engaging to a community.
we can make updates immediately in a reverse the decline in hunting. Staff used an ArcGIS Story Maps
transparent mobile app.” The app has gained popularity with app to help people visualize and
“Two years in a row, we’ve had major hunters. From its launch in September understand the policy changes. It
changes come down during our open 2018, it has had more than 90,000 included maps depicting areas
hunting seasons,” Karel added. “Both downloads. That’s at more than double before and after zoning changes.
affected what we already had in print.” the number of downloads of a previ- It also contained images showing
The move away from paper is also ous Wisconsin DNR app. In addition to how the addition of sidewalks
a reflection of how Wisconsin hunters being more popular, the new app offers and parks was changing the built
purchase their hunting licenses. “Almost greater flexibility to meet the needs of environment.
50 percent of licenses are now purchased Wisconsin hunters and is the means to Currently, one-quarter of
online instead of [at] a physical loca- collecting valuable information on their Rancho Cucamonga’s population
tion,” Walters remarked. The Hunt Wild behavior. While the app has a ways to is actively engaged in the Healthy
Wisconsin app should accelerate that go to reach the majority of the 700,000 RC program. The city has plans
trend, as hunters can purchase a license, licensed hunters in Wisconsin, it’s picking for expanding it citywide through
a tag, or a permit directly via the app. up even greater pace and receiving good community engagement to also
response from users. address health equity. The revised
Delivering an Experience “We put a mechanism in the app for program will include strategies to
Wisconsin has started to think about people to email us directly,” Karel said. ensure adequate representation
the hunter more as a customer, and the “We have gotten quite a few constructive of the city’s diverse population for
mobile app offers one of the ways that suggestions for what people want to shaping future policy, projects, and
the state reduces barriers to participation. see in the app, and we were pleasantly services.
The goal is to make outdoor experiences surprised by how many people took the To see the Healthy RC story map,
more enjoyable, and the hope is to attract time just to say, ‘Hey, this is great!’” go to go.esri.com/RCstorymap.
a new generation of outdoor enthusiasts. To learn how state and local govern- To see how GIS can be used in
The app also allows the Wisconsin ments use GIS technology to create solu- health and human services, go to
DNR to see how people use it and travel tions to better manage natural resources, esri.com/industries/health.
the land. Aggregated details about visit go.esri.com/transformENR.
hunter behavior will help staff set policies
Summer 2019 esri.com/localgov 17Appraising Property Using a GIS-Centric
Workflow: Shawnee County, Kansas
Introduction
Like many counties in Kansas, Shawnee County property
appraisers had used a paper-based workflow to collect infor-
mation in the field for decades. They sought to replace this
workflow for annual visual inspections of properties by imple-
menting a GIS solution. This transformation would provide
appraisers with more detailed information for each property,
save time in the field and office, minimize data entry errors,
save costs, and enable supervisors to easily track progress on
a project that involves over 12,000 annual property inspections.
Using Esri’s technology and innovative GIS processes, Shawnee
County can now evaluate hundreds of properties per day with
greater accuracy and efficiency. In addition, citizens of the
county access updated parcel information using the county’s
web app.
Challenge
With about 76,000 tax parcels within its jurisdiction and shrink-
ing staff, workers in the Appraiser’s Office were overwhelmed.
Visual inspections of over 12,000 properties must be conducted
each year by state statute. Their workflow consisted of hun-
dreds of pages of printed material for each area assigned. The
paper work included major appraised features of each property An operations dashboard gives supervisors an interactive map that
shows work status updates at a neighborhood and county level.
but no pictures. This paper work would have to be organized
logistically to drive the areas and take pictures of each prop-
erty. Photos were taken with a digital camera, and the photo Solution
number was written down to be later matched up by office staff. The Appraiser’s Office looked to Esri’s geospatial platform,
Maps were printed of each area assigned. All paper was then easy-to-use apps, and innovative county GIS staff to replace
scanned, and data was entered into the appraisal software. its paper method. The county appraiser equipped field staff
with Windows tablets, but they needed to be used in a discon-
nected environment. Using Collector for ArcGIS (a mobile data
collection app), ArcGIS Online, and ArcGIS Pro, GIS staff were
able to piece together a digital GIS-centric workflow.
Before, it was easy for an appraiser to drive past a hidden
property and miss that inspection. To ensure every property
was inspected and done so the first time around, each parcel
was converted to a point feature in red on the map. Using
Collector, when the appraiser visited each point, pop-up infor-
mation provided an overview of the property. This pop-up also
included a link to a detailed PDF document that contained all
necessary appraisal information from years past, and a previous
photo. This PDF was redlined with changes and saved. When a
new photo was taken and the point marked as completed, the
Staff view of a selected parcel in Collector for ArcGIS with an feature turned green. In addition to the point feature, a custom
attribute pop-up window, which has a link to an editable PDF where
appraisers can edit any changes on the fly.
tiled basemap was also created in ArcGIS Pro, using imagery
and property information such as IDs and addresses. This aided
18 Esri News for State & Local Government Summer 2019the appraiser in knowing where they were at all times and at Results
which properties the data had already been collected. Using Now that the Appraiser’s Office has digitally transformed
editor tracking, the exact date of inspection is always collected its workflow, accurate data can be more easily captured and
and easily imported into the appraisal software. returned to the office. This has greatly reduced the amount of
When the appraiser comes in from the field, the attached time spent updating each parcel. The process minimizes the
photos are downloaded and processed to match a specific amount of error that could take place, since workers are no
location, then renamed according to the corresponding parcel longer handing over written notes, and the exact information
ID using the Python (ArcPy) coding language. This ensures that that an appraiser inputs into Collector is the same data citizens
every photo is on the correct property, and clerical staff no see in the county’s Property Search web app. This improves the
longer have to manually match photos to properties. dialog that local government ultimately has with its citizens and
After automated scripting updates the map layer in ArcGIS drives information to them at a much faster rate. The county
Enterprise, GIS manager Lee Allen can provide a compre- also saves thousands of pieces of paper and ink, better utilizing
hensive view to supervisors using Operations Dashboard for taxpayer dollars.
ArcGIS, a configurable all-in-one control panel. The dashboard Just over a year ago, the team was overwhelmed with an out-
provides a higher-level look at the entire data collection area, dated workflow. Now with its new and improved digital method,
which consists of key performance indicators such as work it is planning to track and collect parcel information for roughly
status updates. 2,000 mobile homes.
Not only did improving the workflow enhance the speed Not only has the local government been able to upgrade
at which work was getting done but now the county can also its field operations for appraisals, but it is also taking on more
push that information to citizens. All property data is available work and seeing that the workflow it built using Esri’s technol-
to residents through a mobile-friendly web map, where they ogy can be used across the enterprise in other aspects of work.
can access property assessment and tax information. The GIS Shawnee County uses Esri interactive mapping to help citi-
department used Web AppBuilder for ArcGIS, a platform that zens learn about precincts for voting, commissioners, and crime
allows users to create easy-to-use web apps for their workflows mapping and to see where the flood zones are in the county. To
and community. The web app is synced with enterprise GIS see its gallery of maps, visit www.snco.us/ap/mapping.asp.
data including property data. The Appraiser’s Office can pub- For more information on how you can improve field opera-
licly share authoritative data that citizens and businesses need. tions at the Appraiser’s Office, visit go.esri.com/snco-field-ops.
Shawnee County’s Property Search web map delivers authoritative data—such as property tax and appraisal information and where the flood
zone-prone areas are—to citizens.
Summer 2019 esri.com/localgov 19Presorted
Standard
US Postage
Paid
380 New York Street Esri
Redlands, California 92373-8100 usa
Don’t miss out on news, insights, resources, and alerts.
Sign up for updates at go.esri.com/subscribe.
168365 G427593
ArcGIS Hub
Transforms
Community
Engagement
Accomplish data-driven
initiatives and collaborate
with your community.
Learn how:
go.esri.com/lets-get-this-hub-started-1
Copyright © 2019 Esri. All rights reserved.You can also read