Replication Guideline for Water Reuse in Agricultural Irrigation
←
→
Page content transcription
If your browser does not render page correctly, please read the page content below
I S O E - M a t e r i a l i e n S o z i a l e Ö k o l o g i e 63

      Martin Zimmermann, Birte Boysen, Ehsan Ebrahimi, Michaela Fischer, Elmar Henzen,
      Johannes Hilsdorf, Jürgen Kleber, Susanne Lackner, Aydin Parsa, Karl-Ulrich Rudolph,
      Sebastian Schöller, Faruq Shalizi, Jochen Sinn, Jana Zinkernagel

      Replication Guideline for Water Reuse
      in Agricultural Irrigation
      Upgrading wastewater pond systems to generate irrigation water for animal
      fodder production using the example of Outapi, Namibia
ISOE-Materialien Soziale Ökologie, Nr. 63
ISSN 1614-8193
Die Reihe „ISOE-Materialien Soziale Ökologie“ setzt die Reihe
„Materialien Soziale Ökologie (MSÖ)“ (ISSN: 1617-3120) fort.

Martin Zimmermann, Birte Boysen, Ehsan Ebrahimi, Michaela Fischer,
Elmar Henzen, Johannes Hilsdorf, Jürgen Kleber, Susanne Lackner,
Aydin Parsa, Karl-Ulrich Rudolph, Sebastian Schöller, Faruq Shalizi,
Jochen Sinn, Jana Zinkernagel

Replication Guideline
for Water Reuse in
Agricultural Irrigation
Upgrading wastewater pond systems to generate irrigation water for
animal fodder production using the example of Outapi, Namibia

Herausgeber:
Institut für sozial-ökologische Forschung (ISOE) GmbH
Hamburger Allee 45
60486 Frankfurt am Main

                    Namensnennung – Weitergabe unter gleichen
                    Bedingungen 3.0 Deutschland (CC BY-SA 3.0 DE)

Cover: EPoNa-Verbundvorhaben

Frankfurt am Main, 2021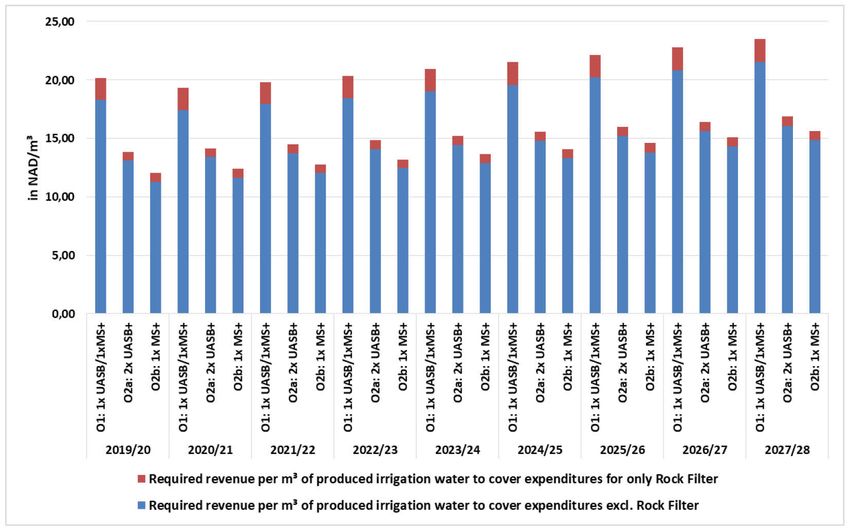
Projektpartner:

• Fachgebiet Abwasserwirtschaft, Institut IWAR, Technische Universität Darmstadt
• ISOE − Institut für sozial-ökologische Forschung
• Institut für Bodenkunde und Pflanzenernährung sowie Institut für Gemüsebau
  der Hochschule Geisenheim University
• Institut für Umwelttechnik und Management an der Universität Witten/Herdecke
  (IEEM)
• Aqseptence Group GmbH
• H.P. Gauff Ingenieure GmbH & Co. KG – JBG

|2
Abbreviations

AHP        Analytic hirarchy process
CBA        Cost-Benefit Analysis
CEO        Chief executive officer
COD        Chemical oxygen demand
EIA        Environmental Impact Assessment
EPoNa      Upgrading of wastewater ponds to generate irrigation water using
           the example of the Cuvelai-Etosha Basins in Namibia
           (Ertüchtigung von Abwasser-Ponds zur Erzeugung von
           Bewässerungswasser am Beispiel des Cuvelai-Etosha-Basins
           in Namibia)
GIZ        German Cooperation for International Cooperation
           (Deutsche Gesellschaft für Internationale Zusammenarbeit)
MAWF       Ministry of Agriculture, Water and Forestry
MURD       Ministry of Urban and Rural Development
OTC        Outapi Town Council
SADC       Southern African Development Community
TSS        Total suspended solids
UASB       Upflow anaerobic sludge blanket
WSP        Waste stabilization ponds
WWTP       Wastewater treatment plant
WWTPP      Wastewater treatment plant partnership

                                                                              3|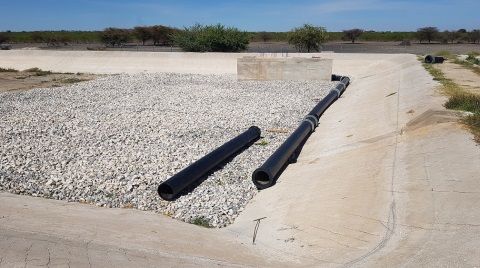
Contents
Abbreviations ............................................................................................................................ 3
Objectives of the Replication Guideline .................................................................................. 7

1.       Initial situation in Central Northern Namibia and Outapi ............................................ 8
         1.1      Water reuse applications and socio-economic aspects ............................................. 8
         1.2      Specific problems in Northern Namibia ......................................................................... 8
         1.3      Political framework, governance and institutions ........................................................ 8
         1.4      Local demand in Outapi .................................................................................................... 9
         1.5      Analysis of local capacities ............................................................................................. 9

2.       Overview of the EPoNa concept ................................................................................. 10
         2.1      Aim of the concept .......................................................................................................... 10
         2.2      Initial situation of the wastewater infrastructure ....................................................... 10
         2.3      Design and flow chart of the upgraded technology ................................................... 10
         2.4      Pre-treatment using UASB and micro sieve ................................................................ 11
         2.5      Post-treatment in wastewater ponds with a bio-percolation filter........................... 12
         2.6      Reduction of pathogens and management of microbial risk ..................................... 14
         2.7      Agricultural production .................................................................................................. 15
                  Soil and Fertilizers ........................................................................................................... 15

3.       Planning, operation and sustainability ....................................................................... 19
         3.1      Work packages and time schedule .............................................................................. 19
                  Operational concept ....................................................................................................... 20
         3.2     Framing activities, capacity development and wastewater treatment
                 plant partnership ............................................................................................................. 22
         3.3      Ownership ........................................................................................................................ 22
         3.4      Social-ecological impacts ............................................................................................. 23

4.       Economic considerations............................................................................................. 24
         4.1      Investment ....................................................................................................................... 24
         4.2      Operation and maintenance costs and revenues ....................................................... 25
         4.3      Cost-benefit analysis ...................................................................................................... 26
         4.4      Financing options ............................................................................................................ 27

5.       Transfer and dissemination ......................................................................................... 29
         5.1      Initial transfer projects ................................................................................................... 29
         5.2      Suitable areas for dissemination................................................................................... 29
         5.3      Networks and partners for dissemination ................................................................... 30
         5.4      Success factors and benefits of the approach ........................................................... 30

References............................................................................................................................... 33

                                                                                                                                                 5|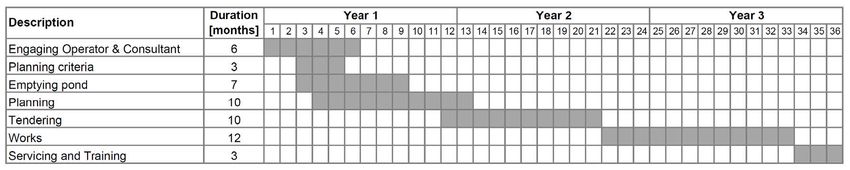
Preface
This Replication Guideline has been developed within the research project “Upgrading
of Wastewater Ponds for Irrigation Water Production using the Cuvelai-Etosha Basin
in Namibia as an Example (EPoNa)”, funded by the German Federal Ministry of Edu-
cation and Research (grant number 02WAV1401B). Authors from all project partners
of the consortium contributed to the preparation. The Replication Guideline summa-
rizes the results and experiences of EPoNa in the fields of technology, agriculture,
ecology and governance for the transfer of knowledge to decision makers. The scien-
tific and technical results are presented in an application-oriented manner so that they
can serve as a blueprint for replication, opening up opportunities for the transfer of
the EPoNa concept to other African countries. The Replication Guideline is concluded
with lessons learned and success factors of the implementation process.

Vorwort
Die vorliegende Replication Guideline ist im Rahmen des vom Bundesministerium für
Bildung und Forschung geförderten Projekts „Ertüchtigung von Abwasser-Ponds zur
Erzeugung von Bewässerungswasser am Beispiel des Cuvelai-Etosha-Basins in Namibia
(EPoNa)“ entstanden (Förderkennzeichen 02WAV1401B). Autoren aller Projektpartner
des Verbunds haben an der Erstellung mitgewirkt. Die Replication Guideline fasst die
Ergebnisse und Erfahrungen von EPoNa aus den Bereichen Technik, Landwirtschaft,
Ökonomie und Governance für den Wissenstransfer zu Entscheidungsträgern aus der
Praxis zusammen. Die wissenschaftlich-technischen Ergebnisse werden anwendungs-
orientiert präsentiert, sodass sie als Blaupause für die Replikation dienen können und
somit Wege für den Transfer des EPoNa-Gesamtkonzeptes in andere afrikanische
Länder eröffnen. Abgerundet wird die Replication Guideline mit Lessons Learnt und
Success Factors des Implementierungsprozesses.

|6
Objectives of the Replication Guideline
The replication guideline provides relevant information for the transfer of the EPoNa
water reuse system to other locations. In this context, it is essential to illustrate the
benefits of the system and also the disadvantages of a lack of sanitation. We can show
how the EPoNa water reuse concept can improve living conditions and how it can
be adapted to different framework conditions. The experiences of the Outapi Town
Council (OTC) exemplarily illustrates the steps and measures taken to adapt the water
reuse concept to a town’s existing structures. The aims of the replication guideline
therefore are:

• to provide information for the replication of the EPoNa concept in regions with
  similar conditions
• to support further strategic planning of a sustainable implementation of the
  EPoNa concept
• to support communication with partners in Namibia, Germany and other countries
  and
• to support internal work processes and knowledge management

                                                                                     7|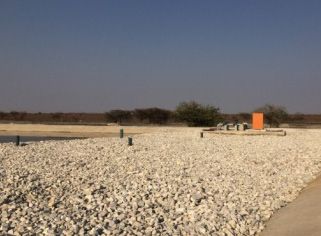
1. Initial situation in Central Northern Namibia
   and Outapi

1.1 Water reuse applications and socio-economic aspects

In order to assess water reuse, it is necessary to link major water use patterns and water
demand with potential water reuse applications. Besides the geographical and climatic
situation, water use and withdrawals also depend on socio-economic aspects such as
the degree of urbanization and population growth, which is why water withdrawals
differ considerably. It becomes clear that particularly the distribution of water abstrac-
tions for industry and agriculture differs significantly from region to region. With
regard to Africa, including both sub-Saharan and northern Africa, we can see that the
agricultural sector withdraws the enormous amount of almost 90% of water. This is
due to the fact that, on the one hand, less water is generally available in (semi-) arid
regions through precipitation and therefore more irrigation is required, and, on the
other hand, the industrial sector is not as established as in industrialized countries. The
relevance of water reuse is underlined by population growth, economic development
and climate change, especially in countries of the global south.

1.2 Specific problems in Northern Namibia

Around half of the Namibian population lives in the Cuvelai-Etosha Basin in central
northern Namibia. For the almost one million people, water from the Kunene River on
the Angolan-Namibian border is transported and distributed via a long-distance water
supply system for human consumption as well as agricultural purposes. The arid region
faces the following water-related problems: water scarcity, lack of irrigation water,
loss of water due to evaporation in wastewater ponds and saline groundwater, poor
access to tap water and sanitation services in informal settlements, poor capacities with
regard to health and hygiene as well as at a technical level.

1.3 Political framework, governance and institutions

On the political level, the Ministry of Agriculture, Water and Forestry (MAWF) is re-
sponsible for the support, development, management and usage of water resources,
agriculture and forests. Issues regarding water resources management in rural contexts
are regulated by the Department of Water Affairs and Forestry while the subordinated
Directorate of Water Supply and Sanitation Coordination coordinates the efforts of all
the ministries and other stakeholders in the area of sanitation. The Ministry of Health
and Social Services sets up programs for hygiene education.

Further key stakeholders in the project region are the Ministry of Urban and Rural
Development (MURD), Regional Councils (RC), the Olushandja Basin Management

|8
Committee, and the Outapi Town Council (OTC). External stakeholders may also be
relevant under certain circumstances, e.g. GIZ for its involvement in (Transboundary)
Basin Management Committees.

1.4 Local demand in Outapi

Outapi is located 10km south of the Angolan border. The already limited water re-
sources in the Cuvelai-Etosha catchment area are increasingly under pressure by pop-
ulation growth and urbanization. According to the former CEO of Outapi, the popula-
tion has been doubling in numbers roughly every 3 years. In 2011, Outapi reached a
total population of 6,437, in 2018 the population came up to 11,000 inhabitants
(Mwinga et al. 2018). In addition, the region is undergoing a process of rapid urbani-
zation which leads to the fact that around 40% of the population in urban areas have
no access to improved sanitation facilities (MAWF 2009). Apart from this, Northern
Namibia is dependent on fodder supply from other parts of the country. This shows
that the need to produce fodder crops causes a high demand for water reuse and agri-
cultural irrigation.

1.5 Analysis of local capacities

There is a general lack of water operators and technicians in Namibia. Although man-
agement structures regarding water and sanitation do exist at the OTC (at the Depart-
ments of Technical Services as well as Environmental Health and Safety), Outapi lacks
local capacities, especially on a technical level. So far, the OTC owns and operates
a gravity sewer network discharging in a system of ponds (waste stabilization ponds,
WSP) with a so-called “evaporation pond” as the final stage. But due to population
growth and the extension of the sewer system, the ponds lack maintenance and are
overloaded. This leads to an overflow of barely treated wastewater into the surrounding
environment (especially during flooding in the rainy season) and a rapid fill-up with
sludge.

Local and regional capacities for small-scale farming are limited. As irrigation agricul-
ture is difficult due to the aridity of the region, traditional farming is mostly based on
rainfed agriculture and the cultivation of Pearl Millet (Mahangu). Irrigation farming is
only practised by few commercial farmers who cultivate crops for human consumption.
Thus, fodder has to be imported from greater distances.

                                                                                      9|
2. Overview of the EPoNa concept 2.1 Aim of the concept The EPoNa concept pursues the following objectives: • Reuse of water resources • Reuse of nutrients • Production of fodder crops • Preventing uncontrolled discharge of wastewater from waste stabilization ponds into the environment • Reduction of greenhouse gas emissions 2.2 Initial situation of the wastewater infrastructure Since 2004, waste stabilization ponds (WSP) were constructed in Namibia. Back then, Outapi had a population of about 3,000, with 2,500 having access to sewerage services. Nowadays, houses in more developed urban districts are connected to a gravity sewer system. The WSP system in Outapi has two parallel lines (line A and line B) with four ponds each: one primary facultative pond followed by three maturation ponds. All eight ponds have a total water surface area of 40,000m² and a total volume of 55,000m³. The final evaporation pond has a surface area of 41,000m² and a volume of 20,000m³ (Sinn and Lackner 2020). 2.3 Design and flow chart of the upgraded technology One way of accomplishing the goals can be a purposeful upgrade of the existing WSP with other technologies. The EPoNa project compared two pre-treatment technologies: an Upstream Anaerobic Sludge Blanket (UASB) reactor and a micro sieve in order to reduce the organic and particle load (total COD and TSS) (Sinn et al. 2019). The daily amount of wastewater for the design varied between 480 and 1,250m³/d. The UASB had a pilot scale character and a constant flow rate of 6.5m³/h for 12 hours per day was applied as a basis for the anaerobic biological process, which meant a treat- ment capacity of 78m³/d wastewater can be treated via this treatment process. The mechanic filtering process had a size that was able to treat the remaining wastewater of maximum 80m³/h and on average about 6m³/h were treated via this micro sieve (Sinn and Lackner 2020). Line A was further improved by emptying, and by then removing settled solids from pond A-1. In this first pond of line A two floating baffles were also introduced to | 10
improve the flow system and make use of the full pond volume. Furthermore, in pond
A-4 a rock filter was added as a post-treatment stage in pond A-4 (see figure 1).

Figure 1: Flow chart of the improved waste stabilization pond system (Sinn et al. 2019)

Under normal pond operation conditions, both lines A and B are completely separated
from each other, with pond A-4 delivering an advanced treated effluent and pond
B-4 delivering only wastewater treated by ponds in their original or even overloaded
state. New pumps at the end of pond A-4 and B-4 convey the treated wastewater into
high tanks.

The new pre-treatment plant consists of flow distribution valves, a manual fine screen,
and a buffer chamber as well as of 2 parallel processes for COD and TSS load reduction,
one biological treatment via a UASB-reactor and one mechanical filter via a micro
sieve. It was examined which of those technologies is more suitable for retrofitting
existent pond systems in terms of wastewater treatment for water reuse but also with
regard to the possibility of further sludge treatment and disposal.

Stabilized sludge withdrawn from the UASB-reactor is directed to sludge drying beds
and finally used as fertilizer in agriculture whereas raw sludge that is removed from
the micro sieve is further treated in a fermenter. The fermenter is located at the Oswin
O. Namakalu Sanitation and Reuse Facility in Outapi where the generated biogas is
utilized in the combined heat and power unit available there. The biogas produced in
the UASB-reactor is burned in a gas flare to prevent methane emissions to the envi-
ronment.

2.4 Pre-treatment using UASB and micro sieve
The volumetric loading rates of the UASB are about 1,260g/(m³d) and 550g/(m³d) of
total COD and TSS, respectively. Total COD and TSS are reduced through sedimentation
and anaerobic digestion, and the UASB reaches reductions of 15 to 20%. After further

                                                                                          11 |
development of the anaerobic sludge bed, continued improvement of the performance
of the UASB is expected (Sinn et al. 2019, Sinn and Lackner 2020).
The process design considered the Passavant CarbonExtract®-Process with a Nogger-
ath® RSH-MG, which enables primary sludge generation and handling in a combined
unit.1 For standard cleaning, effluent water from pre-treatment was used to generate a
forceful water-air mixture. The drum of the micro sieve was cleaned with a 2% potas-
sium hydroxide solution at 60°C if required. During a testing phase, different flows
and operation parameters of the micro sieve were examined. By using a sieve with
250 micron mesh size, the removal rates of total COD and particulate COD improved
to 18% and 29%, respectively.
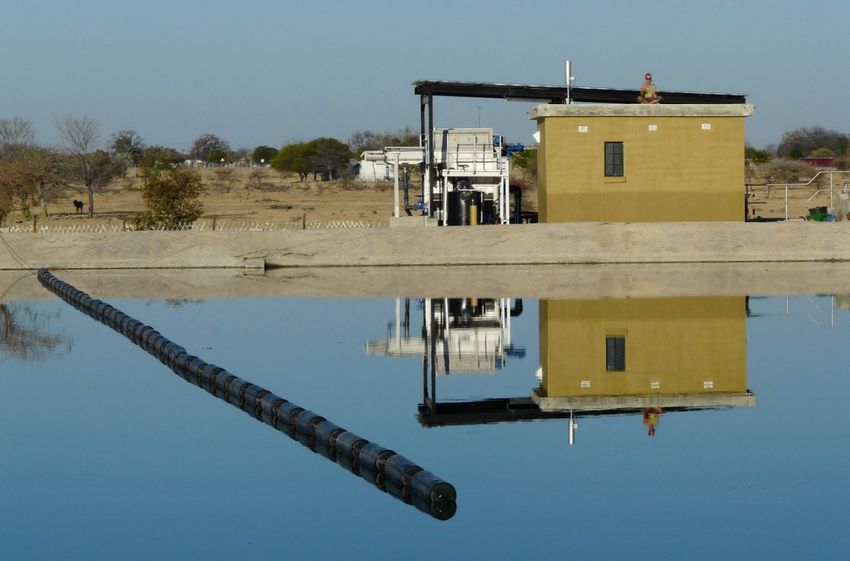
Figure 2: Pond A-1 and the pre-treatment plant (Photo: EPoNa joint project)
2.5 Post-treatment in wastewater ponds with
a bio-percolation filter
The bio-percolation filter can be used for post-treatment within the rehabilitation and
upgrading of an existing pond system, in combination with the described pre-treat-
ment, to raise the effluent quality to a suitable level for reuse in agricultural fodder
irrigation. The design philosophy of the post-treatment is to keep things as simple as
possible and in line with the existing pond system. Generally, pond systems are easy
to use and reliable because of their relatively simple technique (Weil et al. 2019).
1 https://www.aqseptence.com/app/en/solutions/carbonextract/
| 12Rocks can be used as a filter medium in the bio-percolation filter, hence the terms rock
filter or stone filter. The water passes through the voids between the rocks in the sub-
merged porous rock bed. For this, the ideal rock size ranges from 50 to 200mm. A
larger rock size reduces the available surface area which limits the biofilm develop-
ment, while smaller rocks increase the risk of clogging (Sperling et al. 2019). The filter
influent can be introduced below the rock surface layer to avoid odour and insect
problems. Algae and solid particles from the previous ponds percolate horizontally
under gravity flow and become attached to the rocks where biologically active surfaces
induce decomposition. The treatment operation of the rock filter is based completely
on natural processes and depends on the loading rate, temperature, size, and shape of
the rocks (Mara et al. 2001; Short 2008; Sperling et al. 2019).
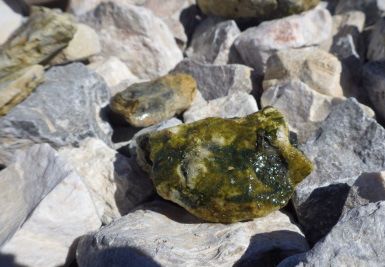
Figure 3: Rock filter under construction (with visible collection pipes), the finished filter
and biofilm (Photos: EPoNa joint project)
Apart from the mechanical filter effect, the biological degradation performance
depends on the degree of development of the biofilm on the rock surface, which in-
creases naturally over a period of several months. First results of the EPoNa sampling
campaign show a promising increase in efficiency, especially in COD reduction. A
reduction of suspended solids of more than 45% (Average January – April 2020), an
improved oxygen demand and a fair reduction of pathogens (more than 4.0E+04 for
E.coli) demonstrate the positive effects of the filter.
Undecomposed nutrients which are discharged by the effluent can be seen as fertilizer
in the irrigation water. A possible disadvantage could be the unreliability of the rock
filter with regard to ammonia removal. In numerous cases, ammonia concentrations in
the effluent exceed those in the influent of the rock filter (Gonzalez-Martinez et al.
2011)2. If an ammonia concentration limit is given for the final effluent, aeration
measures should be taken into consideration (Mara und Johnson 2005).
Based on the measuring results of the EPoNa research project in Outapi, we can con-
clude that for wastewater generated from small communities a rock filter is a feasible
2 The ammonium nitrogen is mainly reduced by algal uptake under favourable conditions for algae
(Camargo Valero und Mara 2007). Also, it is investigated that algae mineralized organic nitrogen
into inorganic forms, mainly ammonia nitrogen (Khatiwada et al. 2017). Concurrent with the
mentioned factors, protein and amino acids used during anaerobic biodegradation and ammonia is
released. The ammonium nitrogen as the ion of ammonia used to grow microorganisms is always
lower than its production (Rao et al. 2005).
13 |natural upgrading solution for post-treatment. That kind of treated water would then be ready to be reused for agricultural irrigation. To decrease construction costs further, the rock filter can be put inside an existing pond. The biological percolation filter can be built with locally available materials and it is even possible to utilize recycling materials from construction sites (excluding solid waste and contaminated materials). Moreover, the bio-percolation filter is comparatively easy to operate. No chemical ad- ditives or energy (dependent on site-specific factors) are necessary. Although there are no provisions for cleaning rock filters, the estimate is that rock filters keep an accepta- ble performance for over 20 years. At worst, it might be necessary to remove the rock media, dredge out accumulated detritus, and replace the rock. The cost-effectiveness in combination with the simplicity and locally available re- sources in some areas emphasize the high replication potential of the filter. Depending on the water application requirements, a gradual treatment extension such as UV disinfection is possible and can be added (Fuhrmann and Rudolph 2006). 2.6 Reduction of pathogens and management of microbial risk Water treatment in WSPs is driven by natural processes such as solar radiation and sedimentation. The design of the ponds has a large impact on the efficiency of these natural processes in the removal of faecal bacteria. Often the effluent of WSPs does not comply with quality standards. The Namibian Code of Practice (DWAF, 2012) de- mands filtration and disinfection as part of the tertiary treatment steps for water reuse. Conventional disinfection such as chlorination however is often not effective due to high amounts of organic solids and ammonia. As a result, unrestricted irrigation is not possible. The Code of Practice was amended in 2012 to allow the irrigation of fodder crops without the requirement of disinfection in exceptional cases. If it can be proven that the irrigation water will not come into contact with humans or animals, a permit for exemption may be issued. The previous WSP in Outapi was not able to meet the WHO guidelines for safe water reuse and fodder crop irrigation. Based on the analysis of E.coli, the pathogen reduction was evaluated considering the different treatment steps. With pre-treatment and an upgrading of pond A1, a reduction of 97% (inflow – A1) was reached as compared to 91% reduction without pre-treatment. Further reductions provided by the ponds (from pond 2 to 4) were similar for both, trains A and B, with 99.8%. As for the reuse water storage tanks, concentrations of E.coli were still above the thresholds set out in the WHO guidelines (1.0E+03 MPN/100mL) in line B, and there might even be the danger of regrowth. A further reduction of pathogens is therefore required and can be attained by appropriate irrigation techniques. For in- stance, drip irrigation of low growing crops reduces pathogens by 2 log10 units (WHO 2006) reaching values far below the threshold (Mohr et al. 2020). | 14
2.7 Agricultural production

By the increasing frequency of droughts and decreasing rainfall, pastures become
smaller and livestock grazing becomes more difficult. This creates a substantial market
for fodder. Due to the lack of water, treated wastewater can be an important water
source in these regions and can be used in agriculture to produce fodder. That is why
we examined different scenarios including different irrigation systems, plant cultivars,
and sludge usage methods.

Soil and Fertilizers
It is recommended to use a disc harrow to crush the clods as well as plant residuals to
a depth of 10-20cm. The soil surface should be leveled for seedbed and installing the
irrigation system. In order to efficiently provide the nutrients needed by a plant, one
should first analyze the soil. If the soil contains an adequate amount of phosphorous
(P) (>15ppm), potassium (K) (>100ppm), and magnesium (Mg) (>50ppm), there is no
need for basic fertilization. On average, the deprivation amount of these substances
comes to:

P = 30 to 40kg/ha, K = 160 to 260kg/ha, Mg = 20 to 45kg/ha, Ca = 30 to 50kg/ha.

In order to measure the nitrogen (N), Nmin of the soil before planting should be included.
To produce a yield of 20t/ha dry matter (DM), we need approximately 160kg/ha N. For
higher efficiency, it is recommended to add N fertilizer to the soil twice during the
growing season.

Trial 1: Irrigation system and cultivation system
    a) Irrigation System

The irrigation systems chosen are farrow, dripper and drainage pipes. We evaluated
these systems based on three principles: 1. efficiency, 2. sustainability, and 3. low
maintenance costs (table 1).

                                                                                    15 |
Table 1: Advantages and disadvantages of different irrigation systems.
Irrigation system Advantages Disadvantages
1 Furrow: Little material required, easy High workload for the creation of the
40cm width, 25cm depth, distance to create furrows, uneven distribution of water,
between the furrows 1m between the furrows a strip of only
60cm width remains as a cultivation
area
2 Drainage pipe: Good water distribution, low Very high labor input for the installa-
110mm diameter wrapped in humidification of the soil tion, very high material costs, due to
tightly woven polyester fabric, laid surface, no pipes on the soil low water storage capacity of the
in approx. 35cm deep furrows, surface pipes, frequent irrigation is required
overlapping with soil approx.
very high labor input for irrigation,
24cm, distance between the drain-
difficult to automate
age pipes 1m
3 Drip pipe: No soil preparation neces- High costs for the material, water
Type: Agri plas, 16mm tube diame- sary (no furrows), very even pressure min. 0.5bar, drip pipes are
ter, drip rate 4l/h, 30cm drip water distribution in the stock and can hinder harvest-
distance, drip tube placed on the ing and maintenance work
simple and flexible to use,
ground surface, distance between
proven system, can be auto-
drip tubes 1m
mated
The average daily evapotranspiration in Outapi is about 5l/m² water per day. Therefore,
we will need about 50m³ of water per day to irrigate one hectare. About 470m³ of
water are provided daily by EPoNa ponds A4 and B4. Regardless of rainfall, this
amount of water is enough to irrigate about 9 hectares. Our experiment showed that a
30% reduction in irrigation water causes a severe drop in yield in the furrow irrigation
system (figure 4).
Figure 4: Dry matter (DM) yield reduction in Sorghum after applying deficit irrigation 70%
of the required water. Means followed by different letters (a, b) are significantly different
(p≤0.05, Tukey test).
| 16b) Cultivation system
Two types of fodder crops have been tested in the EPoNa project: Sorghum Bicolor and
Lucerne. The amount of yield produced in each irrigation system was different. It is
worth noting though that the differences between furrow irrigation and drip pipes were
not significant. The table below shows the amount of yield (t/ha) produced in each
irrigation system:
Table 2: Total yield (t/ha) produced in each irrigation system
Irrigation system Sorghum Lucerne
(sum of two harvests)* (sum of four harvests)
1 Furrow 99t/ha 20t/ha
2 Drainage pipe 123t/ha 20t/ha
3 Drip pipe 98t/ha 19t/ha
* Plant density: 55 seeds per m²
The yield is sold as air-dried bales of 10 to 20kg. In the rainy season when the prices
are lower than in the dry season, each 10kg bale costs 15N$ for Sorghum and 100N$
for Lucerne. In general though, planting Lucerne was not successful because large parts
of the seedlings were destroyed. This could have been due to the high temperature at
the beginning of the growing season. Additionally, Lucerne needs proper tillage, which
was not available in the region.
The first trial showed that the drip irrigation system is superior to other systems (figure
4 & table 1). Based on the results of the first trial, we designed the second trial with
the aim of using sludge and different water form pond A4 and B4. In the second trial,
we just used the drip irrigation system and Sorghum.
17 |Trial 2: Sludge application and water quality
Sludge reuse
Each year, a large amount of sludge settles in the ponds. The use of this sludge can
improve the soil and provide some of the nutrients needed by the crop. The sludge
should be composted before application. The rest of the nutrients needed by the Sor-
ghum should be provided through chemical fertilization. Applying 10 to 15t/ha of
sludge can improve soil organic matter, physical texture, and provide some of the
nutrients needed by the crop. If the sludge has more than 0.5% P and 0.2% Mg, ferti-
lizer is not needed to supply P and Mg. Sludge improves soil conditions, increases soil
organic matter, and can retain water for a longer period of time.
Table 3: Total yield (t/ha) produced in each fertilizer and water quality
Water quality Fertilizer Yield (t/ha)*
1 A4 Sludge + Chemical fertilizer 77
2 Chemical fertilizer 68
3 B4 Sludge + Chemical fertilizer 70
4 Chemical fertilizer 71
5 Tap water Sludge + Chemical fertilizer 81
6 Chemical fertilizer 69
* Means are NOT significantly different (p≤0.05, Tukey test). Plant density: 9 seeds per m²
Based on the results of the two trials, it is recommended to cultivate Sorghum Bicolor
with drip irrigation for the production of fodder in Outapi. A combination of sewage
sludge and chemical fertilizer should be used for fertilization.
| 183. Planning, operation and sustainability
3.1 Work packages and time schedule
The project management is recommended to delegate several tasks to operational ser-
vices in collaboration with an engineering consultant who shall be assisting to the
project management during the entire implementation cycle. Alternatively, the project
management may decide to carry out planning stages autonomously. Depending on
the tender obligations of the project management, the selection of a consultant may
take up to six months. It is assumed that in parallel to that, the project management
enters into an agreement with operational services for subsequent collaboration.
Once the financial planning and water reuse concept has been approved by the man-
agement, the foremost step before starting any further planning activities is to secure
the planning criteria. Existing information should be screened and complemented
by survey campaigns (terrain, flows, social and financial scope and development).
Depending on the quality of the existing information this task may take up to three
months.
Parallel to securing the planning criteria, the operational services engage in scheduling
the emptying of the ponds. This may require additional materials. It is assumed that
the emptying of the ponds and the completion of the planning tasks proposed by the
consultant will take place simultaneously.
It is assumed that from this stage onwards the project management is going to rely on
the assistance of an engineering consultant. The latter is supposed to take charge of
all relevant design phases with a particular focus on conceptual and preliminary de-
signs and subsequent detailed elaborations. Tender documentation will be another one
of his tasks. Parallel to these activities, an Environmental Impact Assessment (EIA) and
further geotechnical investigations may take place. The completion of this task package
may take up to ten months.
As soon as a tender documentation is available, a contractor may be hired. Depending
on the project management’s tender obligations, this process may take anything
between 3–12 months including tender evaluation and contractual negotiations.
Finding a contractor and starting construction activities are ventures that depend
largely on the season (rainfall) and the availability on the market. It is important to
choose a reliable contractor and to await site clearance and the availability of material
in order to enable the contractor and site supervision to provide an ongoing service.
This subtask may take up to four months. Once works are launched on a pre-emptied
pond series, completion of preliminary reception of works may be reached within
6 months’ time. Thus, one may assume that 12 months suffice for the task to be com-
pleted within the time span between contraction and reception. Once reception has
19 |been carried out, the modified installation may be serviced by staff and training may commence. It is expected that training may take up to two months. Below, work packages and time periods are presented to give a rough overview of the required implementation steps. The implementation of the pre- and post-treatment stages for the stabilization ponds require the following implementation steps: Table 4: Timeline for the implementation of the project Operational concept Operation and maintenance of the water reuse plant are recommended to reside with either the operator itself or its respective owner. In the case of the EPoNa project, operation is carried out by the operator’s own staff (OTC). Management of the agricul- tural site is facilitated by a farmer who leased the site from the operator. Concerning the operational management of the installation itself, operation and maintenance activities including recommended frequencies were identified. They should be considered as a first indicator and adjusted or refined depending on obser- vations. | 20
Table 5: Overview of personnel required for the operation and maintenance of
the treatment blocks

 Block                 Activity                                         Frequency   HR requirement

 Pumping system        Inspection of operational condition of           Weekly      Semi-skilled labor
                       suction chambers, pumps, pressure mains,
                       valves, switchboards, automation, sensors,
                       lightning protection

 Channel/Weir          Visual inspection and cleansing                  Daily       Semi-skilled labor

 Manhole               Visual inspection of lid and interior and        Weekly      Semi-skilled labor
                       cleansing

 Ladder                Visual inspection of steps and corrosive         Monthly     Semi-skilled labor
                       protection

 Structure             Visual inspection of surface, cleansing of       Weekly      Semi-skilled labor
                       platforms, basins, flumes and grids

 Shut-off device       Visual and functional check on seal/power,       Weekly      Skilled labor
                       cleansing and greasing of impulsion

 Flushing device       Functional check of units and cleansing          Weekly      Semi-skilled labor

 Retention filter      Visual inspection of inflow and outflow          Daily       Skilled/semi-skilled
                       for debris and scour. Maintenance of                         labor
                       vegetational cover, where appropriate
                       backwashing and cutting or replacement
                       of filter material

 Pond                  Visual inspection of pond aligning and dams      Weekly      Skilled/semi-skilled
                       for erosion / cracks. If applicable sealing                  labor
                       or reinforcement of earth dams. Probing for
                       sludge levels and desilting of ponds if appli-
                       cable. For anaerobic ponds the sludge level
                       should be below one fifth of total column

 Fencing and           Visual and functional inspection of gates        Weekly      Semi-skilled labor
 enclosure             and fences. If required cleansing, protection
                       and greasing.

 Paved area and roof   Visual surface inspection, sealing cracks,       Weekly      Semi-skilled labor
                       removing vegetation

                                                                                                      21 |
3.2 Framing activities, capacity development and
wastewater treatment plant partnership
The approach also includes the establishment of a so-called wastewater treatment plant
partnership (WWTPP) which represents a regional network of different operators of
wastewater treatment plants and wastewater ponds (Frick-Trzebitzky et al. 2021). The
network is intended to facilitate the exchange of information and experience with
regard to questions of operation and maintenance as well as the procurement of ma-
terials and spare parts. It also provides a platform for possible associations of operators
for the joint operation of plants in the region, in the form of special-purpose associa-
tions or other forms of municipal cooperation.
Experiences from the EPoNa project show the necessities to create synergies. Outsourc-
ing public responsibilities for the provision of services has also led to an outsourcing
of both technology and knowledge capacities thus perpetuating low levels of institu-
tional capacity within the municipalities, and creating a dependency on consultants.
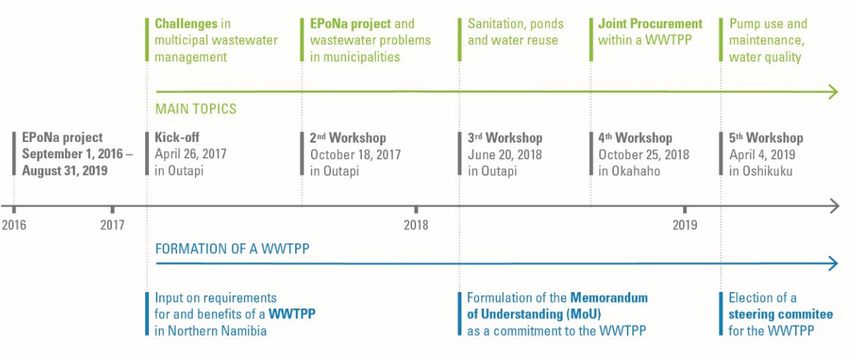
Several workshops were held in order to support the WWTPP. An overview of the
activities is presented in figure 5. The partnership that had been established offered an
opportunity for both formal and informal mutual learning. A great potential for de-
veloping and strengthening capacities and reducing municipal costs for wastewater
treatment was identified. How this can be used will depend on the long-term commit-
ment of town councils to collaborate for which political backing is crucial.
Figure 5: Timeline of workshops and formation of WWTPP (adapted based on Frick-Trzebitzky
et al. 2021)
3.3 Ownership
In order to consolidate his ownership, the system’s operator focuses on a regular
exchange of information with the project and prepares joint decisions.
The plant was finally handed over to the OTC. All the information necessary to run the
facilities are collected in order to support the operation.
| 223.4 Social-ecological impacts
It is possible that unintended effects may occur through the approach tested in the
EPoNa project. Different scenarios have been discussed and interviews with local actors
and experts have been executed in order to understand such possible effects (Zimmer-
mann et al. 2021). Intended and unintended effects of pond upgrading and fodder
production are presented in table 6. The results show that there are less negative/
unintended effects than positive/intended effects. Furthermore, good governance and
problem solving skills might help to overcome these unintended effects.
Table 6: Intended and unintended effects (based on Zimmermann et al. 2021)
Intended effects Unintended effects
Relief of ponds and improved efficiency Over-abundance of water in rainy season
Reduction of duct system failures Pipe clogging of irrigation system (algae)
Reduction of the repair efforts and blockages therefore Risk of oversupply of fodder and falling prices for
improved management of the facilities fodder
New water resources and nutrients and value creation Financial dependency between operator and farmer
Improved agricultural production, robust to climate
variability and higher yields
Less transportation effort to distribute fodder and
reduction of import dependency
Power generation
Rural development
Against the background of the current problems in dealing with WSP systems and
water supply constraints in central northern Namibia, the study has demonstrated that
an upgrade of WSP and the resulting reuse of water represent a reasonable and sus-
tainable solution. The wastewater is not only disposed of but seen as a new water
resource – thus a polluting liquid is transformed into a value benefitting people and
ecosystems. In addition, the concept reveals a completely new opportunity of water
reclamation and thence constitutes a major advantage for irrigation water supply and
relieve of water resources.
23 |4. Economic considerations 4.1 Investment The direct investment costs for upgrading the wastewater pond system within the EPoNa project are estimated to amount to 15.7 million NAD (equals approx. 984,000 EUR). The investment costs are partially allocated across guiding walls, pre-treatment with the UASB, pre-treatment with the micro sieve as well as post-treatment with the rock filter, as illustrated in the table below: Table 7: Approximate investment in the EPoNa pond system upgrade (1 EUR ~ 15.9 NAD) Est. investment expenditures 2018/19 NAD EUR Guiding walls 315,485 19,840 UASB pre-treatment 6,157,053 386,993 Micro sieve pre-treatment 6,841,151 429,991 Rock filter post-treatment 2,339,882 147,070 Total investment 15,653,570 983,882 In order to calculate depreciation, civil works are assumed to require replacement after 30 years, whereas mechanical works are expected to last 15 years and electrical works 10 years, before replacement investments are required. Accordingly, approximately 45% of investment expenditures are ascribed to civil works or are logically aligned (e.g. topographical and geotechnical assessments; design, approval and construction supervision), 39% are necessary for mechanical works and 16% for electrical works. The resulting annual depreciation is approx. 750,000 NAD (equals approx. 47,000 EUR). The investment costs outlined above apply to the implementation of the pilot pond system in the context of a scientific research project. Replicating the system without the accompanying research project and pilot character can be assumed to be less ex- pensive, especially since the construction and simultaneous operation of both UASB and micro sieve is unique to the pilot project. Additional savings can be expected because of reduced monitoring equipment and requirements. Furthermore, the invest- ment costs will vary depending on local conditions, market prices and scale of the pond system. In a scenario analysis, the expenses that are specific to the research character of the pilot system and the investment costs for replicating the pond system with comparable characteristics were estimated and compared. The first option is the one described above and includes all accrued costs. In option 2, costs for UASB and | 24
micro sieve are divided, and research specific costs are no longer included. Option 3
considers the upgrade of both pond lines with either UASB or micro sieve without
research cost and introduces lessons learned and further improvements. For example,
the investments without UASB would amount to roughly one third less (approx.
600,000 EUR). Further details can be found in the final project report.

4.2 Operation and maintenance costs and revenues
The upgrade of the sewage treatment ponds within the EPoNa project entails additional
operation and maintenance costs for the operation of coarse bar, UASB, micro sieve
and rock filter as well as general purpose expenses (e.g. ablution building). These
additional expenses comprise salaries for additional staff (guard), electricity costs, con-
sumables (e.g. chemicals, process water), repairs and maintenance as well as monitor-
ing. Estimated annual expenses for the first operative year of the pond system are
illustrated below:

Table 8: Approximate operative expenditures in the first year of operation
(1 EUR ~ 15.9 NAD)

 Est. operative expenditures 2019/20        NAD                  EUR

 Labor                                                  60,000              3,771

 Power                                                  58,250              3,661

 Consumables                                            31,310              1,968

 Repairs and maintenance                               445,838             28,023

 Monitoring                                            150,000              9,428

 Total operative expenditures                          745,398            46,851

Analogous to investment cost, the additional costs for operation and maintenance as
outlined above apply to the implementation of the pilot pond system in the context of
a scientific research project. Replicating the system without the accompanying research
project and pilot character can be assumed to be less expensive, especially since the
simultaneous operation of both UASB and micro sieve is unique to the pilot project.
Depending on the current HR situation it might be necessary to hire an additional
technician which would increase operational expenses. Savings can be expected from
decreased monitoring requirements. By deducting operational expenses that are spe-
cific to the research character of the pilot system, operation and maintenance costs for
replicating the pond system with comparable characteristics are calculated and done
in a separate analysis as described above.

                                                                                     25 |
Additional revenues are generated through the potential sale of produced irrigation water to agricultural sites. The sludge produced from the micro sieve is being trans- ferred to a fermenter (located at the Oswin O. Namakalu Sanitation and Reuse Facility in Outapi) where electricity is generated from it which is a potential source of revenue or reduction of electricity cost. Furthermore, the upgrade prevents future penalty pay- ments due to overflowing of the evaporation pond. 4.3 Cost-benefit analysis The Cost-Benefit Analysis (CBA) is an approach to systematically evaluate the desira- bility of a project. To do so, a monetary value is assigned to all inputs and outputs into a system and so it can be determined whether there is an overall positive or negative system outcome. The CBA can be expressed in different ways, for example, the internal rate of return, the net present value and the cost-benefit ratio (Europäische Kommission 2003). The wastewater treatment plant’s CBA is conducted based on the changes in operation and maintenance costs, plus necessary investments for the upgrade which are then compared to the possible revenues as described above. In figure 6 the required revenue per cubic meter over ten years for option 1 as well as option 2a (2x UASB) and option 2b (micro sieve) is depicted. When these revenues are generated by irrigation water, the cost of the upgrade are covered. For a first comparison, the Outapi water tariffs can be used. The rate for a small busi- ness is 16.33 NAD per cubic meters of water which is lower than option 1 but higher than both options 2. It can also be assumed that the required revenue will continue to decrease in the third option. | 26
Figure 6: Required revenue per m³ irrigation water to cover pond line A upgrade expenditures

To include all economic costs and benefits regardless of the beneficiary in the CBA,
shadow prices are used. When converting market prices to shadow prices, external
factors such as environmental and social effects can be included. The cost of natural
resources can be converted with a determined factor as well as wages and the possible
reduction of methane emissions can be included in the calculation. Furthermore,
aspects such as local business development are raised. Effects that can’t be directly
quantified or to which no monetary value can be attributed (e.g. reduced health risk,
increased food security, increased attractiveness of the city in general) are described in
the final project report which also goes for the final results of the described scenarios.

4.4 Financing options

When planning to replicate a system such as EPoNa, the financing of the project, with
the investments as a decisive factor, is a crucial element to influence the annual capital
cost. In the case of the EPoNa pilot plant, the initial investment was fully covered by
a donor (German Federal Ministry of Education and Research) which, as mentioned
above, is why the calculation does not include financing costs that may constitute
a considerable amount.

In a replication case, these costs need to be considered according to the chosen financ-
ing option. There are multiple financing options and sources for the replication of
a pond system with comparable characteristics. Some of the possibilities are:

                                                                                               27 |
1. Public (national, provincial, municipal) loans and grants,
2. Loans from development financing institutions, mostly from national, regional
or multilateral donor banks
3. Commercial loans, private loans or
4. Combinations of the above: hybrid financing (Hilbig und Rudolph 2019).
Besides the initial financing of the project, the continuing operation and maintenance
needs to be sustainable. Twinning within the realm of municipal partnerships3 such as
the GWOPA4 or entering into partnerships with municipal operators5 may provide
helpful consultancy during the stage of research and development. Furthermore, there
are NGOs or public water enterprises willing to help free of charge.
However, in the long run, sustainable operation and maintenance needs a professional
business concept. To ensure requirements for wastewater treatment and reuse can be
fulfilled independently from political disruptions and budget uncertainties, an auton-
omous (“ring-fenced”) body can be formed. Small towns and villages can unite to
establish a common ring-fenced of appropriate size, serving > 50,000 people to achieve
“economy of scale”-effects in procurement and operations.
3 https://www.adb.org/publications/water-operators-partnerships-twinning-utilities-better-services
4 https://gwopa.org/
5 Kommunale Betreiber-Partnerschaften: https://skew.engagement-global.de/aktuelle-mitteilung/be-
treiberplattform-kommunale-wasserunternehmen.html
| 285. Transfer and dissemination
The EPoNa concept offers a high potential for transfer and implementation. First of all,
the proposed infrastructure provides irrigation water and resources for agriculture
while minimizing environmental impacts which benefits the need for resource efficient
concepts and fodder production for livestock in northern Namibia and Sub-Saharan
Africa in general. Since northern Namibia is highly dependent on fodder supply from
other parts of the country, the EPoNa concept combines the advantages of local water
reuse and fodder production.
5.1 Initial transfer projects
No transfer projects have been initiated yet. However, following the successful imple-
mentation of the concept in Outapi, a potential for a transfer to other cities in Namibia
as well as the SADC region can be seen. The experiences gained within the EPoNa
project might offer a strong incentive to initiate follow-up projects. Support for form-
ing wastewater treatment plant partnerships was provided during five workshops (see
chapter 3.3) with the aim to encourage the transfer of the project to other regions.
5.2 Suitable areas for dissemination
The transferability of water reuse systems was assessed by using transfer criteria
(Juschak 2014). These criteria were used to find out to what extent countries and areas
in southern Africa are suitable for a system similar to the one in Outapi. The results
show that countries such as Botswana, Namibia and South Africa are most suitable.
These countries reached highest scores for indicators such as literacy rate, ability to
pay, government effectiveness, and ease of doing business. Further results assessing
population density, the occurrence of floods, and the suitability of soil and climate for
agriculture at a local level show regions that are potentially suitable for a transfer of
the EPoNa concept. This regional assessment shows that towns in Namibia (Windhoek,
Okahandja, Rundu), a few regions in southern Botswana (Ramatlabama, Gaborone),
and substantial sections of the eastern coast of South Africa, as well as several areas
in the country’s interior (e.g. regions around Johannesburg and Pretoria) are suitable
for the dissemination of the concept. Preconditions supporting the implementation of
the EPoNa concept are introduced in chapter 5.4, table 9, success factors.
29 |5.3 Networks and partners for dissemination Transfer options were discussed in the project team. Regular meetings took place especially among TU Darmstadt, ISOE, Aqseptence, University Geisenheim und IEEM. Furthermore, regular exchanges between the EPoNa project team and the Namibian partners (especially OTC, MAWF) enabled rapid action with regard to changes that arose during the work process. Platforms for promoting the EPoNa concept are at a national (e.g. Basin Management Committees, WATSAN Forum) and international level (e.g. Global Water Partnership, SADC Water Division, Sustainable Sanitation Alliance/SuSanA, Water Supply & San- itation Collaborative Council). Moreover, the GIZ Transboundary Basin Management Committees are a good network for approaching neighboring countries. 5.4 Success factors and benefits of the approach In general, the evaluation of the effects (see chapter 3.5) showed that the intended or positive effects clearly outweigh the unintended ones. A further scenario analysis revealed the consequences of inadequate management of the system and low fodder demand. If, independently of other factors, there is a low demand for fodder in the respective area, alternative water reuse applications have to be considered. In addition, the analysis showed that good management of such a system is of fundamental im- portance in order to operate the facility, protect nature and assist people. For similar future projects, the key factors for success are (Liehr und Kluge 2018): 5. the development of trust and confidence among all involved parties, 6. the combination of technological and social innovations, 7. the promotion of capacity development and multiplication of the proposed tech- nologies and 8. flexible thinking that is not attached to linear planning. Furthermore, the transferability of the concept was investigated with the help of inter- views. Actors and experts involved in the project and from neighboring communities mentioned the following success factors (table 9) and benefits of the approach (table 10): | 30
Table 9: Success factors for transferability

                Criteria                               Short description

 Natural        Water scarce region                    The region experiences long periods of drought which
 conditions                                            increases the urgency to act.

                No discharge option                    The absence of a river makes it even more crucial to think
                                                       of alternatives for water disposal.

 Demographics   Need for animal fodder =               Animal fodder is requested, especially during the dry season.
                Agricultural production

                Growing towns                          The towns are growing and therefore also produce growing
                                                       amounts of wastewater.

                Sparsely populated                     Availability of land to produce agricultural goods
                surroundings

 Structure      WWTPP                                  The structure of the partnership will be an advantage for
                                                       those towns in the region that follow the example of Outapi.

                Successful role model                  The power of a good reputation of the already existing
                                                       approach in Outapi

                Ponds are ubiquitous in Namibia and    The ponds exist in many parts of the world. They are
                developing countries.                  ubiquitous in the northern part of Namibia.

                Local authorities welcome solutions.   The local authorities see the need to improve the
                                                       management of wastewater.

                Skilled workers (farmers)              There are already people who practice agriculture in
                                                       the region.

                Shifting focus                         The focus is shifting towards water demand management,
                                                       which also includes wastewater reuse.

                                                                                                        31 |
You can also read


