BURNABY MOUNTAIN GONDOLA TRANSIT - FEASIBILITY STUDY - TRANSLINK
←
→
Page content transcription
If your browser does not render page correctly, please read the page content below
Burnaby Mountain Gondola Transit –
Feasibility Study

Prepared for

TransLink

April 2018

CH2M HILL Canada Limited
Metrotower II, Suite 2100
4720 Kingsway
Burnaby, BC V5H 4N2

 This report has been prepared for the South Coast British Columbia Transportation Authority (TransLink) by CH2M HILL Canada Limited.
Executive Summary
In 2009, an initial feasibility study commissioned by Simon Fraser University (SFU) Community Trust, the
authority developing the UniverCity community, indicated that a gondola as a transit alternative to
diesel bus service could improve travel time, service frequency, reliability, and reduce greenhouse gas
(GHG) emissions.
On the basis of that finding, in 2011, the South Coast British Columbia Transportation Authority
(TransLink) commissioned CH2M HILL Canada Limited (CH2M) to conduct a full business case, assessing
alternative transit technologies, route options, costs, and benefits. The 2011 business case identified a
preferred solution: a 2.7-kilometre (km) alignment from Production Way-University SkyTrain Station to
the SFU Town Square and transit loop on Burnaby Mountain, using 3S gondola technology.
In 2011, the Burnaby Mountain Gondola Transit (BMGT) project was estimated to cost $114 million to
build and $3 to $3.5 million per year to operate. It was demonstrated that the benefits of the gondola
clearly outweighed the costs. However, due to constrained capacity for new capital spending on regional
transit, no further action was taken.
In 2017, TransLink retained CH2M to conduct a feasibility study to confirm whether the findings of the
2011 business case remained valid, and to assess an alternative alignment. This updated 2017
assessment finds that there is still a compelling case for replacing current diesel bus service with a
gondola transit alternative.

Changing Circumstances
Continued Growth and Persistent Challenges
Reliable transit service to Burnaby Mountain remains a significant challenge. With a daytime SFU
population of 20,000 students, faculty and staff, and a UniverCity population that has increased from
3,000 in 2011 to 5,000 in 2017 (projected to be 9,000+ within the next 5 years), the transit system
generates more than 25,000 trips each day. Peak-hour travelers report that as many as four full buses
pass them by before they can board – which results in a 15-minute bus journey becoming a more than
30-minute trip. The diesel buses have difficulties operating a vertical climb of nearly 300 metres, and
emit an estimated 1,700 tonnes of GHGs per year, including a range of Criteria Air Contaminants (CACs).
Additionally, winter snowstorms halt the service altogether for an average of 10 days per year, not only
disrupting classes, exams and research at SFU, but also stranding UniverCity community members at
considerable inconvenience and expense. These challenges will only grow over the coming decade as
SFU enrollment rises to an estimated 30,000 students and the full 10,000 resident community of
UniverCity is established.

An Updated Planning Regime
In the 10-Year Vision from 2014, the Mayors’ Council on Regional Transportation noted the growing
transit demand on Burnaby Mountain. It was identified that a high-capacity connection linking Burnaby
Mountain to a nearby SkyTrain station may be required (subject to the business case, public and
stakeholder consultation, funding, partner contributions, and achievement of other initiatives contained
in the 10-Year Vision). Through partnership between Federal, Provincial, and local levels of government,
in 2016, funding for Phase One of the 10-Year Vision was approved. The approval included direction to
update the 2011 business case for a high-capacity transit connection between Burnaby Mountain and
SkyTrain which would establish whether the business case supports the inclusion of the BMGT project in
a future investment plan.

SL0331171125VBC                           CH2M HILL CANADA LIMITED                                     ES-1
EXECUTIVE SUMMARY

Trans Mountain Pipeline and Tank Farm Risk Avoidance
SFU and the SFU Community Trust are concerned about the risk to safety and security posed by the
Federal approval in 2016 of the Trans Mountain Expansion Project (TMEP) (a twining of the pipeline
from Edmonton to Burnaby) and the related tripling of capacity at the Trans Mountain Pipeline ULC
(Trans Mountain) tank farm on Burnaby Mountain. In response, SFU engaged RWDI Consulting Engineers
and Scientists Inc. to review Trans Mountain’s plans, and their study found that if an incident at the tank
farm cut off access to Gaglardi Way and Burnaby Mountain Parkway a gondola could provide a safe
evacuation option for Burnaby Mountain students, staff, and residents.

Updated Assessment: Key Findings
Technology and Alignment
The 2011 business case considered a number of ground-based and aerial transit options, and settled on
the 3S gondola technology as the preferred solution to connect Burnaby Mountain to SkyTrain. Benefits
of a 3S gondola system include the ability to operate in high wind conditions, provide sufficient capacity,
and utilize less energy, which results in lower operating costs. For the 2017 update, two aerial ropeway
suppliers were consulted to determine if there had been any advancement in technology that should be
considered, and they confirmed that 3S technology remains the best option.
As to the alignment, the 2011 business case considered several options, including straight-line service
from various SkyTrain stations, but settled on Production Way-University Station as the closest and the
most convenient for the largest number of potential users.
For the 2017 update, public concern regarding service travelling over the residential neighbourhood of
Forest Grove was addressed. Two aerial ropeway suppliers were asked to provide cost estimates for
both a direct route and a “kinked” alignment that would dog-leg around the homes. The “kinked”
alignment would prove to be longer (3.4 km as opposed to 2.7 km for the straight route), slower
(9 minutes as opposed to 6 minutes), more expensive to build (up to $255 million compared to $197),
and more expensive to operate ($5.3 million compared to $4.1). Given this, the direct route remains the
preferred alignment.

Ridership Forecasts and Design Capacity
TransLink has implemented improvements to its forecasting tools since the 2011 business case, and the
new models indicate future ridership potential of approximately 2,600 passengers per hour per direction
(pphpd). The models also predict that a gondola has the potential to increase ridership when compared
to the continuation of diesel bus service.
Aerial ropeway suppliers suggested that capacity requirements would best be met using 33-passenger
cabins travelling with gaps of less than 1 minute and taking 6 to 7 minutes to complete a trip that today
takes 15 minutes by bus. While a target capacity of 3,000 pphpd might be adequate through 2045, it may
be prudent to design tower foundations and size the key gondola components, such as the cables and the
drive-train motor, to a standard that would accommodate up to 4,000 pphpd, if needed beyond 2045.
While this would add cost in the immediate term, it would be prohibitively expensive to try to rebuild or
move towers and upgrade the gondola system in the future if travel demand were to outpace forecasts.

Capital and Operating Costs
Estimates of capital and operating costs have increased since the 2011 business case. General inflation is
one reason, but the largest factor is estimated property costs, which have grown substantially over the
past several years. The estimated cost of civil works, such as the terminal buildings and tower
foundations, have also increased based on a higher level of design requirements for these structures

ES-2                                      CH2M HILL CANADA LIMITED                           SL0331171125VBC
EXECUTIVE SUMMARY

provided by aerial ropeway suppliers. In all, the updated capital cost for 3S gondola technology on the
direct route from Production Way-University Station to the SFU Town Square and transit loop, is now
$197 million in 2020 dollars (2020$), up from $114 million (in 2011 dollars [2011$], or approximately
$136 million adjusted to 2020$). The total annual operations and maintenance (O&M) are on par with
the 2011 business case estimate of $3 to $3.5 million per year (in 2011$, or $3.6 to $4.2 million adjusted
to 2020$) to an estimate of $4.1 million per year (in 2020$) for the direct route.
It is assumed that bus service from Production Way-University Station to Burnaby Mountain would be
replaced by the gondola service, thereby providing some bus capital and operating cost savings to offset
BMGT project costs. It is estimated that TransLink will be able to reclaim $34.5 million in vehicle
replacement expenses (from the buses removed from service) and a 25-year reduction of $89.3 million
in bus operations.
The capital cost, adjusted to $193 million for an 18-month construction period, less the reclaimed transit
capital cost value of $34.5 million is $158.5 million. The transit operating cost of the gondola is
$54.2 million less the bus operating costs of $89.3 million without the gondola. Summing the capital and
operating costs for a total of $123.4 million.

Consumer Benefits
This 2017 update estimated the monetary value of benefits which would accrue to transit users, the
general public, and TransLink, if gondola service were put in place to connect Burnaby Mountain to
SkyTrain. It is estimated that the value of consumer benefits would equal approximately $225.3 million
over a 25-year period. Most of these benefits would be related to travel-time savings, but savings
related to vehicle operating costs, collision reductions, parking costs, and vehicle emissions could also be
expected.
Comparing the cost of $123.4 million for construction and 25 years of operation to a total benefit of
$225.3 million, reveals a benefit-cost ratio (BCR) of 1.8. This demonstrates that the overall benefits of
the BMGT project would outweigh its costs.

Conclusion
The 2017 feasibility study reveals that a gondola service from Production Way-University Station to the
SFU Town Square and transit loop on Burnaby Mountain still has merit. Further work can be done to
advance project planning and refine cost estimates, including work related to identifying and mitigating
environmental and community impacts. Additional public and stakeholder engagement will be an
important next step, as well as engaging senior levels of government and other possible funding partners.

SL0331171125VBC                            CH2M HILL CANADA LIMITED                                         ES-3
Contents
Section                                                                                                                                         Page
Acronyms and Abbreviations............................................................................................................. V
Introduction...................................................................................................................................1-1
       1.1      Background ...................................................................................................................... 1-1
       1.2      Purpose ............................................................................................................................ 1-2
Strategic Alignment and Priority .....................................................................................................2-1
       2.1     Regional Context .............................................................................................................. 2-1
               2.1.1 Mayors’ Council 10-Year Vision .......................................................................... 2-1
               2.1.2 Phase One of the 10-year Vision: 2017-2026 Investment Plan .......................... 2-2
       2.2     Local Context ................................................................................................................... 2-2
               2.2.1 Trans Mountain Expansion Project ..................................................................... 2-3
               2.2.2 Transit Service Changes ...................................................................................... 2-3
Project Purpose and Goals ..............................................................................................................3-1
       3.1    Transportation ................................................................................................................. 3-1
              3.1.1 Transportation Project Objectives ...................................................................... 3-1
       3.2    Financial ........................................................................................................................... 3-2
              3.2.1 Financial Project Objectives ................................................................................ 3-2
       3.3    Environmental.................................................................................................................. 3-3
              3.3.1 Environmental Project Objectives ...................................................................... 3-3
       3.4    Urban Development ........................................................................................................ 3-3
              3.4.1 Urban Development Project Objectives ............................................................. 3-3
       3.5    Economic Development ................................................................................................... 3-3
              3.5.1 Economic Development Project Objective ......................................................... 3-4
       3.6    Social and Community ..................................................................................................... 3-4
              3.6.1 Social and Community Project Objectives .......................................................... 3-4
       3.7    Deliverability .................................................................................................................... 3-5
              3.7.1 Deliverability Project Objectives ......................................................................... 3-5
Ridership Forecasts ........................................................................................................................4-1
       4.1     Background ...................................................................................................................... 4-1
       4.2     Model Scenarios .............................................................................................................. 4-1
       4.3     Future Year Ridership Projections ................................................................................... 4-1
               4.3.1 Land-use Projections........................................................................................... 4-1
               4.3.2 Network Changes ................................................................................................ 4-2
               4.3.3 Forecasts ............................................................................................................. 4-2
       4.4     Ridership Forecast Conclusion ......................................................................................... 4-4
Alternative Alignment Assessment .................................................................................................5-1
       5.1      Alignment Evaluation ....................................................................................................... 5-1
       5.2      Alignment Conclusion ...................................................................................................... 5-2
Alternative Technology Assessment................................................................................................6-1
       6.1     Technology Evaluation ..................................................................................................... 6-1
       6.2     Operations and Maintenance .......................................................................................... 6-1
       6.3     Safety, Security and Privacy ............................................................................................. 6-2
       6.4     Technology Conclusion .................................................................................................... 6-2

SL0331171125VBC                                             CH2M HILL CANADA LIMITED                                                                   i
CONTENTS
Section Page
Updated Cost Estimates .................................................................................................................7-1
7.1 Capital Costs..................................................................................................................... 7-1
7.1.1 Aerial Ropeway System ...................................................................................... 7-1
7.1.2 Civil Works .......................................................................................................... 7-1
7.1.3 Reclaimed Transit Capital Cost ........................................................................... 7-1
7.1.4 Private Land Purchases ....................................................................................... 7-2
7.2 Operations and Maintenance Costs ................................................................................ 7-3
7.2.1 Asset Renewal Costs ........................................................................................... 7-3
7.2.2 Bus Operations and Maintenance ...................................................................... 7-4
7.3 Agency Lifecycle Project Costs ......................................................................................... 7-4
Updated Quantification of Benefits ................................................................................................8-1
8.1 Consumer Benefits........................................................................................................... 8-1
8.1.1 Assumptions........................................................................................................ 8-1
8.1.2 Consumer Benefits Calculation ........................................................................... 8-1
8.2 Agency Benefits ............................................................................................................... 8-2
8.2.1 Delayed or Avoided Capital Investments............................................................ 8-2
8.3 Qualitative Benefits ......................................................................................................... 8-2
8.3.1 Transportation Reliability ................................................................................... 8-2
8.3.2 Recreation and Tourism...................................................................................... 8-3
8.3.3 Land Use.............................................................................................................. 8-3
Benefit Cost Summary ....................................................................................................................9-1
9.1 Timing Assumptions ......................................................................................................... 9-1
Updated Regulatory Requirements ............................................................................................... 10-1
10.1 Environmental Requirements ........................................................................................ 10-1
10.1.1 Follow-up Activities........................................................................................... 10-5
10.2 Safety Requirements...................................................................................................... 10-5
10.2.1 Standards and Regulations ............................................................................... 10-5
10.2.2 Permits, Licencing, and Certification ................................................................ 10-5
10.3 Customer Requirements ................................................................................................ 10-5
Recommendations and Next Steps ............................................................................................... 11-1
11.1 Remaining Uncertainties and Additional Technical Work ............................................. 11-1
11.1.1 Ridership Forecast Refinement......................................................................... 11-1
11.1.2 Geotechnical Assessment and Foundation Refinement ................................... 11-1
11.1.3 Design and Costing Refinements ...................................................................... 11-1
11.1.4 Utilities .............................................................................................................. 11-1
11.1.5 Visual Impact Assessment................................................................................. 11-1
11.2 Next Steps ...................................................................................................................... 11-2
References ................................................................................................................................... 12-1
ii CH2M HILL CANADA LIMITED SL0331171125VBCCONTENTS
Section Page
Tables
4-1 Forecast Gondola Ridership (AM Peak Hour) ............................................................................... 4-4
5-1 Alignment Evaluation Summary ................................................................................................... 5-2
6-1 Alternative Technology Evaluation Summary ............................................................................... 6-1
7-1 Bus Operations and Peak Fleet Savings ........................................................................................ 7-2
7-2 Bus Service Assumptions (Annual Service Hours)......................................................................... 7-2
7-3 Capital and Operating Cost Estimates (2020$, millions) .............................................................. 7-3
7-4 List of Major Maintenance Items for Rehabilitation..................................................................... 7-3
7-5 Burnaby Mountain Gondola Transit Life Cycle Costs (2020$) ...................................................... 7-4
8-1 Consumer Benefits Key Assumptions ........................................................................................... 8-1
8-2 Consumer Benefits Estimate (2020$, millions) ............................................................................. 8-2
9-1 Notional Timing Assumptions ....................................................................................................... 9-1
9-2 Project Costs (2020$, millions) ..................................................................................................... 9-1
9-3 Project Benefits (2020$, millions) ................................................................................................. 9-2
9-4 New Benefit Cost Ratio ................................................................................................................. 9-2
10-1 Analysis of Environmental Assessment Options ......................................................................... 10-1
10-2 List of Applicable Permits............................................................................................................ 10-3
11-1 Association for the Advancement of Cost Engineering Cost Estimate Classification Matrix
for Process Industries.................................................................................................................. 11-2
Figures
2-1 Map Illustrating Mayors’ Council Vision ....................................................................................... 2-2
4-1 SFU and UniverCity Land Use Projections..................................................................................... 4-2
4-2 Transit Screenlines ........................................................................................................................ 4-3
4-3 AM Peak Hour Ridership Forecasts across Screenlines 1 and 2 ................................................... 4-3
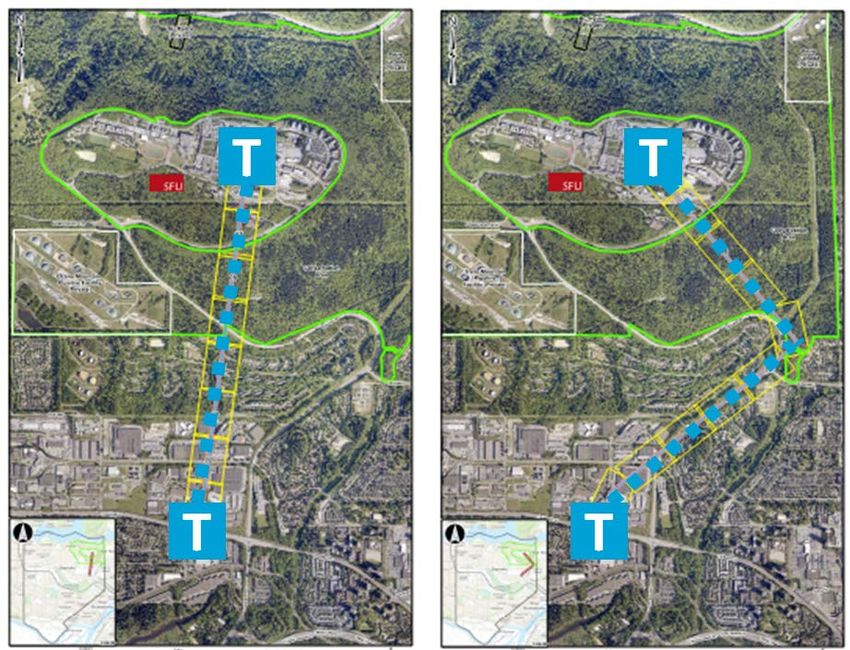
5-1 Alternative Alignments: Option 1 (left) and Option 2 (right) ....................................................... 5-1
SL0331171125VBC CH2M HILL CANADA LIMITED iiiAcronyms and Abbreviations 3S three rope gondola system (also known as drei seil and Tricable Gondolas) APC automatic passenger counter BAU Business-As-Usual BC EAA British Columbia Environmental Assessment Act BC EAO British Columbia Environmental Assessment Office BCR benefit-cost ratio BCSA British Columbia Safety Authority BMGT Burnaby Mountain Gondola Transit BMGT project Burnaby Mountain Gondola Transit Project BC MoTI British Columbia Ministry of Transportation and Infrastructure CAC criteria area contaminant CEA Agency Canadian Environmental Assessment Agency CEAA 2012 Canadian Environmental Assessment Act 2012 CH2M CH2M HILL Canada Limited EA Environmental Assessment GHG greenhouse gas km kilometre(s) km/h kilometres per hour Mayors’ Council Metro Vancouver Mayors’ Council on Regional Transportation MDG monocable detachable gondola NEB National Energy Board NPV Net Present Value O&M Operations and Maintenance PGL PGL Environmental Consultants pphpd passenger(s) per hour per direction RTM Regional Transportation Model SFU Simon Fraser University SoGR state-of-good-repair TMEP Trans Mountain Expansion Project TransLink South Coast British Columbia Transportation Authority Trans Mountain Trans Mountain Pipeline ULC SL0331171125VBC CH2M HILL CANADA LIMITED V
SECTION 1

Introduction
1.1 Background
A 2009 feasibility study concluded that replacing diesel bus service to Burnaby Mountain with an aerial
passenger ropeway (or aerial gondola) was a cost-effective means to improve travel time, service
frequency, and reliability, and to reduce greenhouse gas (GHG) emissions. On that basis, in June 2010,
the South Coast British Columbia Transportation Authority (TransLink) committed to further
investigating the merits of aerial ropeway technologies and to developing a business case for improved
transit service to Burnaby Mountain.
In 2011, TransLink published the Burnaby Mountain Gondola Transit (BMGT) Business Case Report and
its companion document, the BMGT Technology and Alignment Alternatives Assessment (TransLink,
2011a; 2011b). Key findings of the 2011 studies were as follows:
•   There was a clear need to investigate an alternative transit solution at Burnaby Mountain to deliver
    more reliable service to the growing Simon Fraser University (SFU) campus and UniverCity
    community, while reducing environmental impacts and managing future capital and operating costs.
•   Aerial-ropeway technologies, particularly three-rope gondola systems (3S) and Funitel gondolas,
    showed the greatest potential to meet the Burnaby Mountain Gondola Transit (BMGT) project’s (the
    BMGT project) multiple (transportation, financial, environmental, urban development, social and
    community, and deliverability) objectives and to minimize negative impacts.
•   A direct route from Production Way-University SkyTrain Station to the SFU Town Square and transit
    loop emerged as the preferred option when considering the combined factors of system efficiency,
    residential impact, environmental impact, and affordability.
•   The capital cost of a gondola system was estimated to be on the order of $114 million (2011 dollars
    [2011$]), which included a high-level cost allowance for property acquisition and risk. Annual
    operating costs were estimated to be approximately $3 to $3.5 million (2011$).
•   Over the 25-year evaluation period, the life-cycle costs were estimated to be approximately
    $10 million (2011$) higher than the estimated costs of maintaining and expanding the bus service to
    Burnaby Mountain. However, when considering travel time savings, avoided vehicle operating and
    collision costs, and environmental benefits, the BMGT project yielded a benefit-cost ratio (BCR) of 3.6.
•   The BMGT project could be built cost-effectively using either Design-Build plus Operate-Maintain in
    a joint procurement, or Design, Build, Finance, Operate, and Maintain strategies. A traditional
    design-build procurement with TransLink assuming operations and maintenance (O&M) was also
    considered feasible.
The 2011 BMGT business case was developed at a time when funding sources (namely transit fares,
property taxes, and vehicle fuel taxes) were constrained. This prevented any significant expansion of
transit service to serve growing population and travel demands. At the same time, other regional rapid
transit priorities emerged (including projects along the Broadway Corridor and in the South of Fraser).
Therefore, despite the advantages, additional planning and design work for the BMGT project was put
on hold.

SL0331171125VBC                            CH2M HILL CANADA LIMITED                                       1-1
SECTION 1 – INTRODUCTION
1.2 Purpose
There have been a number of changes to the regional and local land-use and transportation context that
directly and indirectly influence the business case for a gondola at Burnaby Mountain since the original
business case was completed in 2011. These changes include, but are not limited to: new regional
direction for future transportation investments, changes to the transit and transportation networks,
improvements to the Regional Transportation Model (RTM), plans to expand the Trans Mountain
Pipeline, and continued growth in the real estate market.
In response to these changes, TransLink retained CH2M HILL Canada Limited (CH2M) to conduct a
feasibility study which would review assumptions and undertake the necessary technical analyses to
update the 2011 report. The revised costs and benefits will enable TransLink to assess the merits of
including the BMGT project in upcoming investment plans.
As part of this process, CH2M considered key themes from stakeholder and public feedback that were
captured during the Burnaby Gondola Phase II
Consultation and Communication Program in
Stakeholder and Public Consultation
2011. The feedback included: (November 2010 to June 2011)
• Resident concerns regarding privacy, • Project Advisory Committee, chaired by TransLink, was
safety, noise, and neighbourhood established and comprises the BC Ministry of
character Transportation and Infrastructure (BC MoTI); City of
Burnaby; SFU; and SFU Community Trust.
• Potential environmental impacts on trees
and wildlife in the conservation areas • Key stakeholder groups were engaged to provide general
information on the BMGT project status and to garner
• Support for faster and more reliable initial feedback.
transit service with reduced GHG
emissions • Two open houses were held to raise awareness about the
proposed project, provide information, and solicit
• Safety and security concerns for riders participation and feedback from the community.
• BMGT project cost and its relationship to
the Millennium Line-Evergreen Extension
1-2 CH2M HILL CANADA LIMITED SL0331171125VBCSECTION 2 Strategic Alignment and Priority There have been a number of changes to the Regional and local land-use and transportation context surrounding the BMGT project since the original business case was completed in 2011. 2.1 Regional Context 2.1.1 Mayors’ Council 10-Year Vision In February 2014, the BC MoTI asked the Metro Vancouver Mayors’ Council on Regional Transportation (Mayors’ Council) to confirm its vision for transportation in the region. The Mayors’ Council—with support from TransLink, Metro Vancouver, and member municipalities—developed Regional Transportation Investments – a Vision for Metro Vancouver (Mayors’ Council, 2014). This 10-year Vision document established spending priorities, recommended new funding mechanisms, and outlined a phased implementation plan. The 10-year Vision was structured around three key strategies: 1. Prioritizing the most urgent and effective infrastructure investments 2. Identifying a more consistent approach to pricing transit and roads as the most cost-effective way to reduce congestion and overcrowding 3. Partnering to ensure effective coordination of land-use plans and transportation investments Figure 2-1 shows a map of priority projects, including critical upgrades to keep existing infrastructure in a state-of-good-repair (SoGR), as well as expansion of bus and rail rapid transit service, new bridge crossings, and improvements through the Major Road Network and Bicycle Minor Capital Program. It was also noted that a high-capacity connection from Burnaby Mountain to a nearby SkyTrain station may be required, and that further investigation and consultation was needed. It was identified that the project could be advanced subject to the business case, funding, partner contributions and achievement of other initiatives contained in the 10-Year Vision. SL0331171125VBC CH2M HILL CANADA LIMITED 2-1
SECTION 2 – STRATEGIC ALIGNMENT AND PRIORITY
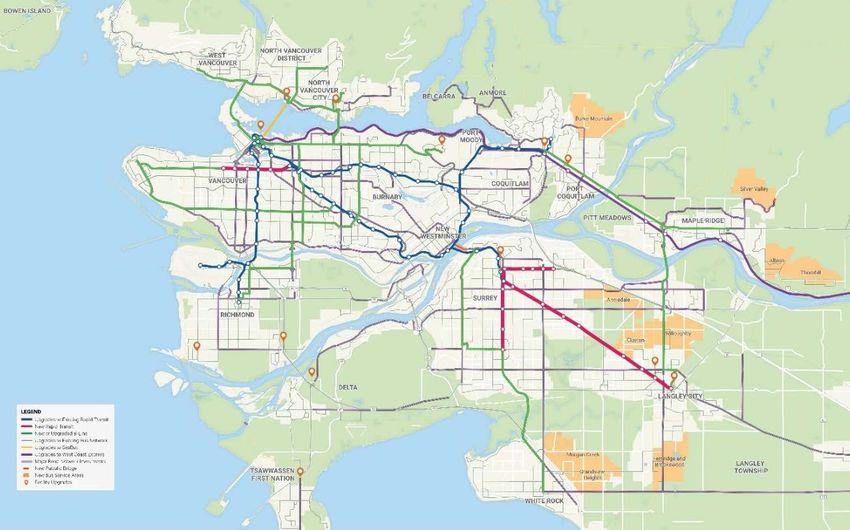
Figure 2-1. Map Illustrating Mayors’ Council Vision
Provided by TransLink April 28, 2017
2.1.2 Phase One of the 10-year Vision: 2017-2026 Investment Plan
In June 2016, the three levels of government came together to announce “Phase One” funding for the
Mayors’ Vision – $741 million of capital funding 1 dedicated to priority public transit projects, including
the following: SoGR initiatives, new vehicles, and business cases for rapid transit projects in Vancouver
and Surrey. As part of that announcement, the Federal government committed to increase its share of
capital funding for major projects to 50 percent, reducing the region’s share to 17 percent.
During public and stakeholder engagement (October 11 to 31, 2016), Metro Vancouver residents
expressed broad support for the transit and transportation improvements in the Phase One Plan.
Delivering all of the transit and road improvements in the 10-Year Vision will require additional
investment and planning. Over the coming years, additional investment plans are anticipated to be
brought forward to the TransLink Board and the Mayors’ Council for consideration.
The Phase One Plan refers to updating the 2011 assessment of a high-capacity transit connection
between SkyTrain and Burnaby Mountain campus, to establish whether the business case supports its
inclusion in a future investment plan.
2.2 Local Context
At the local scale, there has been continued development atop Burnaby Mountain and around
Production Way-University Station. This development is generally in keeping with SFU, SFU Community
Trust, and City of Burnaby plans identified in the original 2011 business case report.
However, two key changes have emerged since 2011: approval of the Trans Mountain Expansion Project
(TMEP), and opening of new transit services that alter travel patterns.
1 Comprised of $370 million Public Transit Infrastructure Fund Federal plus $246 million Provincial plus $125 million from TransLink
2-2 CH2M HILL CANADA LIMITED SL0331171125VBCSECTION 2 – STRATEGIC ALIGNMENT AND PRIORITY
2.2.1 Trans Mountain Expansion Project
The Trans Mountain Pipeline, originally built in 1953, transports both crude oil and refined products. In
December 2013, Trans Mountain Pipeline ULC (Trans Mountain) submitted an application to the
National Energy Board (NEB) to construct and operate the Trans Mountain Expansion Project (TMEP). On
May 19, 2016, the NEB, an independent economic regulatory agency, recommended the Federal
Governor in Council to approve a 1,150-kilometre (km) expansion of the pipeline. It was approved for
expansion by the Government of Canada on November 29, 2016. SFU is on the record as an intervenor
in the NEB process (NEB, 2016).
The TMEP, would twin the existing pipeline between Edmonton and Burnaby, increasing the capacity
from 300,000 barrels per day to 890,000 barrels per day (Kinder Morgan, 2017). The Kinder Morgan
Burnaby Mountain Terminal, located adjacent to SFU Burnaby campus, has 13 storage tanks with a
capacity of 1.7 million barrels. The expansion would add 14 new storage tanks, bringing the new
capacity to 5.6 million barrels (City of Burnaby, 2014).
Due to the proximity of the Burnaby Mountain Terminal to SFU Burnaby campus, SFU retained PGL
Environmental Consultants (PGL) to evaluate the risks arising from the TMEP (PGL, 2016). PGL concluded
that there would be an increased risk to SFU due to the following factors:
• Significant increase in the volume of petroleum products being conveyed through the twinned
pipelines and stored at the Burnaby Tank Farm;
• A higher proportion of heavy crudes (including diluted bitumen, which is more volatile than
conventional crude products) 2;
• Increased number and density of storage tanks at the Burnaby Tank Farm that present challenges to
isolating potential fires; and
• Proposed tanks being located closer to the site boundary and the surrounding road network; the
closest tanks are within 150 metres (m) of the key intersection of Gaglardi Way and Burnaby
Mountain Parkway.
To further evaluate the risks of the new pipeline and tank farm expansion, SFU Community Trust
retained RWDI Consulting Engineers and Scientists Inc. to prepare a letter of opinion on two proposed
aerial gondola alignments. To this end, RWDI reviewed a Quantitative Risk Analysis conducted by
Genesis Oil and Gas Consultants on behalf of Trans Mountain. The review found that either of the two
proposed gondola routes would be acceptable, as both are far enough removed from the tank farm that
the likelihood of catastrophic impact is less than one in 10 million. The Major Industrial Accidents
Council of Canada’s land-use planning criteria sets no restrictions to allowable land use or building
construction in such an area (RWDI, 2017).
2.2.2 Transit Service Changes
Preliminary planning and design of the Evergreen Extension rapid transit project was underway during
preparation of the 2011 business case. Although not directly serving SFU or Burnaby Mountain, the
Evergreen Extension represented a significant shift in transit service to and from the Northeast Sector of
the region. Therefore, recognizing the potential impact on BMGT, ridership estimates for the gondola
were developed for two scenarios: with and without the Evergreen Extension in place.
2 As measured by flashpoint, the temperature at which an organic compound gives off sufficient vapour to ignite in air.
SL0331171125VBC CH2M HILL CANADA LIMITED 2-3SECTION 2 – STRATEGIC ALIGNMENT AND PRIORITY
A number of relevant transit service changes have come into effect since 2011:
• Carvolth Transit Exchange and Park & Ride opened in December 2012, coinciding with the Port
Mann Highway 1 project completion;
• Route 555 express bus service was implemented across the Port Mann Bridge in December 2012.
Route 555, which originates at Carvolth Transit Exchange, connects the Township of Langley with
Lougheed Town Centre Station; and
• The Millennium Line – Evergreen Extension went into service in December 2016 and brought about
broader changes to SkyTrain operating patterns.
These changes, and the resulting impacts on gondola ridership, are reflected in the ridership forecasts
presented in Section 4.
2-4 CH2M HILL CANADA LIMITED SL0331171125VBCSECTION 3
Project Purpose and Goals
The purpose of proposed rapid transit to Burnaby Mountain is to improve travel time, frequency, and
reliability compared to existing bus service, and to reduce environmental impacts. While these
objectives have not changed since the development of the 2011 business case, it is important to revisit
the purpose and goals in light of the current context for the BMGT project, presented in this section.
3.1 Transportation
The primary driver behind the initial alternatives assessment was high demand and poor bus service
reliability for routes serving Burnaby Mountain, in particular Route 145. According to TransLink’s 2015
Transit Service Performance Review, the issues with Route 145 have persisted, showing it to be among
the worst (i.e. ranking in the bottom 10% of all bus routes) for the following metrics:
• Revenue Hours with Overcrowding (ranked 191 out of 214 routes): Overcrowding is measured by
the extent to which average passenger loads for a bus route exceeds established crowding
guidelines. The rank for this measure indicates that overcrowding on Route 145 is among the worst
for all bus routes.
• On-time Performance (ranked 183 out of 208 routes): Buses are considered to be on-time if they
arrive at a timing point along its route between one minute before and three minutes after the
scheduled time. The rank for this measure indicates that on-time performance for Route 145 is
among the worst of all bus routes.
• Bus Bunching (ranked 188 out of 208 routes): Bus bunching occurs when two or more buses, which
were schedule to run evenly spaced along the same route, instead arrive in the same location at the
same time or close to one another, then resulting in gaps in service and longer than anticipated wait
times for customers. The rank for this measure indicates that bus bunching for Route 145 is among
the worst of all bus routes.
This supports the anecdotal accounts of SFU transit users, who indicate that they are likely to be passed
up by four or more buses during peak periods.
Bus service unreliability is exacerbated under winter conditions, with disruptions ranging from
substitution of standard buses for articulated buses (resulting in a decrease in capacity) to a complete
curtailment of transit service in the event of road closures.
The current travel time by bus from Production Way-University Station to SFU Bus Exchange, a distance of
8.0 km, is approximately 15 minutes. With a peak direction headway of 2 to 3 minutes, and sometimes up
to four pass-ups, the total travel time can be almost 30 minutes when accounting for waiting time.
The current bus system can accommodate only two bicycles per trip, limiting the attractiveness for transit
users to use their bicycles to commute to Burnaby Mountain, especially during peak periods. During off
peak periods, there is high demand for bicycle rack space from recreational mountain bike use.
3.1.1 Transportation Project Objectives
• Develop a rapid transit solution that offers improved reliability, frequency, and travel time
relative to current bus service. That transit service should be flexible enough to accommodate
demand for longer operating hours and weekend service, to serve the evolving nature of SFU
campus offerings and community and recreational opportunities atop Burnaby Mountain. Bus riders
are currently being passed up by as many as four buses on Route 145.
SL0331171125VBC CH2M HILL CANADA LIMITED 3-1SECTION 3 – PROJECT PURPOSE AND GOALS
• Improve all-weather (snow, ice, and wind) reliability. Snow and severe weather events coincide
with the highest use times of campus (including exams and first week of spring semester). Severe
weather impacts accessibility and safe transportation to Burnaby campus along roads under the
control of SFU, the City of Burnaby, and the region. The “up to 10 days lost to snow and severe
weather” condition remains from the last business case; however, it is important to understand the
domino effect this can have on a student: missing exam due to University closure or transportation
issues; re-scheduling exam, which needs to be coordinated with student, professor, and exam
markers; and potential delays in writing, marking, and submitting grade, causing further delays to
class registration or job applications.
• Provide a safe and secure service that enhances accessibility. With one common point of entry to
Burnaby Mountain by road (intersection of Gaglardi Way and Burnaby Mountain Parkway) and an
increasing population of residents, employees, students, and visitors, the need for a more reliable
and redundant transportation network serving Burnaby Mountain grows. There is a lack of alternate
safe transportation routes off-campus in the event of fires, earthquakes, or significant weather
events, and according to SFU, an expanded Kinder Morgan tank farm on Burnaby Mountain will
heighten these concerns.
• Encourage a mode shift to transit, walking, and cycling. Encouraging these modes is well aligned
with regional goals and SFU and UniverCity plans to promote sustainable and active modes of
transportation3. Enhanced transit access to Burnaby Mountain will not only support more
sustainable modes for utilitarian trips, but also improved access to the Burnaby Mountain trail
network would bring hiking and mountain biking opportunities within reach of a greater number of
residents of Burnaby.
• Reduce lifecycle energy usage associated with transportation. A significant portion of TransLink’s
bus fleet relies on fossil fuel energy, which is subject to price volatility.
• Provide a connection from the existing rapid transit network to Burnaby Mountain that meets
current and future travel demands. SFU has expanded its non-peak evening and weekend offerings,
including 24/7 dining, extended library hours, and more classes. Increased transit service frequency
and hours of operation, would allow better access to these offerings.
3.2 Financial
It is important to understand whether the BMGT project is affordable, cost-effective, and represents a
good use of public funds. Consideration should be given to both near-term and long-term financial
impacts of the project.
3.2.1 Financial Project Objectives
• Establish whether a rapid transit connection linking the top of Burnaby Mountain to the existing
rapid transit network would be cost-effective in meeting travel demands and reducing GHGs.
• Establish whether replacing the existing diesel bus fleet with an alternative transit technology would
provide net savings in annual life-cycle capital and operations costs.
• Outline the lifecycle for construction and operation over a 25-year period.
3 https://www.sfu.ca/sustainability/initiatives/transportation.html
3-2 CH2M HILL CANADA LIMITED SL0331171125VBCSECTION 3 – PROJECT PURPOSE AND GOALS
3.3 Environmental
There is renewed interest at the Federal level to address climate change commitments, especially when
looking at carbon pricing as a key policy lever to effect change amongst industry. Additionally, aggressive
Provincial and regional targets have been established for GHG and criteria area contaminant (CAC) air
emissions, to fight climate change and air pollution. Replacement of diesel buses by innovative,
electrically powered transit can contribute to achieving these targets.
A direct transit corridor from SkyTrain to SFU will cross the Burnaby Mountain and Burnaby
200 Conservation Areas and will need to limit and mitigate any disturbance to the natural environment.
Consideration should also be given to noise, privacy, aesthetics, emissions, view, carbon footprint, and
other issues identified through the public engagement process.
3.3.1 Environmental Project Objectives
• Reduce emissions of GHGs and CACs in the provision of transit service and by facilitating a mode
shift away from single-occupancy vehicles.
• Reduce the carbon footprint and overall energy usage of transit to and from Burnaby Mountain.
• Minimize adverse effects to the Burnaby Mountain and Burnaby 200 Conservation Areas.
• Use sustainable methods and materials for the BMGT project.
• Develop an effective Environmental Assessment (EA) and public engagement process that addresses
community concerns and meets regulatory requirements.
3.4 Urban Development
Current and expected urban development at the top of Burnaby Mountain is increasing transit demand.
Improved transit service would serve SFU and support UniverCity’s aspirations to be a model sustainable
community.
The remainder of the study area has a mixture of stable residential, commercial, and industrial lands,
and there is potential for re-development near the SkyTrain station on Lougheed Highway.
3.4.1 Urban Development Project Objectives
• Support future land-use plans as contained in Metro Vancouver’s Regional Growth Strategy, the
Burnaby Official Community Plan, and the SFU Official Community Plan.
• Provide rapid transit stations and infrastructure that are integrated into the urban fabric.
• Mitigate risk to urban developments.
3.5 Economic Development
Burnaby Mountain is home to Simon Fraser University and Fraser International College, which provides
international students a direct pathway into year two of SFU undergraduate degrees. As the second
largest post-secondary institution in the province, SFU’s education and research activities are key drivers
of economic development in Metro Vancouver and beyond. The Burnaby campus is the university’s
largest campus, accommodating more than 20,000 undergraduate and graduate students, faculty, and
staff, and this population is expected to grow to over 30,000 by 2030. As noted previously, SFU is
currently vulnerable to closures due to winter weather and roadway conditions, and these closures have
a negative impact on SFU’s academic and economic development activities.
SL0331171125VBC CH2M HILL CANADA LIMITED 3-3SECTION 3 – PROJECT PURPOSE AND GOALS
SFU campuses in Surrey and downtown Vancouver are also directly served by rapid transit. Students
often attend classes at more than one campus or even at different post-secondary institutions.
Improving the transportation connections among campuses is an important aspect of promoting
academic exchange.
Long commute times are adding to Greater Vancouver’s difficulties in attracting high-end talent. A
benchmark analysis by the Conference Board of Canada, Centre for Municipal Studies (Conference
Board) (Greater Vancouver Economic Scorecard 2016) gives regional non-auto commute time a “C”
grade (Conference Board, 2016). Failure to address deteriorating housing affordability and inadequate
investment in transit and road infrastructure could keep talented people and business investment away.
Continued attraction and retention of talent requires a commitment to invest in regional public transit
and road infrastructure.
Investment in regional public transit and road infrastructure has been shown to influence private-sector
competitiveness, especially if it reduces commute times for employees and improves goods movement.
In this regard, the Mayors’ Council 10-year Vision for Metro Vancouver, the Provincial government’s
2015 10-year plan, B.C. on the Move (Province, 2015), and the more recent Federal government
commitment to fund up to 50 percent of urban transportation infrastructure projects all show that
governments at every level are engaged on this issue.
3.5.1 Economic Development Project Objective
• Provide high-quality transit service that supports the SFU campus and the surrounding community,
and contributes to regional economic good health.
3.6 Social and Community
SFU derives a distinct character from its mountain-top location. The UniverCity community character is
also influenced by its location and its aspiration to serve as a model sustainable community. The study
area also includes established residential communities and activity centres that could benefit from
improvements to the transit services that connect Burnaby Mountain to the regional SkyTrain system.
SFU, the Burnaby Mountain Conservation Area, and the Burnaby 200 Conservation Area all serve as
regional assets offering hiking and bicycling trails, scenic vistas, cultural institutions, and renowned
architecture. Improved transit service would enhance access to these recreational and tourist
opportunities.
3.6.1 Social and Community Project Objectives
• Maintain transit links to the study area residential communities, employment centres, and other
activity centres.
• Minimize and mitigate adverse impacts to residential communities and the Burnaby Mountain and
Burnaby 200 Conservation Areas.
• Foster active transportation and recreational opportunities with improved transit service and
amenities.
3-4 CH2M HILL CANADA LIMITED SL0331171125VBCSECTION 3 – PROJECT PURPOSE AND GOALS
3.7 Deliverability
Construction of rapid transit through or above the study area will require acquisition of rights-of-way or
aerial easements in a developed urban environment. Residential, commercial, and industrial properties
may be impacted, as may public streets, utility corridors, and the conservation areas. An EA and robust
public and stakeholder engagement would be needed to deliver the BMGT project. Also, funding
improvements to Burnaby Mountain transit service must be balanced against other regional priorities.
3.7.1 Deliverability Project Objectives
• Provide information on the BMGT project to the public, stakeholders, and all levels of government
to support informed discussion and fact-based decisions.
• Develop a BMGT project scope that is deliverable and sustainable.
SL0331171125VBC CH2M HILL CANADA LIMITED 3-5SECTION 4 Ridership Forecasts 4.1 Background The RTM has undergone a major update with new assumptions, inputs, transit service changes, and revisions to the road network since 2011. The new model was validated against the 2011 Trip Diary and screenline surveys, travel times against bus schedules, automatic passenger counts and Compass Card fare data for ridership, and Google Maps for auto travel time. Overall, the new model compares well to observed metrics, providing confidence in its ability to estimate the impact of a new BMGT project on travel time and operating costs. 4.2 Model Scenarios To understand ridership potential and estimate BMGT project benefits, the following three scenarios were modelled: 1. Business-As-Usual (BAU) – continuation of service for comparison against the two gondola alignment options; 2. Option 1: Straight Alignment – a direct route from Production Way-University SkyTrain Station to the SFU Town Square and transit loop; and 3. Option 2: Kinked Alignment – a “kinked” route that follows the lower portion of Gaglardi Way to avoid the Forest Grove residential area, with its Lower Terminal situated near Production Way and Commerce Court. 4.3 Future Year Ridership Projections Updates to land-use projections and the transportation network have been incorporated into the RTM. Two horizon years were modelled to estimate BMGT project benefits: 2030 and 2045. For each horizon year, the three scenarios described in Section 4.2 were run: BAU, Option 1: Straight Alignment, and Option 2: Kinked Alignment. 4.3.1 Land-use Projections Figure 4-1 summarizes future land-use assumptions for Burnaby Mountain. Overall, a significant increase in population and SFU enrollment is forecast by 2030; thereafter, modest growth is expected between 2030 and 2045. SL0331171125VBC CH2M HILL CANADA LIMITED 4-1
SECTION 4 – RIDERSHIP FORECASTS

                 35,000
                                                                                                      30,600 31,000
                 30,000

                 25,000

                                                                                               19,900
                 20,000
                                                                                                                                 2011
                                                                                                                                 2030
                 15,000
                                                                                                                                 2045
                                               10,000
                 10,000                   8,000                                7,900
                                                                 6,850 7,250

                   5,000          2,950

                        0
                                     Population                    Employment                 Post-sec Enrollment

                                                                       Figure 4-1. SFU and UniverCity Land Use Projections
                                          Metro Vancouver’s Regional Growth Estimates provided to TransLink in 2013/2014

4.3.2        Network Changes
Major changes to the transportation network beyond 2011, and assumed in place for 2030 and 2045,
include the following:
•     Millennium Line - Evergreen Extension;
•     Bus improvements in the Tri-Cities;
•     SkyTrain operating pattern changes (that is, Expo Line stops at Production Way-University Station);
•     Upgrades to Highway 1;
•     Expanded capacity of the current George Massey Tunnel crossing 4; and
•     Bus from Burquitlam Station to SFU.
In modelling the Gondola scenarios, it was assumed that bus Route 145 is discontinued, and the
remaining bus lines would not change.

4.3.3        Forecasts
Figure 4-2 shows in red the location of two screenlines, across which forecasts of transit demand to
Burnaby Mountain were estimated:
•     Screenline 1: crosses Gaglardi Way, and captures transit demand on the Routes 143 and 145.
•     Screenline 2: crosses Burnaby Mountain Parkway, and captures transit demand on the Routes 135 5
      and 144.

4 In September 2017, the Province announced an independent technical review of the George Massey Tunnel Crossing, with a report including
findings expected in spring 2018.
5 In December 2016 Route 135 was replaced by Route 95.

4-2                                                     CH2M HILL CANADA LIMITED                                        SL0331171125VBC
You can also read