Data Visualization: How to Tell Number Stories with Pictures - AFP GUIDE TO Issue 6
←
→
Page content transcription
If your browser does not render page correctly, please read the page content below
AFP® GUIDE TO
Data Visualization: How to Tell
Number Stories with Pictures
FP&A Guide Series
                     Sponsored by

Issue 6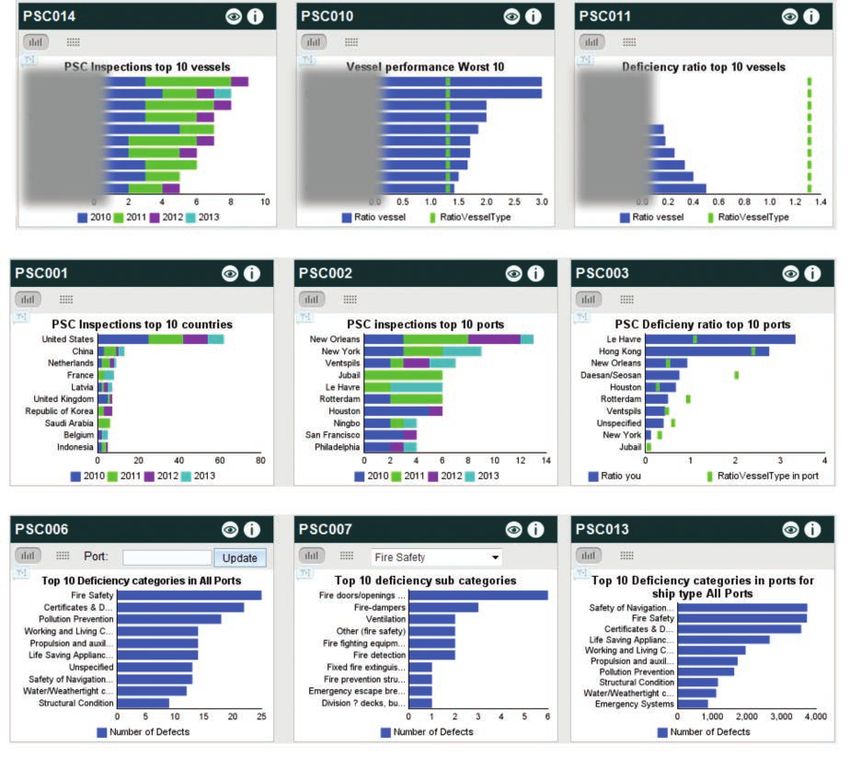
AFP® GUIDE TO
Data Visualization: How to Tell
Number Stories with Pictures
FP&A Guide Series
Sponsored by

  Contents
                                                    1
                                                   2
                                                   4
                                                   6
                                                   7
                                                   8
    Sidebar: Tips on dashboards                    9
    Sidebar: Taking dashboards to the next level   13
    Sidebar: Don’t give up on tables               16
    Sidebar: Pie charts                            17
    Sidebar: Software packages                     19
   Conclusion                                      18
   Checklist: Best practices                       21

   Checklist: Things to avoid                      22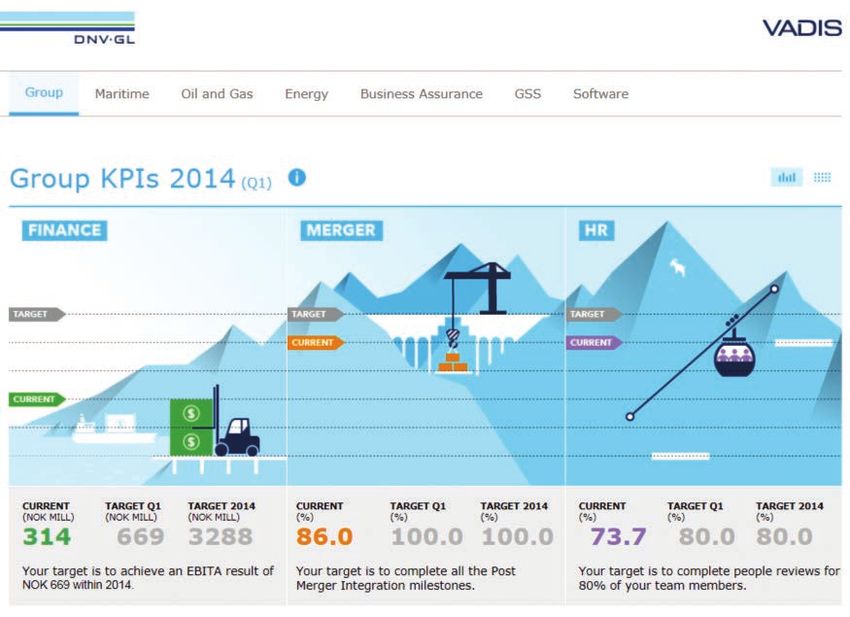
Financial planning and analysis (FP&A) teams are increasingly being challenged to produce
and organize financial data, and also convey it through intuitive images.

Without the ability to organize and present data efficiently, decision-making takes longer.
Information can also become lost or outdated. Moreover, understanding the story may
become difficult for not only FP&A teams, but more importantly, for management and key
decision makers.

FP&A teams need a reliable, efficient, and interconnected method of organizing and presenting
their financial data. Telling a story simply and effectively through intuitive images makes it
easy to communicate and collaborate throughout all levels of the company—giving
management more time to interpret and make critical decisions.

With this in mind, Workiva is pleased to partner with the Association for Financial
Professionals (AFP) to produce this AFP Guide to Data Visualization: How to Tell Number
Stories with Pictures.

This guide explores how finance professionals look at data visualization as a way to solve
problems, identify patterns, and understand what’s driving organizational performance.
The guide also provides real-world examples of how FP&A teams are implementing
visualization today.

As FP&A teams explore ways to provide better visual representations of their data, they also
should look for reporting solutions that enable them to:

  • Create intuitive and compelling stories easily using graphs and charts, with the ability
    to drill down or show high-level trends on strategic measures showing business
    performance to multiple audiences within their organization

  • Ensure one central source of truth for information that can be linked into financial reports,
    dynamic, at-a-glance dashboards to management, and presentations that enable readers
    to digest key messages rapidly

  • Encourage collaborative and productive conversations to identify and find answers to key
    business questions that will improve the quality of analysis, so insights are communicated
    to executive management and the board more efficiently

Companies are pushing hard for better graphical representation of data. FP&A teams are
expected to visualize what’s important without distracting from the key message at hand.
Interacting and reporting data from one central data set will play an integral role in telling a
story with accurate and consistent information across charts, graphs, and dashboards.

Joseph Howell
Managing Director and Co-Founder
Workiva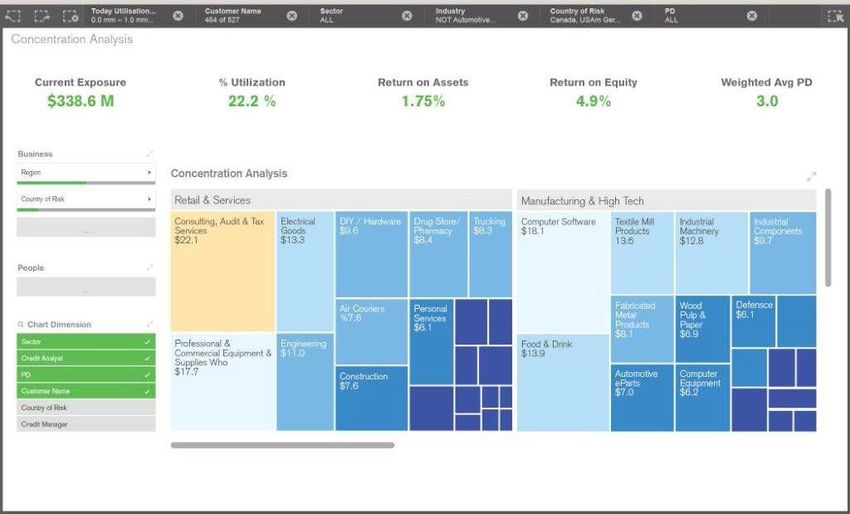
AFP GUIDE: Data Visualization: How to Tell Number Stories with Pictures

Executive Summary
  “Graphical excellence is the well-designed presentation of interesting data — a matter of substance, of statistics, and of
  design. Graphical excellence consists of complex ideas communicated with clarity, precision and efficiency. Graphical
  excellence is that which gives to the viewer the greatest number of ideas in the shortest time with the least ink in the
  smallest amount space.” − Edward R. Tufte

   Financial planning and analysis professionals are increas-       deeper questions, and prepare presentations for senior
ingly using charts and graphs to visualize data, interact with      management. They can do so at increasing rates of speed,
information, and present it to senior management and the            which means more time to think and analyze, more
board to tell stories and drive important conversations.            dynamic, real-time analysis and reporting, and less time
   Graphical information is more intuitively absorbed in            spent collecting data and struggling with creating charts.
our minds and can capture large amounts of data in a                  New tools are emerging that allow analysts to use
much more succinct format, allowing FP&A to spot                    data visualization to dig into patterns and identify
and show trends, patterns and anomalies more effectively.           problem areas quickly, often tied directly to the com-
Using graphics, finance professionals can tell bet-                 pany’s performance database. Going forward, interactive
ter stories, pinpoint action items, and create effective            data tools will allow finance professionals to not only
dashboards that allow management to see the business at             confirm hypotheses, but ask additional questions and
a glance. These dashboards need to be tailored to audi-             continue to interact with the data to explore new areas,
ences — more high-level for the board, more detailed for            thus providing continuous feedback to management.
operations. However, they should all draw on the same                 As the use of data visualization becomes more widely
set of data, or version of the truth.                               used by finance, which many say is lagging compared to
   FP&A professionals are only beginning to use high-               areas like marketing and sales, it will unleash a greater
level visualization to interact more effectively with their         power of analytics and enable professionals to deal with
data, perform their own analyses, validate hypotheses, ask          an increasing amount of data.

www.AFPonline.org                          ©2014 Association for Financial Professionals, Inc. All Rights Reserved               1
AFP GUIDE: Data Visualization: How to Tell Number Stories with Pictures

Introduction: The Trend                                              Do you require data visualization capabilities
                                                                     beyond standard charts and graphs?
Survey shows more finance professionals are looking to data
visualization to help solve problems, identify patterns and
anomalies, and understand what’s driving their
organizational performance.                                                                          24.0%
   The trend toward greater use of visualization among                        35.1%                                      Yes
FP&A professionals is still growing. “A lot of them are
                                                                                                                         No
still focused on numbers,” said Craig Schiff, president
                                                                                                                         Not sure
and CEO of BPM Partners, a vendor-neutral advi-
                                                                                               40.9%
sory services firm specializing in business performance
management (BPM) and business intelligence solutions.
However, the data from the 2014 BPM Pulse Survey
of finance professionals shows the desire for change is
strong. Asked if they require data visualization beyond               What data visualization capabilities do you
typical charts or graphs offered in Excel, 40 percent of              need that you are not getting today? (select
                                                                      all that apply)
the finance professionals surveyed responded that they
do. “That’s a large and growing number,” Schiff noted.
                                                                        More interactive                                              70.6%
   More interactive features scored highest (71 percent)
                                                                        More chart types
when asked what kind of data visualization capability                (heat chart, fractals,
                                                                                                                             56.5%
                                                                       tree map, bubble
respondents would like to have. “They really want to                          chart, etc.)

                                                                         Access to more
understand what’s going on behind the scenes. Graphics                     data sources                              43.5%
                                                                              (internal)
are great. The important thing is that not all the visu-
                                                                         Access to more
alization tools provide the ability to drill back into the                 data sources                21.2%
                                                                              (external)
detail to broaden your own understanding of the graph
that brought the issue to your attention.” Fifty percent                         Not sure     7.1%
of respondents also wanted more chart types and tools
                                                                                         0%          20%       40%           60%         80%
in order to present the data with specialized graphics.
   The last question the survey asked about data visu-
alization is from what source respondents would prefer               Where would you prefer to get these data
to acquire these tools. The choices were: third-party                visualization capabilities from?
providers, included in their performance management
solution, or doesn’t matter. According to the results, 71
percent preferred that the data visualization capabilities                                                                   Included in
                                                                                                     15.3%                   performance
be integrated into the core product. “One of the chal-                                                                       management
                                                                                                                             solution
lenges of the third-party tools is how to connect them to                                                  11.8%             Doesn’t matter
the source data,” Schiff said. That integration is already
                                                                                                                             Third-party
built into the budgeting tools. Those systems also speak                                                                     solution that
                                                                                       72.9%                                 may access my
the financial language and are designed for business                                                                         performance
end-user self-sufficiency. Many of the standalone tools                                                                      management
                                                                                                                             data
require more IT knowledge to connect them to the data
sources. “We believe that data visualization is a grow-
ing trend, and there is still a lot of opportunity for the
vendors to add value.”                                               Source: BPM Partners 2014 BPM Pulse Survey

2                     ©2014 Association for Financial Professionals, Inc. All Rights Reserved                      www.AFPonline.org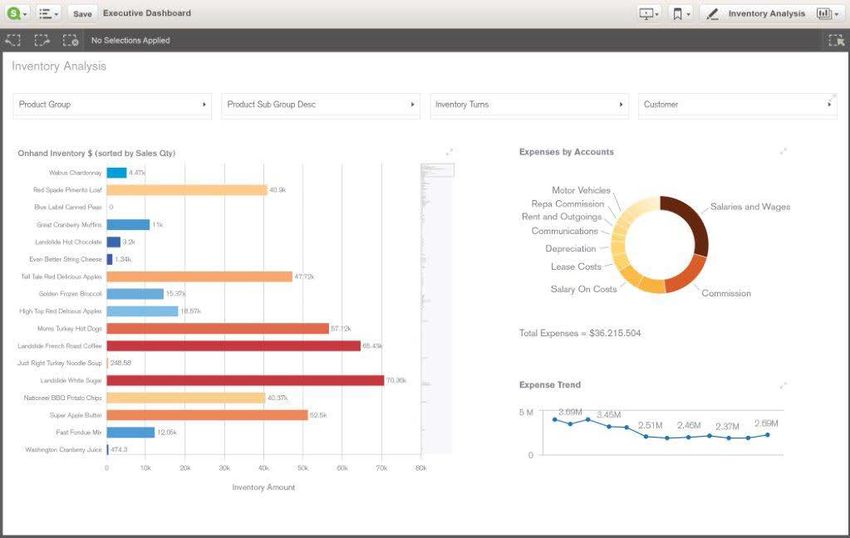
AFP GUIDE: Data Visualization: How to Tell Number Stories with Pictures

   “Most humans are wired for visual learning and under-           Saliter. “There’s a current trend to better communicate
standing,” said Gary Cokins of Analytics-Based Perfor-             and share findings with others. The concept of ‘data
mance Management and co-author of “Predictive Ana-                 story telling’ enables you to wrap the interactive visual-
lytics: Forward Looking Capabilities to Improve Business           ization and data with a narrative.”
Performance.” “Very few people can examine data tables                “The challenge has always been to present a story and
and pick out trends or grasp big-picture issues,” he               to communicate it in a more operational, practical way,”
continued. “Even statisticians and data scientists who             said Sherri Liao, EPM advisory U.S. practice leader of
are better equipped than most to deal with data in all its         The Hackett Group. “The idea is to understand the
forms benefit from graphical interpretations.”                     outcome and the action items that management needs to
   Data scientists and business analysts need to be able to        pursue. People are more visual. Using data visualization
communicate in straightforward, visual ways with broad             allows FP&A professionals to more effectively say what
and diverse audiences. “FP&A professionals consis-                 they’re seeing in terms of financial results.”
tently seek better ways to support decision-makers,” said             That’s why heat maps have such an immediate and intui-
Madison Laird, CFO of Funding Profiles, a visualization            tive impact: red is negative, green is positive. When there’s a
software provider that brings together finance executives          lot of red on the map, people are visually motivated to ask
from companies such as HP, Microsoft, Citigroup, Cisco             the important questions. “It’s more intuitive,” said Liao.
and IBM. “There’s increasing pressure from the CEO and                “I think speed of insight is the key,” added Jim
COO to view finance as a keeper of the facts and provider          O’Connor, principal with The Hackett Group. “For the
of key insights. They don’t want a series of data points or        last 20 years, FP&A got out of the transactional side
another ‘fact pact.’ They want the analysis that helps them        and more into analytical. With visualization, they have
decide on a strategic direction for the organization.”             the capacity to do that. The reality is that executives are
   “FP&A spends a large amount of time managing large              busy. To tell an effective story, you need a concise dash-
amounts of information, to craft a lot of insight. A lot of        board with insightful graphs.”
time is spent taking numbers and presenting them in a                 Stephen Few, author of “Show Me the Numbers:
compelling way,” said Joe Howell, managing director and            Designing Tables and Graphs to Enlighten,” takes it one
co-founder of Workiva. Visualization gives data credibility.       step further. “Because of their visual nature, graphs tap
“It gives credence to what they’ve done,” he said.                 into the incredible power of visual perception to com-
                                                                   municate quantitative information. When the story that
                                                                   you wish to tell is contained in the data’s patterns, trends
Tell a story in an intuitive way                                   and exceptions; or when it depends on your audience’s
Finance professionals are increasingly turning to images,          ability to compare entire series of values to one anoth-
such as graphs and charts, to find out what’s going on             er… a graph will do the job best but only if you avoid all
behind the scenes, and to create more compelling stories that      too common design flaws.”
drive decisions and spotlight action items for management,            Different vendors and consultants have developed
the board, and operational leaders.                                a number of effective visual components to aid their
   The ultimate goal of data visualization is to present a         customers. However, according to Karuna Mukherjea,
story and highlight what’s important. “Data visualization          senior director of Product Marketing at SAP, this has
begins with telling a story, but its power is in enabling          created a problem. “The issue we’re running in to is that
the next question to be answered,” said Mike Saliter,              there are too many visual components that are not stan-
vice president of global market development at Qlik, a             dardized,” she said. “Different consultants do it in differ-
provider of data visualization software.                           ent ways. We need to work with an organization whose
   Historically, visualization has been more focused               mission is to standardize the visualized components. The
on empowering people to confirm their intuition and                idea is to view the visual components like musical notes
to validate a hypothesis as part of the underlying data            — there are so many different types of music, but the
through analysis. “However, the market is shifting,” said          notes used to create them are the same.”

www.AFPonline.org                         ©2014 Association for Financial Professionals, Inc. All Rights Reserved                3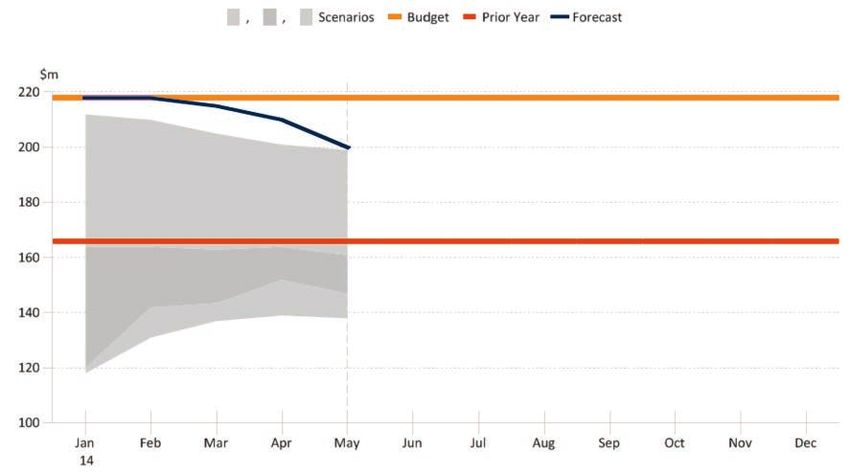
AFP GUIDE: Data Visualization: How to Tell Number Stories with Pictures

   Senior management needs to see, in one glance, the                   Data visualization can also help promote clearer
five metrics that best illustrate the health of the business.        understanding by turning big data into small data. For
“It comes down to not only breaking it down to visual-               example, “You can use a simple line graph to show a 5-
ized components but to how and where the business is                 to 15-year trend on profitability,” said Barisic. “Clearly a
going, which is more important from an engagement                    significant amount of data goes into generating profit-
and interaction standpoint,” said Mukherjea. “Getting                ability figures, especially when we are trying to look
those visual elements that can tell the story behind the             at results over multiple years. All of this data can be
data is taking that big data component that we have in               presented with a clear message of trend and potentially
finance today and telling the story for the data.”                   — even forward forecasting — in one line graph.”
   “The trick is to visualize what’s important,” said How-              However, it’s important to use graphics that are not
ell. “People sometime visualize what’s easy versus what              intimidating or difficult to assimilate. “In some instances
matters, or what looks good rather than what’s impor-                it may be appealing to use graphs over tables,” said Ba-
tant. That can be distracting from the point and from                risic, “but if individual values need to be identified, then
the message. You have to tell a story prior to even getting          tables are a more appropriate medium to use even if they
into the room with them.”                                            might be slightly less visually appealing.”
   Wdesk by Workiva builds a single source network of                   For all their positives, there are times when graphics
an organization’s most valuable data, helping to cre-                are not the appropriate medium to convey a message.
ate consistency of information across all departments.               Sometimes a simple summary in a Word document or
“That’s central to our product,” Howell explained. “You              a PowerPoint slide with bullet-points suffices. “You’ve
use the same data set. It’s not about fancy artwork. It’s            got to be selective and match the display medium to the
about how you tie it all together.”                                  story,” said Barisic.
                                                                        “The trend is toward more visualization,” said Bruce
Practitioner perspective                                             Hunt, vice president of FP&A for a technology compa-
   When explaining financial results to executives whose             ny. “It doesn’t matter whether it’s a table or a graph, what
first language isn’t numbers, finance professionals should           matters is that the person using it can grasp the underly-
start by educating them at a macro level and defining key            ing meaning of what’s being presented.”
metrics. As a general rule, the simpler the graphics used
to convey the information, the better.
   According to Jim Robertson, vice president of FP&A at             Ask the right questions
Emeritus, one should always start by asking: What’s the best         The power of data visualization lies in its ability to drive
way to communicate the story to the audience? “The story             strategic decisions by helping management find the answers
needs to be a standalone document,” he said. “You never              to key business questions.
know where a presentation is going to end up. You can’t                 According to Graham Wills, RAVE chief architect
assume that any of your key points will be highlighted unless        and statistician with IBM SPSS, any successful data
they’re in the document. Build a presentation that someone           visualization project starts with clearly identifying your
who is smart, but not necessarily knowledgeable about the            goals, which starts by asking the right questions. Is the
topic, can pick up and get the point you’re trying to make.”         goal is to assist in managing global risk and governance,
   “Graphics can be very a very powerful tool when tell-             to increase sales, or something else? “Assuming it’s about
ing a story with quantitative data, especially if you are            risk, you’d probably want to know which areas are most
trying to draw particular attention to a salient topic, or if        risky, or where do things go unreported? Visualization
you are trying to summarize large quantities of data in a            will answer those questions,” said Wills.
meaningful way,” said Irena Barisic, deputy CFO of the                  A successful image asks and answers multiple ques-
Brookings Institution. However, she cautioned, “Graph-               tions. “Visualization almost always asks better ques-
ics always have to be presented in context, or introduced            tions,” said Wills. For example, where do problems occur
as part of a larger context, in order to tell the full story.”       that are not handled rapidly, how long does it take for

4                     ©2014 Association for Financial Professionals, Inc. All Rights Reserved            www.AFPonline.org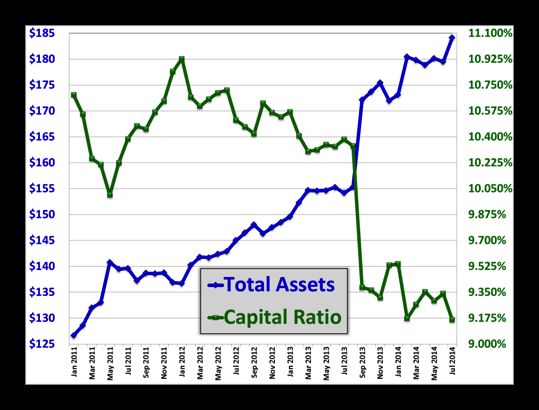
AFP GUIDE: Data Visualization: How to Tell Number Stories with Pictures

them to be handled, and what is their geographical loca-            tries, the most common business question is: how cred-
tion? “You have to be able to answer the broader ques-              ible are the forecasts of our business units?’’ said Mosely.
tions so people can discover more about the problem,”               “And when a forecast appears either too optimistic or
he said. “It’s a sort of partnership with the user.”                overly pessimistic, how can our FP&A team present the
   “It’s also important to try to tie in predictive analyt-         data visually to support their dialogue with the business?
ics,” continued Wills. “If something happens, what is               Every business needs to be on top of its numbers. The
the total amount of money you’re predicted to lose, and             challenge is finding out as soon as possible if you’re not
should you be concerned about the average amount or                 going to make that forecast rather than being presented
the big amounts that are the outliers? That’s the data you          with an impossible last-minute challenge. Having time
choose to highlight and the context for the analytics.              to take action puts you back in control.”
The measure of value or success of a visualization project             Metapraxis’ software contains a calculation engine that
is whether it helped answer the questions.”                         creates statistical scenarios, which are then presented vi-
   In order to be able to tailor the image to the audience,         sually to show trends and variances. Alternative scenarios
“You have to be asking the right questions,” said Amanda            are automatically created, against which you can test the
Pype, user researcher at Tableau Software, a leading visualiza-     management forecast, according to Mosely. “We call this
tion software provider. “What do they want to know? The             visualization the ‘Windsock’ chart” (see below).
most important thing is to understand the audience and                 The “Windsock” chart tracks the evolution of the
what they’re trying to get out of the data.” Also, use charts       subsidiary’s updated year-end forecasts throughout the fi-
that they can easily understand, she advised. “You don’t want       nancial year, comparing them against the annual budget,
to spend 10 minutes explaining the chart.”                          prior year performance and a statistical risk range. The
   One key concern is the reliability of the forecast,              chart shows that the current management forecast for
according to Andrew Mosely, director at Metapraxis, a               Net Sales is at the very top of the current risk range and
London-based visualization vendor. “Across all indus-               may be too optimistic.

Western Europe Net Sales Windsock

www.AFPonline.org                          ©2014 Association for Financial Professionals, Inc. All Rights Reserved             5

AFP GUIDE: Data Visualization: How to Tell Number Stories with Pictures

   To provide context, an accepted practice by analysts              Identifying patterns
is to first establish a hypothesis in the learning stage of
analysis, said Cokins, “and then to validate or refute the           Graphs are at their most powerful when helping finance
hypothesis in the confirmation stage. The key is to estab-           professionals, and by extension, management, identify
lish a high-gain hypothesis, which, if confirmed, can lead           patterns and anomalies. Visualization, particularly of large
to substantial favorable actions with results. An example            amount of data, can reveal trends and deviation from
of a hypothesis is: ‘Which type of consumer segment is               trends that can compel management to ask the important
most likely to respond to deal, discount, or offer?’ An              questions and take corrective action where necessary.
effective way for analysts to communicate the hypothesis                Visualization can help you see and understand pat-
they intend to test is to initially involve those who will be        terns in your own data and help you communicate those
making decisions based on the outcome of the test. Revi-             pattern to others. “The visual nature of graphs endows
sions from their inputs can then be made.”                           them with their unique power to reveal patterns of vari-
   To make your chart is an act of what Randall Bolten, a            ous types, including changes, differences, similarities
former Silicon Valley CFO and author of “Painting with               and exceptions,” writes Few. “Graphs can communicate
Numbers: Presenting Financials and Other Numbers So                  quantitative relationships that are much more complex
People Will Understand You,” calls “quantation.” Quan-               than the simple associations between individual quanti-
tation is the act of presenting numbers, e.g., financial             tative values that tables can express.”
results presented electronically or in a written form, for              According to Pype, “Visualization allows you to
the purpose of informing the audience.                               understand data holistically,” she said. “Once you start
   “To make data valuable and meaningful to your audience            looking at graphs, it’s easier to spot the outliers. It’s
you need to have a sense of what decisions the people in your        incredibly powerful as a complement to statistical infor-
audience are facing, what problems they are facing, how they         mation.” If you need to show more than one number,
think about those decisions and problems, and your own               there’s no better tool for communicating with others.
ultimate goal in preparing your report,” said Bolten.                “For example, how do I compare one region to another?
                                                                     A visual representation is almost always better when
Practitioner perspective                                             it comes to comparing patterns. It’s highly efficient. A
   According to Barisic, when sharing financial informa-             well-crafted visualization allows the audience to see the
tion, the focus is to keep the executive team informed,              important information immediately.”
as well as to facilitate decision-making and performance                Visualization is not adding tremendous value when it’s
measurement. In order to accomplish these goals:                     in the hand of an analyst who’s doing basic profit and loss
   • Use simplified terminology to convey financial                  (P&L) or balance sheet analytics. According to Schiff, it
     results, assumptions, and conclusions.                          starts gaining power when finance professionals are exam-
   • Focus on the most salient points and provide suf-               ining high volumes of data in order to spot trends.
     ficient but concise information without being overly               “Graphics can clearly highlight the trends, particularly
     technical and detailed.                                         things like activities by certain types of customers, where
   • The financial discussion needs to be high level and             manually looking through large amounts of data would
     tied to business strategy. Executives are generally             be simply impossible,” he said. “Putting graphics on top
     action-oriented with a forward focus; therefore, you            of analysis intended for a wider audience is important.
     should always answer the following questions:                   The main benefit is the opportunity to clearly commu-
     - Why does this data matter?                                    nicate your findings to others, especially when you go
     - What impact does the financial result/conclusion              outside of finance.”
        have on us today and in the future?                             Another place where graphics can be helpful is in
        Be audience-specific.                                        looking at variances, from forecast or budget. You can
   • Always be prepared to discuss any financial informa-            chart actual versus the forecast or budget and explain
     tion in more detail should it become necessary.                 the trend. Using simple tools like stop lights or gauges

6                     ©2014 Association for Financial Professionals, Inc. All Rights Reserved             www.AFPonline.org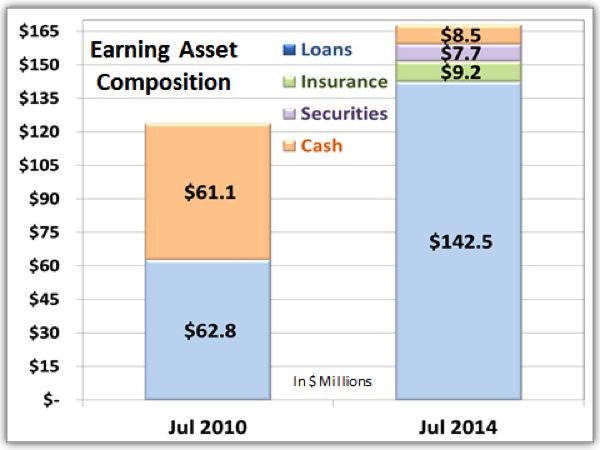
AFP GUIDE: Data Visualization: How to Tell Number Stories with Pictures

can make it clear even to the most casual user where              Tailor the image to your audience
you stand in terms of achieving targets. “A key point
                                                                  Most FP&A professionals and experts agree that data
to appreciate for the CFO’s finance and accounting
                                                                  visualization should be matched to the audience, with
function is that columns-and-rows tables, typically from
                                                                  simpler images for boards and senior management. The idea
spreadsheets, cannot reveal trends, outliers, or key items
                                                                  is to quickly communicate key business indicators, pinpoint
for attention,” said Cokins.
                                                                  areas of action, and raise key questions. That’s not always an
   Pie charts, graphs, and histograms are arguably the
                                                                  easy balance to achieve.
most popular ways to display table data. Advanced
methods can use three-dimensional views (e.g., sales                 “If you don’t think carefully about the balance between
by product type, region, and customer segment). Even              complete, accurate and useful for your particular audi-
more advanced features have real-time interactive                 ence, they might not get what they need to get out of your
features where one can slide the cursor on an indepen-            reports, and then all of your work, collecting and present-
dent variable in the graph (e.g., sales volume), and the          ing your information, may be for naught,” said Bolten.
dependent variables (e.g., profits) will instantly reflect           The visualization design and layout has to fit the audi-
the change.                                                       ence. “It’s definitely not one-size-fits-all,” said Saliter.
   “In terms of live data visualization, that’s still in an       “It’s a best practice to tailor the interface to meet the
innovative stage and has improved the quality of the              expected level of interactivity and analysis.”
conversation where it’s available,” Liao said. “You can              CEOs and executives need to see very high-level trends
understand what’s going on faster. You can better under-          and indicators, according to Saliter. They need to see
stand performance, gross margins, product margin and              if things are trending up or down, but they often don’t
market share.”                                                    need the same level of interactivity and drill down that
   Heat maps are one of the most popular mediums                  management and business analysts need.
for live data visualization. Another is geographical area            Analysts need to be able to dissect the numbers and
maps, which are helpful in answering questions such               ask the next question. “You need a lot more self-service
as: are we doing better in Asia or Europe? You can look           and the ability to investigate,” he said. “I’ve seen situ-
at each shipping location, its collections delays, and its        ations where companies tried to offer the same level of
number of customer complaints due to delays, and link             analytical self-service to the board and senior executives,
the three data points to find the common root. “Charts            and adoption was low. It actually creates a negative effect
make it easier to understand,” said Liao. “It helps com-          since senior executives can get turned off or intimidated
plete the story.”                                                 by too many bells and whistles.”
   “Visualization can improve the quality of analysis                According to Bolten, “The most important thing you
so that insight gets generated more efficiently. This             can do is keep their [audience] needs in mind when you
enables FP&A to communicate more effectively with                 design your reports if you want to inform, enlighten, ad-
the executive managers and directors of the business,”            vise, guide, warn or even entertain, the most important
said Mosely. “Visualization facilitates this dialogue. It         thing you must do is reach your audience. No matter
also harnesses the power of the human visual system to            what your objectives are, if you can’t reach the audience,
digest key messages rapidly. Visualizations can be more           you won’t be able to communicate with them.”
engaging than tables, particularly when they are de-                 “When you present to the board or senior executives,
signed to answer a well-thought-out business question.”           present your information in trend lines. Don’t give them
                                                                  just one or two spots,” said Ivan Koon, a former FP&A
                                                                  professional who now works as an adviser to start-up
                                                                  companies. “Be consistent in how you present informa-
                                                                  tion. Your executive team and the board must be able
                                                                  to instantly tell how the business is trending over time.
                                                                  Show exceptions through the same set of graphs. Those

www.AFPonline.org                        ©2014 Association for Financial Professionals, Inc. All Rights Reserved               7
AFP GUIDE: Data Visualization: How to Tell Number Stories with Pictures
graphs should illustrate where/when the lines have to the key information that they need to see, and the
changed and why the exception happened. Make it really frequency with which they need to see it.”
quick and easy to explain business trends. If you do that, From a graphics perspective, every executive and every
you can save so much time by anticipating their ques- company is different. A lot depends on culture. “In my
tions, and help decision-making to move forward faster.” previous company, most of the communication was
through graphics,” said Mann. “This company is more
Practitioner perspective numbers oriented. They see graphics as potentially hid-
The biggest challenge in communicating financial ing the truth. Culture is huge in the role graphics play.
information really depends on the audience, accord- There’s a clear executive preference in how they like to
ing to the vice president of finance at a multinational view things.”
technology corporation. “When you have a broad, mixed According to Hunt, the message has to be tailored
bag of audiences, with some who understand numbers to the board and executive committee. “These are very
and some who don’t, you have to strike the right balance smart people who see multiple presentations each day.
between detail and conceptual information,” he said. It’s very important to include the key takeaway from
Finance is often about very precise messages, for example, each graph in the actual image. As you go down the
revenue is reported with precision. “The challenge is to keep chain, you provide more detail and need not highlight
it broad enough for the audience to understand what you’re the key takeaway because the audience is close enough to
trying to say versus trying to deep dive,” said the vice presi- the story to get it instantly.”
dent of finance. “In my work, I’ve learned that graphics that
are simple work more effectively,” he said. “They have to be
connected to the story you’ve got to tell and the top-level Constructing dashboards
message you’re trying to communicate.” Dashboards are perhaps the most common use of visual
That’s true of both senior level executives and broader displays, particularly those used by finance professionals to
audiences. “It doesn’t mean you don’t have to be armed communicate key financial metrics to senior management.
with the details behind it. Keeping it simple and well- Creating an effective dashboard is no easy task: most struggle
structured is the most important thing.” with selecting the right charts and striking the right balance
To tailor the presentation, think about the nuance between high-level visualization and detail.
you need to include and the degree of detail you need to According to BPM’s Schiff, it’s important to keep the
provide, he said. With broader audiences, you may use a content of your visual dashboard simple and specifically
detailed view of next year’s budget, but your presentation relevant to your audience. “A dashboard is an opportu-
to senior executives would be different. It’s an adjust- nity to think about what’s important to this business,
ment that takes time. “That’s the biggest challenge,” he include only a handful of strategic key measures and how
said. “Most finance folks have the data but also have the business is performing against them, so you really
many presentations to do. It’s time consuming to actively focus on what’s important,” he said.
keep tailoring those messages.” Laird found that as soon as you develop a dashboard,
David Mann is director of financial planning and it’s relevant for a quarter. “Then management says, what
performance of Tufts Health Plan, a health manage- we really need to see is this. They want a different for-
ment company with $4 billion in revenue. According mat. It becomes a moving target,” he said.
to Mann, the biggest challenge in communicating data “What we’re seeing is a trend to seek out advisors who
is in ensuring executives feel ownership of the numbers can provide more agile analysis to explain the implica-
so they actually care. The second biggest challenge is tions of the data. Executives, in my experience, are very
including the right level of details. short-sighted. They want someone to tell them what the
“The question is what material things they need to right decisions are. They want trusted advisors who can
know to manage their business,” he said. “As a result, be agile enough to answer the tough questions. That’s
every deck is different and in a digestible format. It goes not something any application can provide.”
8 ©2014 Association for Financial Professionals, Inc. All Rights Reserved www.AFPonline.orgAFP GUIDE: Data Visualization: How to Tell Number Stories with Pictures
“Creating dashboards is ultimately a presentation
exercise, not an analytics effort, said Joseph D’Ascoli Tips on dashboards
managing director, Office of CFO Solutions at FTI Following are some tips from
Consulting. “Effective dashboards utilize a variety of D’Ascoli to help you design an
techniques, from spark-lines to color variations, but effective dashboard.
the key is the relation of the technique to the data and
• Include only the information that
insight being shared. We strive for clarity and preserva-
is relevant to the decisions senior
tion of white space in our dashboards to avoid infor-
managers will be making. There is
mation overload and focus on the key takeaways from
a propensity to include all avail-
the data.”
able data and metrics. This defeats
One of the main reasons that dashboards work is
the purpose of the dashboard and
that they “flatten” multiple data displays into a single
will make it difficult to identify key
space. This allows the viewer to draw connections be-
pieces of information that will drive
tween several analyses and understand the data as much
better business decisions.
more than the sum of its charts. “Dashboards should
be designed to maximize this effect, allowing the user • Keep the metrics strategic, objective
to understand the interrelations of the data displayed,” and measurable. Example: In finance,
he said. it’s not important to measure the num-
Additionally, D’Ascoli said, “providing context is ber of projects implemented; we want
essential to dashboard creation. Data visualization tools to know what impact those projects
enable data summarization with averages, standard had on company performance.
deviations, upper and lower quartiles allowing viewers
• Provide a clean, consistent dash-
to easily understand the data’s context. Avoiding the
board that conveys insight. Many
“snapshot tendency” and blindness to trends is critical;
dashboards include a plethora of
effective dashboards also provide derivative or ‘change
colors, graphs, and fonts. Competing
over time’ information.”
or inconsistent use of color will draw
According to SAP’s Pype, to design an effective
the eye in a variety of directions and
dashboard, you’ve got to know your audience. “Things
confuse the audience as to what the
can get really cluttered really fast,” she said. If it’s in an
colors mean. A variety of graphs
interactive dashboard, give a good overview first and
require the reader to continually
allow users to filter and drill down to relevant details.
decipher the meaning, slowing them
And be sure to create different dashboards for different
down as they work to interpret the
audiences. “The interaction should lead them to ask
meaning of each type of visual.
the questions they need to ask. Anticipating the ques-
tion will support the user’s analytical flow.” • It is essential to design effective,
When creating a dashboard, simplicity is key. “Don’t actionable dashboards. It is often
just build it and throw it over the wall,” said Saliter. the case that a report suggests
“It needs to be an iterative creation process. Show it to the something counter-intuitive to
users. Get feedback and adjust by incorporating that feed- corporate thinking or tradition, so
back into the next iteration.” (See examples next page.) the information included must be
defensible and accurate. The design
must demonstrate knowledge of
business processes in order to
inspire confidence.
www.AFPonline.org ©2014 Association for Financial Professionals, Inc. All Rights Reserved 9AFP GUIDE: Data Visualization: How to Tell Number Stories with Pictures Dashboard Examples: Qlik Finance KPIs: Executive CFO dashboard combining key performance indicators from multiple data sources, including unstructured commentary data. Credit Risk: Financial risk KPIs and heat map showing concentrations of risk across different dimensions (e.g., industry, customer, country, credit manager). 10 ©2014 Association for Financial Professionals, Inc. All Rights Reserved www.AFPonline.org
AFP GUIDE: Data Visualization: How to Tell Number Stories with Pictures

Exec Dashboard: Inventory analysis from a supply chain provider that correlates inventory
against sales and expenses.

Practitioner perspective                                                Once she has that information, Barisic decides what
   The message needs to be tailored to the audience. How             data she needs to collect. She then sketches the graphs
that’s done depends on the objective of the message, accord-         on paper and moves them around so that the real estate
ing to Barisic. “For the board and for senior management, I          of the one-page dashboard is utilized most efficiently and
prepare materials with a high-level focus, including only the        effectively. “I also ensure that related data is not frag-
most salient points necessary for decision-making, over the          mented,” she said. When she’s satisfied with the design,
horizon risk management, or as support in strategic objec-           Barisic moves the graphs into Excel “where I make
tives development,” she said. “For operational leaders, the          further iterations based on how well the graphs I have
focus is on more detailed, specific and technical information.       chosen actually convey the story I wish to tell.”
Operational leaders need information to enable their day-to-            As for the level of detail, dashboards should portray
day decision-making, so messaging needs to be focused and            information in a clear, concise, meaningful and efficient
more frequent.                                                       way, according to Barisic. “Dashboards are meant to
   “Before even beginning the dashboard design, I think              provide an at-a-glance monitoring, which can only be
very carefully about the objectives of the dashboard, the            achieved if the level of detail is minimized based on
messages that it should convey, the audience who will                the audience,” she said. Summarized information that
utilize the dashboard, as well as the frequency of data up-          requires additional detail once initially reviewed should
dating and dashboard dissemination,” Barisic continued.              be provided as a supplement to the dashboard.

www.AFPonline.org                          ©2014 Association for Financial Professionals, Inc. All Rights Reserved            11
AFP GUIDE: Data Visualization: How to Tell Number Stories with Pictures

    Ultimately, Barisic said, “dashboard design and de-                  According to the high-tech company finance director,
velopment is an iterative process. Even when the initial              the company uses multiple dashboards with numerical
draft is completed and presented to the audience, we                  information for the finance folks who want to see the
should be receiving and welcoming additional feedback                 numbers behind the image. The dashboards are almost
on the dashboard itself and how well it is communicat-                always daily and include some graphics. While he says
ing to the audience. This feedback is then incorporated               that there are no hard-and-fast rules on how to design
into future iterations of the dashboard.”                             good dashboards, “We try to design them to fit the
    Barisic sticks to one page or a single screen for at-a-           broadest set of users and make them highly legible and
glance review. “Measures that are related and need to                 consistent,” he said.
be reviewed together should be on the same page (basic                   Øyvind Strand, business domain responsible for
visual perception and data visualization studies).” Frag-             finance, HR and CRM for the Business Intelligence
menting data is not recommended when data shown is                    Competency Centre at Norwegian risk management firm
linked and needs to be viewed together. This is not only              DNV GL, has been working with maritime, technol-
important for dashboards, but for the design of other                 ogy and energy performance management and business
financial management tools as well (e.g., financial system            intelligence his entire career. The objective of DNV GL,
design, particularly data entry screens).                             he said, is to make itself and its core customer smarter,
    “The goal of a dashboard is to communicate informa-               safer and greener. “We use performance management and
tion to an audience in a simple, clear and effective way,”            fact-based analytics to differentiate ourselves,” he said. The
Barisic said. “This means that we need to fully under-                dashboards are thus not only used internally but also in
stand the objectives of the audience before designing the             customer interface.”
dashboard. Once we have a good understanding of their                    “The whole objective with KPIs is to support every-
objectives, we have to decide on an appropriate display               body in the organization to make better decisions and
media to use: graph types or well-designed tables. We                 to contribute to developing the company,” he said.
need to know how to organize dashboard information so                 “And the main challenge is to ensure the measurement
that data is meaningfully and effectively organized and               generates action. The problem is often that employees
not fragmented.”                                                      cannot see how their actions fit into the overall goal.
    Consistency is also important. “Choose a display me-              So visualization is for top management as well as for
dia or two and stick to them,” said Barisic. “If you have             providing line-of-sight to employees so they can see how
multiple display media, such as bar charts, line charts,              they contribute to the goals on a daily basis. Customer
tables, etc. in one dashboard, the viewer will need to                service managers or key account managers must be able
adjust their view and perception to absorb the layout and             to see how to work toward the customer, improving
message of each display/. “This adjustment takes time                 the services provided and business processes in order to
that most executives have very little of, especially if they          contribute to the strategy and growth.
are trying to very quickly make a decision.”                             “We were challenged to trigger engagement and
    To assess whether a chart is good or not, “I look to see          introduce celebration of good results — not just red
if the graph enables me to process all of the data quickly,”          flags. Over the past 3-4 years, we have tried to wrap this
Barisic said. The question she asks is: “Can I easily interpret       information into a good story, because good stories al-
the graph, and is my focus drawn to data or some other                ways have a compelling advantage,” said Strand. “When
aspect of the graph?” She also looks to see if the information        we started to work with a strategic KPI dashboard, it
is presented via an appropriate media/graph type. “Then I             was mainly meant for senior management, but then it
continue to evaluate the scaling and labeling and the use of          became about getting everyone in the organization to
color. Has everything that needs to be eliminated from the            understand our main objectives and strategy and to see
graph been done so that the focus is on data only?”                   beyond their daily work.”

12                     ©2014 Association for Financial Professionals, Inc. All Rights Reserved             www.AFPonline.org
AFP GUIDE: Data Visualization: How to Tell Number Stories with Pictures
DNV GL Dashboard
Source: DNV GL. Data shown is for illustration purposes only and does not reflect DNV’s real status.
According to Fleishman, the most effective dash- Mann disagrees. “When I think about what graphics to
boards are one-pagers that are not too dense and use all show, I think about two things: information that’s recur-
the information on the slide to tell a story in a unique ring on a monthly or weekly basis that should have a con-
way. He’s a fan of switching out the graphs so people sistent format and consistent graphics, for example P&L;
don’t get used to seeing the same thing every week and and expenses on a monthly basis versus budget, perfor-
are instead drawn to the new image. “It gets people at- mance metrics. You need to establish a common format.
tention because it’s new,” he said. “Adding a little text to That makes it easy for executives to scan the report and
explain the visual is also very helpful.” instantly get a sense for how the business is performing.”
Taking dashboards to the next level
According to Strand, “The best way to become smarter and differentiate yourself is to
give the customer something that’s not offered by others. In the maritime area, for
example, our customers must ensure that their vessels comply with a number of quality
standards. For instance, the port authorities control the vessels coming to port. If they do
not comply with the requirements, they will get deficiencies and, in the worst cases, be
detained and not allowed to leave port. This is a big threat to the ship owners.
“Port authority controls mean higher costs and loss of income for the ship owner,” he said.
“We have systems in which we track a lot of data related to a customers’ vessels and the
segments that are natural to benchmark them against. We are able to assist them in
identifying the problems, analyzing possible causes, and recommending improvement
activities — all based on the available information our customer service managers
possesses through this performance dashboard. It’s not about the data only. It sparks
dialogue with customers and builds trust between us.”
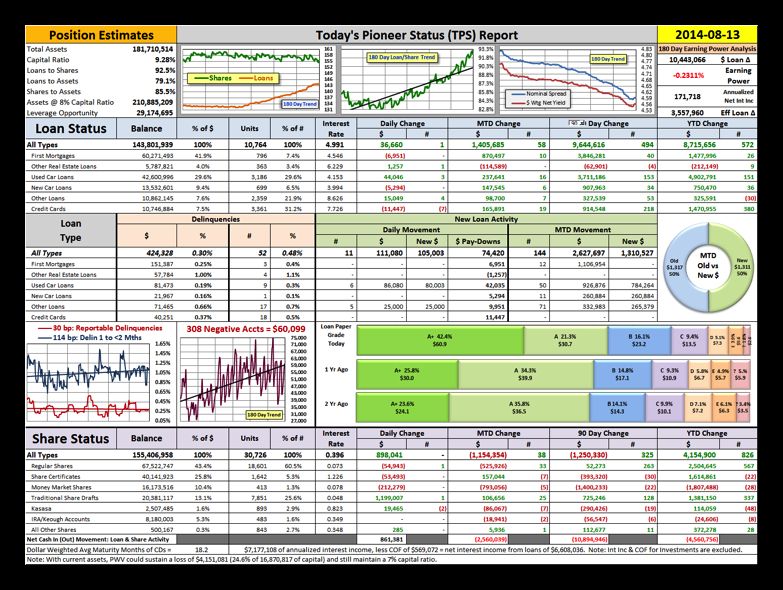
www.AFPonline.org ©2014 Association for Financial Professionals, Inc. All Rights Reserved 13AFP GUIDE: Data Visualization: How to Tell Number Stories with Pictures Example Dashboard #1 Not everyone tailors the message to specific audi- note that some of the associated verbal commentary may ences. “Interestingly, from a visual standpoint, we be modified to fit the audience.” communicate a good bit of the same information in The dashboard the credit union uses has been nationally the same form to different audiences,” said Dan Mc- recognized more than once as an example of best practices Gowan, CEO of Pioneer NV Federal Credit Union. in the field. “Admittedly, to the casual observer’s eye, it “For instance, it’s not uncommon at our monthly staff may look like a jumbled mess of tables and graphs,” he meetings for employees to see some of the very same said. “But to the CEO, CFO, and COO, this one-page, PowerPoint slides the board sees at its meeting,” he legal-size landscape dashboard tells us where we begin the said. “A big part of the reason for that is a desire to day every day of the year and keeps us focused on the key be transparent to all stakeholders.” Still, he said, “We success factors of the business.” 14 ©2014 Association for Financial Professionals, Inc. All Rights Reserved www.AFPonline.org
AFP GUIDE: Data Visualization: How to Tell Number Stories with Pictures

Example Dashboard #2

   McGowan frequently uses double-axis graphs to show
relationships among different items.
   And year-over-year composition of assets to show the trends:

Source: Pioneer NV Federal Credit Union

www.AFPonline.org                       ©2014 Association for Financial Professionals, Inc. All Rights Reserved   15
AFP GUIDE: Data Visualization: How to Tell Number Stories with Pictures

        Don’t give up on tables
        “My central premise is that presenting numbers is a communication skill,”
        Bolten said. “One of the things that you have to do is present them in a way
        that your key information can be easily and quickly grasped. That’s especially
        important in a world where people aren’t spending much time looking at your
        information. If you know that people in your audience spend five minutes, how
        clearly you present the information can mean the difference between their
        spending five minutes absorbing the content, or four minutes figuring out how
        to read it, and just one minute absorbing the information. Of course that’s true
        for both graphs and tables.
          “My recommendation is to consider presenting more information in tables.
        It’s a more consistent and concise way to present all of the information. Then
        pick 2-3 graphs for the week. By selecting only a handful, you’re more likely to
        make executives understand the important points,” he said.
          “Visual presentation is most useful when you’re trying to present a trend
        or pattern,” Bolten said. “The problem with most graphs is that they take up
        a lot of space to present relatively little information. Often you’re just trying
        to communicate information and not make any specific point, and you don’t
        know which data points the people in your audience will be most interested in.
        Presenting all that information in graphical form may just end up being boring,
        confusing, and uninformative.”
          “While it’s true that many people insist they prefer to get graphs, the reality
        is that if you showed executives a bunch of graphs and then instructed them
        to turn off the screen and tell you what they’ve learned from the graphs, you’d
        be astonished by how little information they’d have actually absorbed,” Bolten
        said. “I absolutely think there’s a place for graphical presentation. It’s just that
        it’s too easy to make the assumption that presenting in graphs and tables is
        just a matter of presentation preference. It has to be about the kind of informa-
        tion that’s being portrayed. There’s really a time and a place for a graph and a
        table. The overlap isn’t nearly as big as most people think. Even if you do the
        graphs correctly, the information content can be surprisingly light. Tables can
        be more complete and more precise. When you create a graph, have some-
        body else look it over and then ask them to tell you what they’ve learned from
        it. You’d be surprised what you find out.”

16                ©2014 Association for Financial Professionals, Inc. All Rights Reserved   www.AFPonline.org
AFP GUIDE: Data Visualization: How to Tell Number Stories with Pictures
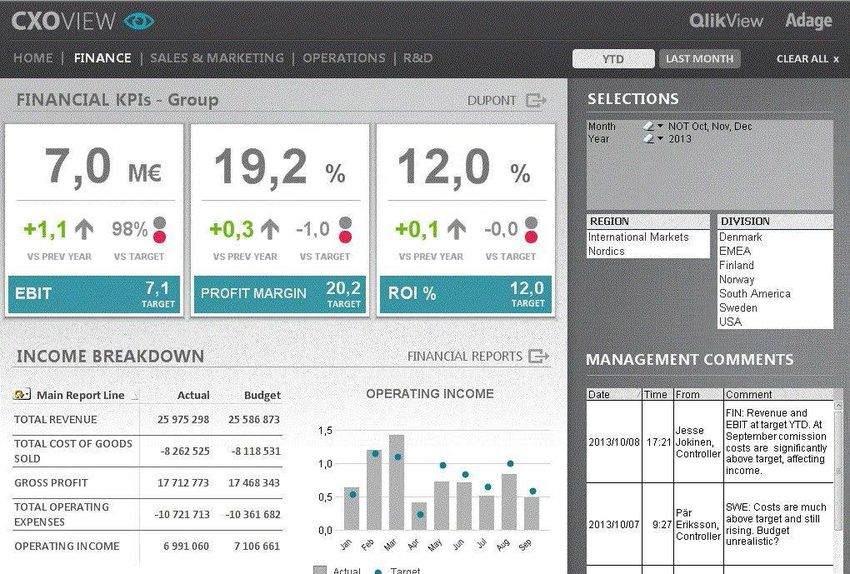
Pie charts FY 14 Q2 Forecast Total: $750,000
Computer Services
There’s a big debate about the utility of pie 2%
Travel and Business Entertainment Editing/Publishing
charts. Most experts advise against them, 2% 2%
noting that they are harder to read and of- Conference, Meetings
and Exhibits
ten the small differences between slices are 7%
easy to miss. Below is an example of a chart Office Expenses
and Other Costs*
first created as a pie chart and then, when 7% Salaries
and
rules of best practices in visualization are Depreciation, Interest Benefits
and Maintenance 61%
applied, recreated as a bar. 10%
“Our current belief is that getting rid of Contracts and
either completely is not productive,” said Professional Fees
9%
Laird. “Our built-in construct library does
contain pie charts for certain contexts; we FY 14 Jan Actual Total: $387,000k
believe they are especially useful when Computer Services
comparing the impact of two different sce- 2.7%
Travel and Business Entertainment Editing/Publishing
3.5% 1.4%
narios on an annual basis when limited
Conference, Meetings
variables (3 or 4) are involved (usually a and Exhibits
business unit or region). In this case, it might 5%
Office Expenses
be any measurement: OPEX, bookings, rev- and Other Costs*
8% Salaries
enue, contribution margin, etc. Many would and
Depreciation, Interest Benefits
argue that a column or bar format would be and Maintenance 60.3%
preferable even in these cases. We would 9%
say that, especially in the example provided Contracts and
Professional Fees
here, simplicity is actually preferable and 10.1%
easier for cognitive processing.” *Other costs category includes marketing and promotions costs.
According to Mosely, pie charts can act
as a useful visualization Data graphed after applying data visualization rules:
• When you want to affect your 0% 10% 20% 30% 40% 50% 60% 70%
audience emotionally. Salaries and Benefits
• When you want to quickly communi- Contracts and Professional Fees
Depreciation, Interest
cate a part-to-whole relationship. and Maintenance
Office Expenses
• When approximate values are enough and Other Costs*
Conference, Meetings
to have a productive discussion. and Exhibits
Travel and Business
But only if … Entertainment
• The parts make up a meaningful Computer Services
whole; if not, use a different chart. Editing/Publishing FY14 Jan Actual FY14 Q2 Forecast
• You can define the entire set in a way *Other costs category includes marketing and promotions costs.
that makes sense to the viewer. Multiple benefits were achieved by applying data visualization
rules:
• The parts are mutually exclusive; if a. Two graphs have been combined into one allowing for
there is overlap between the parts, a. Easy comparison between data sets (FY14 Q2 Forecast
to Actual)
use a different chart. b. Additional real estate on documents with limited space
• You want to compare the parts to the b. Different type of display media was used to more clearly
show the relationship between the expense types
whole, rather than to each other. c. Color was used sparingly to mark forecasted expense
• You have fewer than eight parts; pie percentages drawing attention to the most important
aspects of the graph
charts with lots of slices (or slices of d. By using a different display media there is more data
flexibility. For example, another dimension could be added
very different sizes) are hard to read.
to the bar graph such as FY14 budget data etc.
www.AFPonline.org ©2014 Association for Financial Professionals, Inc. All Rights Reserved 17You can also read