Genetic composition, origin and conservation of loggerhead sea turtles (Caretta caretta) frequenting the French Mediterranean coasts
←
→
Page content transcription
If your browser does not render page correctly, please read the page content below
Marine Biology      (2021) 168:52
https://doi.org/10.1007/s00227-021-03855-6

    ORIGINAL PAPER

Genetic composition, origin and conservation of loggerhead sea
turtles (Caretta caretta) frequenting the French Mediterranean coasts
Anaïs Loisier1 · Marie‑Paule Savelli1 · Véronique Arnal1 · Françoise Claro2 · Delphine Gambaiani1,3,4 ·
Jean Baptiste Sénégas3 · Cathy Cesarini4 · Jacques Sacchi4 · Claude Miaud1 · Claudine Montgelard1,5

Received: 16 October 2020 / Accepted: 3 March 2021
© The Author(s), under exclusive licence to Springer-Verlag GmbH Germany, part of Springer Nature 2021

Abstract
This study aims to characterise the genetic structure and composition of 245 individuals of loggerhead sea turtles collected
from stranding and bycatch events along the French Mediterranean coasts (Gulf of Lion, Provence and Corsica). We obtained
sequences of the mitochondrial control region for two fragments (683 bp and 241 bp for 170 and 51 individuals, respec-
tively). The analysis of the long fragment revealed that 163 samples (95.9%) are attributed to the haplogroup II (mainly
Mediterranean) whereas only seven individuals are included in haplogroup IB (Atlantic Ocean). The mixed stock analysis
performed on the same dataset indicated that the biggest rookeries from the eastern Mediterranean mainly contributed to
the French stock, with major contributions being from Greece (36% and 56% for adults and juveniles, respectively), Crete
(12% and 18%) and Western Turkey (14% and 4%). The thirteen microsatellite nuclear markers that have been analysed for
81 specimens did not reveal much genetic structure within sampled individuals, thus suggesting that the studied individuals
could belong to the same genetic group. The microsatellite analyses revealed however that the nine individuals issuing from
two nests sampled in Gulf of Lion and Provence are clearly differentiated from the remaining samples, thus suggesting a
long-distance colonisation of the western Mediterranean. Our results allowed addressing the question of loggerhead turtle
conservation in the western Mediterranean basin that until now is not considered as a Management Unit despite high densi-
ties of juveniles and recent nesting observed on French, Italian and Spanish coasts.

Keywords Western Mediterranean Sea · Mitochondrial DNA · Microsatellite DNA · Genetic structure · Mixed stock
analysis · Conservation genetics

                                                                            Introduction
Responsible Editor: C. Eizaguirre
                                                                            The loggerhead sea turtle (Caretta caretta), the most abun-
Reviewers: L.S. Arantes and Y. Tikochinski.                                 dant sea turtle in the Mediterranean Sea (Broderick et al.
                                                                            2002), is a highly migratory animal living in temperate
* Claudine Montgelard                                                       and sub-tropical waters in all ocean basins (Dodd 1988).
  claudine.montgelard@cefe.cnrs.fr
                                                                            Caretta caretta shows a complex life cycle involving series
1
     CEFE, Univ Montpellier, CNRS, EPHE-PSL University                      of habitat shifts during their lifetimes (review in Bolten and
     (Biogéographie et Écologie des Vertébrés), IRD, Univ Paul              Witherington 2003; Casale and Tucker 2017). After hatch-
     Valéry Montpellier 3, Montpellier, France                              ing on land, juveniles are transported by sea surface currents
2
     Muséum National D’Histoire Naturelle, UMS PatriNat OFB                 and discover the great ocean spaces in search of pleasant
     CNRS MNHN, Paris, France                                               temperature and food. As sub-adults, they frequent feeding
3
     Centre d’Etude et de Sauvegarde des Tortues Marines de                 areas in coastal habitats whereas adults travel hundreds of
     Méditerranée (CESTMed), Le Grau du Roi, France                         kilometres between their feeding ground and breeding site
4
     Société Herpétologique de France, Réseau Tortues Marines               (reproduction every 3 to 5 years, see Bolten and Withering-
     de Méditerranée Française, CP4157, Paris, France                       ton 2003). In this context, this slow maturating species is
5
     Department of Zoology, Centre for Ecological Genomics                  threatened by numerous and strong anthropogenic pressure.
     and Wildlife Conservation, University of Johannesburg,                 Intentional fishing, incidental captures (bycatch), collision
     Johannesburg, South Africa

                                                                                                                               13
                                                                                                                          Vol.:(0123456789)
52     Page 2 of 15                                                                      Marine Biology    (2021) 168:52

with boats, interactions with debris (ingestion, entangle-        both contemporary and evolutionary timescales. Further-
ment) and habitat degradation are the main factors responsi-      more, because most females are supposed to return to
ble of the general decline of populations (Margaritoulis et al.   their rookery of origin, each nesting population should
2003). In this regard, the Mediterranean Sea is one of the        possess a genetic signature in terms of female transmitted
most important hotspots for sea turtle bycatch (Casale and        mtDNA. This genetic marker has proven to be useful to
Margaritoulis 2010; Splendiani et al. 2017) which concern         identify the genetic composition of different nesting areas
juveniles as well as adults.                                      and thus to determine which sea turtle rookeries contribute
    The complex features characterizing the loggerhead sea        to a particular feeding ground (Bass et al. 2004). Indeed,
turtles (large distribution and dispersal, the complexity of      mtDNA data resolved nesting habitats at the Atlantic and
life cycle and diversity of threats) make adapted measures        Mediterranean scales, which differed significantly in hap-
of protection challenging to implement and requiring the          lotype composition and frequency (Bowen and Karl 2007).
integration of diverse information. Wallace et al. (2010)         By contrast, the analysis of nuclear DNA microsatellites,
conducted a multi-scale study including multiple tools and        thus biparentally inherited markers, usually revealed no
techniques to define Regional Management Units (RMU)              genetic structure between rookeries or foraging areas
for several marine turtles at a worldwide scale. For the          (Bowen et al. 2005, Monzón-Arguëllo et al. 2010, Yilmaz
loggerhead turtle, this study identified the Mediterranean        et al. 2011, Garofalo et al. 2013), a result that is usually
Sea as one RMU. Later, Shamblin et al. (2014) recognized          attributed to male-biased gene flow. By contrast, the study
additional structuring in defining seven MUs on the basis of      of Clusa et al. (2018) based on 15 microsatellites and 8
genetic structure and gene flow among 17 rookeries of the         nesting grounds from the Eastern Mediterranean identi-
eastern Mediterranean Sea.                                        fied 5 clusters thus suggesting that widespread male gene
    The main nesting sites of C. caretta in the Mediterra-        flow could have been overstated. At the Mediterranean
nean Sea are located in the eastern basin (Cyprus, Greece,        scale, molecular studies concerned nesting rookeries and
Turkey, Syria and Libya; Casale and Margaritoulis 2010).          foraging grounds in different places (eastern and central
Females usually return to the same nesting beach in suc-          Seas, Spanish and Algerian basins; Carreras et al. 2007;
cessive nesting seasons and they also return to their natal       Garofalo et al. 2013; Clusa et al. 2014). These studies indi-
beach to nest (see Bolten and Witherington 2003). This            cated that loggerhead sea turtles frequenting the Mediter-
behaviour called “philopatry” or “natal homing” has con-          ranean have different geographical origins (not only from
sequences as evolutionary drivers as it can conduct to the        different Mediterranean places but also from the Atlantic
formation of genetic structure and reproductively isolated        Ocean). Moreover, turtles are not uniformly distributed in
matrilines (Bowen et al. 2005). However, it has been shown        the different basins as exemplified by the turtles of Atlantic
that females nesting in the north-western Atlantic have a         origin that are predominantly found in the Algerian basin
remigration rate close to 70%, which means that a signifi-        (Clusa et al. 2014). However, if most Mediterranean areas
cant proportion of nesting females are not strictly philopatric   have been considered until now no study has concerned
and lay their clutches in other nesting beaches (Richardson       sea turtles that can be found off the French coastline.
et al. 1978). Moreover, there is a distinction between nest-         The purpose of this study was to trace the diversity
ing and feeding turtle aggregations. The benthic habitats,        and origin of adults and juveniles of loggerhead turtles
used as foraging areas by sea turtles, are referenced in both     (C. caretta) stranded or accidentally caught on the French
oriental and occidental Mediterranean basins (Laurent and         Mediterranean coasts of the Gulf of Lion, Provence and
Lescure 1994). These feeding grounds that are of particular       Corsica on the basis of mitochondrial and nuclear DNA.
importance for juveniles bring together individuals of dif-       To this end, we analysed sequences of the mtDNA control
ferent origin (from Mediterranean and Atlantic rookeries,         region (241-bp and 683-bp) as well as 13 microsatellites
see Casale and Tucker 2017), with likely consequences on          loci developed by Shamblin et al. (2007) and Monzón-
the expected genetic composition of both groups. Moreover,        Argüello et al. (2008). Specifically, the objectives were
incidences are also anticipated according to the sea turtle       to (1) characterize the population structure and evolution-
developmental stage because adults are likely representing        ary history of loggerheads found on the French Mediter-
Mediterranean residents whereas more geographical mixing          ranean coasts by describing the mtDNA haplotypes and
is expected for juveniles.                                        nuclear microsatellites composition, (2) infer the origin
    The genetic characterization of loggerhead sea turtles        and assemblage of French sea turtles using a mixed-stock
has been mainly conducted through the analysis of mito-           analysis (MSA), and (3) draw some conclusions in terms
chondrial DNA (mtDNA) control region sequences. As                of conservation, notably with respect to juveniles and
maternally inherited, this marker gives information about         sporadic nesting events recently occurring on the sandy
the genetic architecture of loggerhead populations over           beaches of the Gulf of Lion and Provence.

13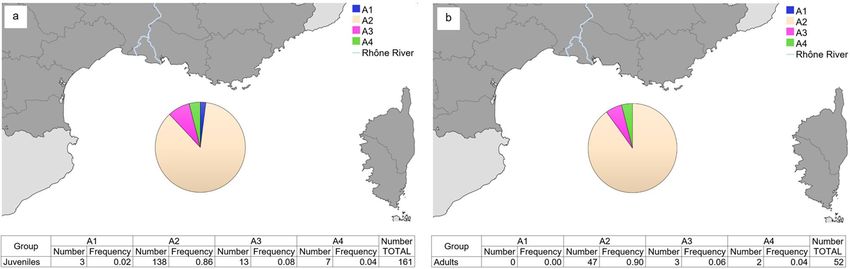
Marine Biology (2021) 168:52 Page 3 of 15 52
Materials and methods stranded along the Mediterranean coastline whereas eggs,
embryos or dead hatchlings (N = 14) were collected in
Sampling and molecular analyses three nests from three localities (see details below). The
sex of dead individuals was determined by the observation
Loggerhead turtles are strictly protected in France of gonads during necropsies. For live turtles, adult males
(national decree of October 14, 2005) and the sample col- and females were identified with secondary sexual charac-
lection was allowed by the decree of December 31, 2012 ters (i.e. size and shape of the tail). Each turtle was meas-
on the renewal of the environmental protection approval ured (minimum curved carapace length; CCLmin ± 1 cm).
of the Société Herpétologique de France (SHF), and the The mean size of males was 56.2 ± 0.21 cm (min = 31.5;
decree of October 24, 2016 on the collection of biologi- max = 79.0 cm, N = 21) and the mean size of female was
cal data in the event of sea turtle stranding or bycatch 58.6 ± 0.13 cm (min = 30.0; max = 76.0 cm, N = 37). The
on French metropolitan coasts (NOR: DEVL1500415N) 156 individuals for which the sex was undetermined had a
for the mainland sea turtle observatory program of the CCLmin of 43.25 ± 0.05 cm (min = 27.0; max = 75.0 cm)
National Museum of Natural History (MNHN). and were classified as juveniles. Twelve individuals
Blood and tissue samples from 245 loggerhead turtles measured less than 10 cm (7.69 ± 0.04 cm, min = 5 cm;
or eggs were collected from 1989 to 2018 on the Mediter- max = 10 cm) were also considered as juveniles. For 19
ranean coastline of three regions (Fig. 1, Online Resources individuals, no information was available about sex or
1 and 2): Gulf of Lion (from the Spanish-French border to body size (Online Resources 1).
western Var: departments of Pyrénées-Orientales, Aude, Blood samples (N = 218 with 46 samples from dead spec-
Hérault, Gard, Bouches-du-Rhône, western Var), Provence imens and 172 from live animals) were collected from the
(department of Alpes-Maritimes and eastern Var) and Cor- dorsal cervical sinus and stored in 70% ethanol at 4 °C. Tis-
sica (departments of Haute-Corse and Corse du Sud). sue samples (e.g. 1 cm3 of muscle from the pectoral region
Turtle specimens (see Online Resource 1 for charac- or front flippers) were collected from dead individuals and
teristics of individuals) were caught accidentally or found stored at − 20 °C. Tissue samples from nests consisted of
eggshell fragments preserved in 10° formalin (N = 4; nesting
Fig. 1 : Sampling locations along the Mediterranean French coastline. Letters corresponds to localities provided in Online Resource 2
13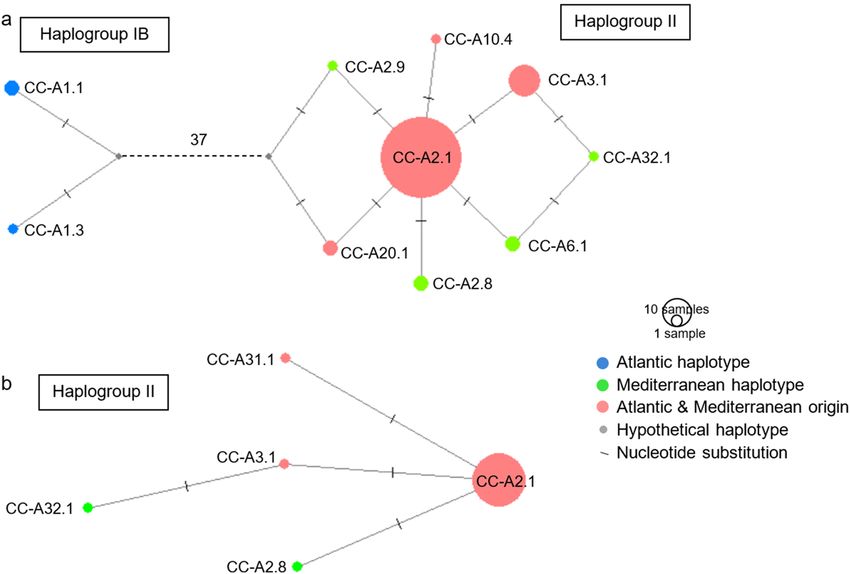
52 Page 4 of 15 Marine Biology (2021) 168:52
event in Saint-Tropez [af in Fig. 1], Var in July 2006), whole dilution of PCR products according to the amount of DNA,
eggs preserved in 70% ethanol (N = 5; nesting event in genotyping was performed on a 24-capillary sequencer
Saint-Aygulf [ag], Var in July 2016) and dead hatchlings (3500XL DNA Analyzer, Applied Biosystems) at the plat-
or embryos kept at − 20 °C (N = 5; nesting event in Ville- form « Génotypage-Séquençage» of the labex « Centre
neuve-lès-Maguelone [k], Hérault in October 2018). DNA Méditerranéen de l’Environnement et de la Biodiversité»
was extracted from blood samples using the REDExtract-N- (Montpellier, France). The generated microsatellite profiles
Amp Plant Kit (Sigma) or with the Qiagen DNeasy Blood were visualized using GeneMapper Version 5.0 (Applied
and Tissues kit (QIAGEN®) for tissue samples following Biosystems) and the genotype was determined after two
the manufacturers’ instructions. readings by two independent people.
Mitochondrial DNA Population genetic analysis
A fragment of non-coding mtDNA control region was Mitochondrial DNA
amplified by Polymerase Chain Reaction (PCR) using the
primers LCM15382 (5′-GCT TAA C CC TAA AGC ATT Sequences were aligned, edited and compared to previously
GG-3′) and H950 (5′-AAACCCCTAAATCCGAGAC-3′) described haplotypes using the BIOEDIT program Version
(Abreu-Grobois et al. 2006) referred to as “long sequence” 7.2.5 (Hall 1999). Sequences were assigned to haplotype
(~ 800 bp) or with primers LCM15382 and CC443 (5′-TGA designations according to the nomenclature rules pub-
TCTATTCTGGCCTCTG-3′; Shamblin et al. 2014) referred lished at the Archie Carr Center for Sea Turtle Research
to as “short sequence” (~ 380 bp). PCRs were carried out in (ACCSTR) database (http://accstr.ufl.edu/). All haplotypes
20 µl volume containing 10 µl of ReadyMix™ Taq Sigma previously reported from the Atlantic, Mediterranean and
(2X), 1 µl of each primer at 10 pM (final concentration at Northern Pacific were included in the analyses (Nishizawa
0.5 pM), 7 µl of pure water and 1 µl of DNA diluted at 1/30 et al. 2014; Shamblin et al. 2014). Relationships between
dilution or pure when DNA was degraded (i.e. blood sam- haplotypes were visualized using the software Network
ples from autopsy). PCR cycling parameters were as follows: (Bandelt et al. 1999) with the median-joining algorithm to
95 °C for 3 min; 34 cycles at 95 °C for 30 s, 55 °C for 1 min, allow multi-state data. Haplotype distribution maps were
72 °C for 30 s; and a final extension of 72 °C for 10 min. generated with QGIS Version 3.2.1-Bonn (http://q gis.o sgeo.
Amplification products were separated by 1% agarose gel org"). DnaSP Version 5.10.01 (Librado and Rozas 2009) was
electrophoresis in a 0.5X TBE buffer and visualised with used to calculate mitochondrial diversity indices including
ethidium bromide in UV light. The DNA concentration of haplotype and nucleotide diversities, number of haplotypes
each sample was evaluated after electrophoresis on agarose and polymorphic sites.
gel by comparison with a standard molecular weight marker Past population dynamics through time was inferred
(100pb PCR DNA ladder, Fisher Scientific). The diluted using the Bayesian skyline plot (BSP) model (Drummond
PCR products were sent to Eurofins Genomics (Ebersberg, et al. 2005) implemented in Beast V.1.10.4 (Suchard et al.
Germany) for purification and Sanger sequencing. Electro- 2018). BSP analysis allows describing the change in effec-
pherograms were visually checked and corrected using the tive population size (Ne) in the course of time (the timescale
program CODONCODE ALIGNER Version 5.1.5 for Win- being given by the mutation rate of the sequences analysed).
dows (CodonCode Corporation, Dedham, MA, USA) and a The demographic analysis was performed on haplogroup II
consensus sequence was compiled. using the Bayesian skyline as coalescent and the substitu-
tion model GTR + G + I applied to the non-coding control
Microsatellites region dataset. Two molecular clocks models (Strict Clock
and Uncorrelated Relaxed Clock) were tested using as prior
Thirteen microsatellite loci previously described for C. the mean rate obtained by Duchene et al. (2012) for the con-
caretta (Cc-13, Cc-17, Cc-25 and Cc-28 from Monzón- trol region of marine turtles, that is 3.24 × 10⁻³ substitution/
Argüello et al. 2008; Cc1B03, Cc1G02, Cc2G10, Cc5H07, site/106 years [95% HPD: 2.66–3.81]. Beast was run for 200
Cc5C08, Cc1F01, Cc7E11, Cc1G03 and Cc7C04 from million generations sampled every 1 000th to get ESS val-
Samblin et al. 2007) were used (see Online Resource 3 for ues > 200 for each parameter. Bayesian skyline plots (BSP)
characteristics of loci). Each locus was amplified separately were built using Tracer v1.7.1 (Rambaut et al. 2018) using
using PCR cycling parameters as follows: 95 °C for 15 min; a 10% burn-in.
30 cycles at 94 °C for 30 s, 60 °C or 61 °C for 1 min 30 s A Bayesian mixed stock analysis (MSA) was conducted
(61 °C for the 9 loci from Samblin et al. 2007 and 60 °C to estimate the geographic composition of the individuals
for the 4 loci from Monzón-Argüello et al. 2008), 72 °C analysed using the haplotype frequency (long fragment) of
for 1 min; and a final extension of 60 °C for 30 min. After 23 rookeries (10 Atlantic and 13 Mediterranean rookeries)
13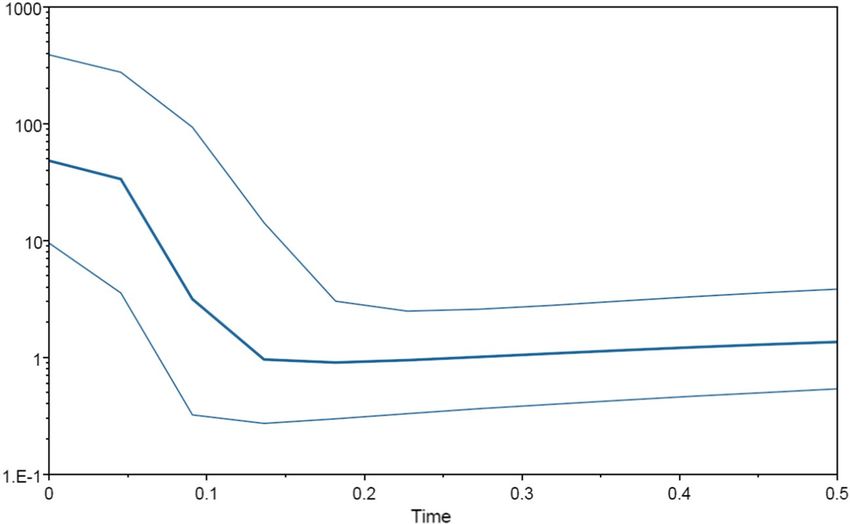
Marine Biology (2021) 168:52 Page 5 of 15 52
as a baseline (Shamblin et al. 2014, Splendiani et al. 2017, CC-A20 was observed for only one individual. These three
Tolve et al. 2018). MSA was performed with the package haplotypes are shared by Mediterranean and Atlantic rook-
MIXSTOCK Version 0.9.5.1 (Bolker 2012) under RStudio eries (Saied et al. 2012; Shamblin et al. 2014). For the long
Version 1.2.5042. fragment, 12 haplotypes were discovered and all of them
have already been described in previous studies. The most
Microsatellites abundant haplotype (81.7% of individuals) corresponds
to the haplotype CC-A2.1 in the ACCSTR database. This
The software MICRO-CHECKER v.2.2.3 (Van Ooster- haplotype was found in all the individuals (eggs and dead
hout et al. 2004) was used to estimate null allele frequen- hatchlings) from the three French nesting sites. Haplotype
cies for each locus. The number of alleles (k), observed CC-A3.1 was the second most common haplotype (7%) fol-
(Ho) and expected (He) heterozygosity, fixation index (F), lowed by haplotype CC-A.1.1 (2%) and haplotype CC-A2.8
Hardy–Weinberg equilibrium (pHWE) deviation and the (1.8%). Haplotypes CC-A1.3, CC-A6.1, CC-A20.1 and
inbreeding coefficient (Fis) were calculated with GenAlEx CC-A32.1 were represented by 2 individuals and haplo-
v.6.502 (Peakall and Smouse 2012). To investigate the types CC-A1.2, CC-A2.9, CC-A10.4 and CC-A31.1 by only
genetic structure, we used the software STRUC TUR E 1 individual.
version 2.3 (Pritchard et al. 2000), which uses a Bayes- Nine individuals showed haplotypes exclusively
ian clustering method to estimate the most likely number described in Mediterranean rookeries (CC-A2.8, CC-A2.9,
of populations (K) without a priori information. Ten runs CC-A6.1, CC-A31.1 and CC-A32.1) whereas five individu-
were carried out by setting the number of clusters (K) from als (all juveniles) had haplotypes exclusively described in
1 to 10 (number of populations) with a burn-in length of Atlantic rookeries (CC-A1.1, CC-A1.2). The large major-
350,000 followed by 2,000,000 Markov Chain Monte Carlo ity of individuals (N = 156; 91.8%) carried the haplotype
(MCMC) iterations. The determination of the most likely CC-A2.1 that is shared between Mediterranean and Atlantic
number of genetic groups was estimated from the method rookeries including Cape Verde (Clusa et al. 2014). Figure 2
of Evanno et al. (2005) using STRUCTURE Harvester (Earl shows the frequency of the different haplotypes for adults
and vonHoldt 2012). A Principal Component Analysis and juveniles.
(PCA) was done to represent the general organization of the
global genetic variability of the sampling considered. PCA Network analysis
was conducted using the RStudioVersion 1.1.456, package
adegenet and ade4 (Dray and Dufour 2007; Jombart 2008) For the network analysis, 119 haplotypes previously pub-
to rank and visualize individuals depending on their genetic lished (Nishizawa et al. 2014; Shamblin et al. 2014) have
proximity. been added to our dataset, thus representing 32 sequences
for the short fragment and 87 for the long fragment.
The network performed on the long fragment (Fig. 3)
Results allowed distinguishing three main haplogroups (nomen-
clature according to Shamblin et al. 2014) that mainly
Genetic diversity and structure based on mtDNA represented geographic groups: haplogroup IB included a
majority of Atlantic haplotypes, haplogroup II encompassed
Haplotypes of the studied individuals haplotypes from the Atlantic Ocean and the Mediterranean
Sea and haplogroup IA corresponded to haplotypes found
Of the 245 samples, we obtained long fragments for 170 exclusively in the Pacific Ocean. Haplogroups IA and IB are
individuals (30 adults, 132 juveniles and 8 unknowns). Neg- separated by 16 substitutions, haplogroups II and IA by 24
ative PCRs for the long sequence (N = 75) were then ampli- substitutions and haplogroup IB and II by 41 substitutions.
fied for the short fragment, leading to 51 supplementary In haplogroup II, haplotypes generally differed by a single
sequences. Among the 24 negative samples, 11 (45.83%) mutation, unlike haplogroup IA and IB where haplotypes
were from necropsies. Because some sequences were shorter were more divergent. Among our 170 individuals, seven
than others, they were truncated to obtain the same length individuals are part of the haplogroup IB (4.1%) versus 163
for all individuals, thus resulting in the long (683 bp) and for the haplogroup II (95.9%) and none for the haplogroup
short (241 bp) alignments. We observed 34 variable sites for IA. In the haplogroup II, 140 individuals have the same and
the long sequences and 13 for the short ones. For the short the most common haplotype CC-A2.1 (85.9%).
fragment (51 sequences), three haplotypes were identified. Two haplotype networks (Fig. 4) were then built on our
One haplotype, CC-A2 in the ACCSTR database, was by long fragment dataset split into juveniles (N = 132) and
far the most common with 86.27% followed by haplotype adults (N = 30). For the juveniles (Fig. 4a), 10 haplotypes
CC-A3 represented by 11.76% of individuals. Haplotype were recovered on which only two haplotypes represented
13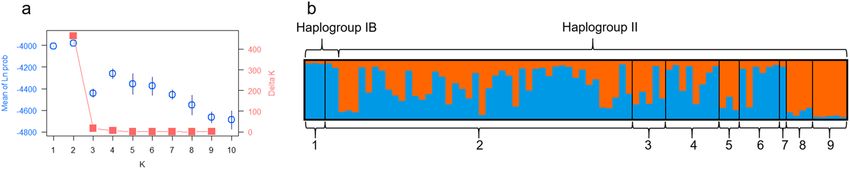
52      Page 6 of 15                                                                               Marine Biology      (2021) 168:52

Fig. 2  Map of   haplotype frequencies for a 161 juveniles and b 52     and CC-A3.1. Group A4 represents other haplotypes (CC-A6.1,
adults. Group    A1 includes haplotypes CC-A1, CC-A1.1, CC-A1.2         CC-A10.4, CC-A20, CC-A20.1, CC-A31.1 and CC-A32.2) of low
and CC-A1.3.     Group A2 comprises haplotypes CC-A2, CC-A2.1,          frequency
CC-A2.8 and      CC-A2.9. Group A3 includes haplotypes CC-A3

Fig. 3  Haplotype network obtained for the long fragment (683 bp)       (2014). Substitutions between haplotypes can be transitions, transver-
of the control region for our 170 samples of Caretta caretta added to   sions or indels. Grey circles indicate unsampled or extinct haplotypes.
the 87 haplotypes from Nishizawa et al. (2014) and Shamblin et al.      Sizes of circles are proportional to sample sizes

by three individuals were included in the haplogroup IB. The            30 adults that all belonged to the haplogroup II (Fig. 4b) still
remaining eight haplotypes corresponded to the haplogroup               with CC-A2.1 in the majority. This haplotype was detected
II among which CC-A2.1 was the majority haplotype (111                  in all departments along the French Mediterranean coastline
juveniles, i.e. 84.1%). Five haplotypes were observed for the           and all localities except for five (Canet-en-Roussillon, La

13
Marine Biology      (2021) 168:52                                                                                     Page 7 of 15       52

Fig. 4  Haplotype network
obtained for the long fragment
(683 bp) of the control region
for a 132 juveniles and b 30
adults of Caretta caretta. Sub-
stitutions between haplotypes
can be transitions, transversions
or indels. Grey circles indicate
unsampled or extinct haplo-
types. Sizes of circles are pro-
portional to sample frequencies

Grande Motte, Carqueiranne, Bonifacio and an unknown                         Calculations performed on the different datasets reflected
locality; see Online Resource 2) but only one or two samples             the same trend i.e. the haplotype diversity (Hd) is higher
were collected in these localities. The second most abun-                for the long than for the short fragment. In all cases, haplo-
dant haplotype (CC-A3.1) is represented by 12 samples from               groups IA and IB are more diversified than haplogroup II in
eight different locations. These two haplotypes are found in             agreement with the network (Fig. 3). Haplogroup II is a star-
Mediterranean and Atlantic basins. The haplogroup IB is                  like network showing a majority haplotype (CC-A2.1) from
represented only by seven samples and six different locations            which numerous minority haplotypes are issued. Haplogroup
(see Online Resource 2).                                                 II is also characterized by a lower nucleotide diversity (π)
                                                                         reflecting the fact that numerous haplotypes diverged from a
                                                                         single mutation from the majority haplotype. The nucleotide
Genetic diversity indices                                                diversity is higher for the datasets including all haplotypes
                                                                         and for the long fragments whatever the haplogroup.
Genetic diversity indices were calculated for the short
(241 bp) and long (683 bp) fragments as well as for the three            Demographic analysis
haplogroups (Table 1). In all cases, the dataset included
our samples (221 in total) combined to the 87 haplotypes                 The demographic analysis was performed on the haplogroup
described by Nishizawa et al. (2014) and Shamblin et al.                 II constituted 207 sequences of the long fragment. The com-
(2014).                                                                  parison of the two molecular clocks tested identified the

Table 1  Genetic diversity          Sequences analysed                       N          n         Hd          S         p            π
indices for short (241 bp) and
long (683 bp) sequences in          Total haplotypes (short sequences)       253        32        0.42        30        30           0.0091
different haplogroups including
                                    Total haplotypes (long sequences)        258        87        0.70        89        73           0.0151
our samples combined to
all haplotypes referenced by        Haplogroup IB (short sequences)          21         14        0.87        15        15           0.0078
Nishizawa et al. (2014) and         Haplogroup IB (long sequences)           39         31        0.98        30        28           0.0060
Shamblin et al. (2014)              Haplogroup II (short sequences)          232        18        0.32        17        17           0.0015
                                    Haplogroup II (long sequences)           207        44        0.54        39        34           0.0012
                                    Haplogroup IA (long sequence)            12         12        1.00        14        14           0.0075

                                    N Total sample size; n Number of haplotypes; Hd Haplotype diversity; S Number of variable sites; p Num-
                                    ber of segregation (polymorphic) sites; π Nucleotide diversity

                                                                                                                               13
52 Page 8 of 15 Marine Biology (2021) 168:52
strict clock as the best model over the uncorrelated relaxed coastlines mainly come from the Mediterranean (~ 89%) and
clock (AICM = 8.55). The Bayesian Skyline Plot (Fig. 5) to a lesser extent from Atlantic (~ 11%) rookeries (Fig. 6).
indicated a strong population expansion (increase of Ne) Overall, the majority of the contribution comes from the
starting at about 130 kyrs [95% HPD: 90–180]. eastern Mediterranean Sea: Greece (39.9%), Crete (12.3%),
Western Turkey (12.3%), Dalyan rookeries in Turkey (5,8%),
Mixed Stock Analysis Lebanon and Israel (4,9%) and Calabria rookeries in Italy
(3.1%). The contribution of the Atlantic Ocean is repre-
The Mixed Stock Analysis (MSA) was performed on our 170 sented essentially by rookeries from Florida (8.8% among
sequences (30 adults, 132 juveniles and 8 unknown) of the which Dry Tortugas with 4% and Canaveral National Sea-
long control region fragment. The analysis highlighted that shore + Melbourne Beach with 3.2% are the most important).
loggerhead turtles found along the French Mediterranean Finally, the contribution of other rookeries is negligible (less
Fig. 5 Bayesian Skyline Plot
obtained with Beast on haplo-
group II (207 long sequences)
showing an expansion phase
starting at about 130 kyrs. X-
and Y-axes represent the time
(T in Myrs) and the effective
population size (Ne in logarithm
scale), respectively. The three
lines represent the median
estimate (dark blue) and the
95% highest posterior density
(light blue)
Fig. 6 Mixed Stock Analysis performed on 170 sequences of the Florida), FLO3 (St. George Island + Cape San Blas, Florida), BRA
long control region fragment. Estimated contributions and 95% (Sergipe + Bahia + Espírito Santo + Rio de Janeiro, Brazil), CAP (Boa
confidence intervals of 23 loggerhead rookeries from the Atlan- Vista + Sal + Santa Luzia + Maio, Cape Verde), CAL (Calabria, Italy),
tic Ocean and the Mediterranean Sea to the loggerhead turtles from GRE (Zakynthos Island + Kyparissia + Lakonikos, Greece), CRT
the French Mediterranean coastline. Nesting areas: GEO (Cape (Rethymno, Crete), DLY (Dalyan, Turkey), DAL (Dalaman, Turkey),
Island, South Carolina + Ossabaw Island, Georgia), FLO1 (Canav- TKW (western Turkey), TME (middle Turkey + eastern Turkey), CYP
eral National Seashore + Melbourne Beach, Florida), FLO2 (Juno (Alagadi + Akamas, Cyprus), LIR (El Mansouri, Lebanon + Israel),
Beach + Ft. Lauderdale, Florida), CSL (Cay Sal, Bahamas), DRT LYB (Sirte + Misurata, Lybia), NAT (Tongaland, KwaZulu-Natal,
(Dry Tortugas, Florida), MEX (Isla Cozumel + Quintana Roo main- South Africa), MAS (Masirah, Oman)
land, Mexico), KEY (Keewaydin Island, Florida), CSK (Casey Key,
13Marine Biology (2021) 168:52 Page 9 of 15 52
than 5% such as Tongaland in South Africa with 3.4%) or equilibrium (pHWE < 0.05, Online Resource 3): Cc-25,
undetected (such as for Cape Verde or Brazil). MSA per- Cc1B03, Cc7C04, Cc7E11, and Cc5H07.
formed only on the 132 juveniles (data not shown) have A hierarchical analysis was conducted with STRUCTU
pointed out a major contribution from the Mediterranean RE at several scales. A first analysis was run on the 81 indi-
Sea, especially from Greece (36.2%), Western Turkey viduals genotyped using a K variable value ranging from
(13.6%), Crete (11.6%) and Lebanon and Israel rookeries 1 to 10. The maximum likelihood and the delta (K) curve
(8.2%). The contribution of the Atlantic Ocean is 8.5% with obtained with Evanno’s method returned a maximum value
a majority from Dry Tortugas in Florida (3.1%) followed by of 2 clusters (Fig. 7a). This analysis mainly individualizes
Canaveral National Seashore and Melbourne Beach rooker- the nine individuals from the two spawning nests of Ville-
ies in Florida (2.6%). The results obtained only on the 30 neuve-lès-M. and St-Aygulf (8 and 9 in Fig. 7b). The remain-
adults (data not shown) highlighted Greece (55.8%), Crete ing 67 individuals of the haplogroup II (2 to 7 in Fig. 7b)
(18.1%) and Western Turkey (3.9%) rookeries as major con- appeared genetically mixed. To avoid a possible influence
tributors to French feeding grounds whereas the Atlantic of sibling relatives, a second analysis was run with only one
Ocean contributed for less than 6% with a majority from the individual from each nest (74 individuals analysed). In this
Bahamas followed by Florida rookeries. case, even if the delta (K) curve returned a maximum value
of 2 clusters, the maximum likelihood is obtained for K = 1
and the barplot showed no population structure (Online
Genetic diversity and structure based Resource 4a). Moreover, as evidenced in Fig. 7b, there is
on microsatellites no apparent difference between male and female (groups
3 and 4 for females versus groups 5 and 6 for males). We
A subsample of 81 individuals from the French Mediter- also performed STRUCTURE analyses in differentiating
ranean Coast was tested for population structure using 13 juveniles (59 individuals with only one sample per nesting
microsatellite loci. The sampling included individuals from site; Online Resource 4b) and adults (15 individuals; Online
the control region haplogroups IB and II (5 and 76 indi- Resource 4c). In both analyses, two clusters are identified
viduals, respectively). Moreover, all control region haplo- with the delta (K) curve but the barplots (data not shown)
types evidenced (Fig. 4) as well as a maximum of localities did not reveal any structuring among individuals. Another
(23 out of 43; Online Resource 1) were represented. The STRUCTURE analysis that was run with only eleven loci
13 microsatellites loci were polymorphic for the 81 sam- (i.e. without Cc-25 and Cc7C04 because of their high level
ples analysed with a number of alleles ranging from 4 to of missing data) gave the same results.
16 which leads to an average number of alleles per locus A PCA was carried out on the 81 individuals genotyped
of 11.77. Analysis with the software MICRO-CHECKER for the 13 loci that have been split into four groups: the
indicated the possible presence of null alleles for three loci five samples from the haplogroup IB, the five individuals
(Cc7C04, Cc-25 and Cc1B03) but the two last loci have an from the nesting event in Villeneuve-lès-M., the four sam-
important ratio of missing data (see Online Resource 3). ples from the nesting event in St-Aygulf and the remaining
Observed and expected heterozygosity values (Ho and He, samples of the haplogroup II. The three first axes explained
Online Resource 3) calculated for each locus ranged from 17% of the variance. The first axis separates groups 2 and 3
0.56 to 0.92 and from 0.67 to 0.90, respectively. Five loci whereas the second axis dissociates clusters 2 and 4. Finally,
showed a significant deviation from the Hardy–Weinberg the third axis brings out groups 3 and 4 (Online Resource 5).
Fig. 7 Genetic assignation of Caretta caretta (N = 81) using STRU 3: females smaller than 60 cm CCLmin; 4: females measuring at
CTURE. a curves of the likelihood Ln(K) and their standard devia- least 60 cm CCLmin; 5: males smaller than 60 cm CCLmin; 6: males
tion (in blue) and the delta K calculated by the Evanno’s method (in measuring at least 60 cm CCLmin; 7: adults with an unknown size;
salmon) as a function of K (number of clusters); b barplot showing 8: samples from the nesting event in St-Aygulf; 9: Samples from the
the structure of the 81 samples of C. caretta for K = 2. 1: individuals nesting event in Villeneuve-lès-M
with an unknown size belonging to the haplogroup IB; 2: juveniles;
1352 Page 10 of 15 Marine Biology (2021) 168:52
Discussion (Indian Ocean). This distribution suggests that all these
populations shared once the same distribution area (likely
This study was intended to characterise the population a refugium) from which rapid colonization of the North
structure and composition of a new large sampling of log- Atlantic and the Mediterranean Sea was accompanied by
gerhead turtles from stranding and bycatch events reported a reduction of the genetic diversity found in the ancestral
from the Gulf of Lion, Provence and Corsica (French Med- populations (Bowen et al. 1994; Bolten et al. 1998). In
iterranean façade). In this respect, our sampling furnished the Mediterranean Sea, the majority haplotype CC-A2.1
supplementary data that are complementary to the study was most likely one of them, thus explaining the genetic
of Laurent et al. (1993), Carreras et al. (2007), Clusa et al. structure and the low diversity observed. Moreover, the
(2013), Garofalo et al. (2013), Splendiani et al. (2017) and star-like shape of the network as well as the BSP analysis
Tolve et al. (2018) which concerned other areas of the indicate a strong population expansion for the haplogroup
Mediterranean Sea. II, a result in agreement with previous studies (Clusa et al.
2013; Reid et al. 2019). According to our BSP analysis,
the beginning of the expansion phase is dated at about
Mitochondrial versus nuclear diversity 130 kyrs [95% HPD: 90–180] that is during the intergla-
cial Riss-Würm. This molecular estimation is older than
The mitochondrial analysis highlighted that loggerhead the 65 kyrs (20–200 kyrs) obtained by Clusa et al. (2013)
turtles frequenting the French coasts of the Western Medi- although both studies agree on the fact that C. caretta col-
terranean Sea belong to two of the three major lineages onised the Mediterranean basin during the upper Pleisto-
currently described in this species. Haplogroups IB and cene (12–130 kyrs), that is well before the Last Glacial
II include animals from Atlantic and Mediterranean areas Maximum (LGM, 18–20 kyrs). These results markedly
(Shamblin et al. 2014) whereas haplogroup IA represents contrast with the recent study of Reid et al. (2019) which
turtles from the Pacific Ocean (Nishizawa et al. 2014). dated the expansion at about 11–12 Kyrs (5–50 kyrs), that
The haplogroup II is more widely represented in the Medi- is after the LGM. Such a discrepancy can be explained by
terranean Sea and 95.9% of our specimens are included the different dating methods or more surely by the discord-
in this group. Among the 12 haplotypes evidenced for ant rates of mutation that have been used in the three stud-
the long fragment of the mitochondrial control region, ies. Moreover, the difficulty to estimate molecular rates of
CC-A2.1 characterizes 86% of the individuals and is evolution has become more complicated since the recent
widely distributed all along the French coasts of the Gulf study of Tikochinski et al. (2020) which revealed extensive
of Lion, Provence and Corsica. A predominant CC-A2.1 heteroplasmy of the mitochondrial control region for Che-
is also observed in western (Spain, Baleares; Carreras lonia mydas. As heteroplasmy increases the rate of change
et al. 2006), central (Italy, Malta; Garofalo et al. 2013) as in genetic diversity, estimations of mutation rates and thus
well as eastern (Greece, Crete, Turkey, Cyprus, Lebanon, of divergence times might have been overestimated. In
Israel; Carreras et al. 2007) Mediterranean basins. For conclusion, if the expansion of the Mediterranean line-
the haplogroup II, five haplotypes specific to the Medi- ages of C. caretta seems to be confirmed, the timing of this
terranean (CC-A2.8, CC-A2.9, CC-A6.1, CC-A31.1 and expansion (post-LGM or more ancient) is still a matter of
CC-A32.1) and four haplotypes common to Atlantic and debate pending accurate estimations of the mutation rate.
Mediterranean basins (CC-A2.1, CC-A3.1, CC-A10.4 and By contrast with the strong genetic structure observed
CC-20.1; Online Resource 2) were evidenced along the with the mtDNA, analyses of nuclear DNA (13 microsatel-
French Mediterranean façade. Haplogroup IB that mainly lite loci) revealed little population structure among the 81
represents animals from the Atlantic (Shamblin et al. genotyped individuals. Indeed, the nuclear differentiation
2014) is represented in our sampling by only three haplo- between the two mitochondrial haplogroups IB and II does
types including seven turtles (Fig. 3). not appear clearly in the STRUCTURE analysis, a result
Whatever the size of the control region analysed that is supported by their important overlapping in the PCA
(241 bp and 683 bp) lower haplotype and nucleotide diver- (groups 1 and 2 in Online Resource 5). From the micro-
sities are observed in the haplogroup II (Mediterranean satellite analysis, the main structure observed concerns
and the Atlantic Ocean) as compared to the haplogroup IB the differentiation of the embryos (see Fig. 7 and Online
(Atlantic Ocean). This result is due to the presence of hap- Resource 5) coming from the two nests at the beaches of
lotype CC-A2.1 in the haplogroup II characterizing 86% Villeneuve-lès-M. (Gulf of Lion) and St-Aygulf (Provence).
of our samples. This haplotype is found in high frequency, If the PCA confirmed this distinction (see groups 3 and 4 in
not only in the Mediterranean Sea and Northern Atlantic Online Resource 5), this analysis also clearly indicated that
Ocean (including Cape Verde) but also in South Africa both nesting sites are genetically different, not only with
respect to individuals belonging to haplogroups IB and II
13Marine Biology (2021) 168:52 Page 11 of 15 52
but also between them. Although Atlantic and Mediter- lesser proportion than the 20% recognized in the Catalano-
ranean individuals are sharing the same foraging grounds Balearic and Tyrrhenian Seas (Clusa et al. 2014).
along the French coasts, our results revealed a lower popula- About 90% of the loggerhead turtles frequenting the
tion genetic structure in nDNA assays relative to mtDNA, French Mediterranean coast are likely originating from the
thus indicating a significant gene flow between individu- Mediterranean Sea. Major contributions would be from
als over generations. Previous studies (Bowen et al. 2005, Greece (36% and 56% for adults and juveniles, respectively),
Monzón-Arguëllo et al. 2010, Garofalo et al. 2013) on the Crete (12% and 18%) and Western Turkey (14% and 4%).
genetic structure of C. caretta came to a similar scenario: Either for adults or juveniles, major contributors are the big-
the mitochondrial marker brought out a deep structuration gest colonies from the north-eastern Mediterranean, such
resulting from the colonization of the Mediterranean Sea as Greece or Turkey. The Calabria rookeries in Italy, the
whereas microsatellite analysis did not reveal any structura- closest in the geographic distance to the French Mediterra-
tion in their sampling, even between colonies differentiated nean façade contributed only 3.1%. The absence of Calabria
by maternal markers. This result is often interpreted as a contribution to the Adriatic turtle composition was attrib-
sex-biased gene flow resulting from opportunistic mating uted to the small size of the Calabrian rookery combined
by males during their migration phase inversely to females with opposite marine currents preventing migration in the
that are more philopatric or faithful to successive breeding Adriatic Sea (Tolve et al. 2018). Because of the existence
beaches. Such a hypothesis was, however, recently chal- of favourable coastal currents (see below), only the first
lenged by the study of Clusa et al. (2018) suggesting that argument could explain the absence of Calabrian turtles on
both females and males would exhibit philopatric behaviour. the French Mediterranean coasts. We also did not evidence
Moreover, according to our MSA analysis (see next para- input from Libya (Misrata and Sirte rookeries), while these
graph) our sampling is mostly issuing from Greece, Crete rookeries contributed to juveniles observed in the Catalano-
and Western Turkey which have been shown to belong to Balearic, Tyrrhenian and northern Ionian basins (37%, 47%
the same genetic cluster (Clusa et al. 2018). It is therefore and 70%, respectively; Clusa et al. 2014). Finally, as previ-
not surprising not to identify any genetic structuring among ously observed (Monzón-Arguello et al. 2010, Clusa et al.
our samples. It is clear however that a better understanding 2014), we did not identify contribution of the Cape Verde
of the respective role of males and females in population rookery in individuals frequenting the French Mediterranean
delineation will benefit from using more powerful molecu- shoreline.
lar markers, such as SNPs, issuing from high-throughput The French Mediterranean façade is monitored during
sequencing (Komoroske et al. 2017) as well as additional the Marine Megafauna Aerial Survey (SAMM) campaigns
samples from at least the main spawning beaches in both (Pettex et al. 2014), and sea turtles larger than 20–30 cm
Atlantic and Mediterranean basins. can be detected in the first 2–3 m below the water surface.
The SAMM campaigns have confirmed the presence of sea
Origin of loggerhead turtles from the Gulf of Lion, turtles with important concentrations, especially juveniles,
Provence and Corsica along all the French Mediterranean coasts (e.g. on the east-
ern coast of Corsica and at the Rhône delta, Darmon et al.
According to the MSA analysis, less than 10% of loggerhead 2017). Loggerhead turtles off the French shorelines are
turtles (6% for adults and 8.5% for juveniles) frequenting likely carried from eastern to the western Mediterranean
the French Mediterranean coast originated from the Atlantic by sea-surface currents (such as the Liguro-Provencal cur-
Ocean. These individuals have been assigned mostly to Flor- rent, review in Mansui et al. 2020), as previously proposed
ida and Bahamas rookeries. If the MSA analysis estimated for juveniles in the western Mediterranean basin with both
that 6% of adults would have an Atlantic origin, it can be genetic (Carreras et al. 2006; Clusa et al. 2014; Cardona and
noted that no adult is characterized by a pure Atlantic hap- Hays 2018) and direct (marking and telemetry; Casale et al.
lotype (such as CC-A1) whereas three juveniles carried two 2007; Revelles et al. 2007, Zbinden et al. 2008, Schofield
haplotypes (CC-A1.1 and CC-A1.3; Fig. 4) that are charac- et al. 2010) data. The presence of juveniles identified as
teristic of Atlantic rookeries. These results suggest that only originated from Greece, Crete, Turkey, Lebanon and Israel is
a few adults as well as juveniles issuing from Atlantic are in agreement with the global water circulation at the Medi-
frequenting the Gulf of Lion, Provence and Corsica areas. terranean scale (Mansui et al. 2020). However, increasing
Indeed, the study by Clusa et al. (2014) indicated that the the data on the origin of individuals (genetic and direct
majority of juvenile loggerhead turtles from the Atlantic are observations by marked individuals) and on water circula-
confined to the Algerian basin (about 60%) and to a lesser tions at small scales will allow a better understanding of
degree (between 5 and 20%) in other Mediterranean basins. the complex course of juvenile loggerhead turtles originated
If the proportion of Atlantic turtles identified in the French from and outside Mediterranean waters. Moreover, even if
Mediterranean façade falls in these estimations, this is a the mtDNA database has clearly been improved with respect
1352 Page 12 of 15 Marine Biology (2021) 168:52
of haplotype recording from Mediterranean rookeries, MSA genetic proximity of eastern Mediterranean rookeries. In this
resolution is limited by the high frequency and ubiquity of context, the Gulf of Lion-Provence-Corsica and more gener-
haplotype CC-A2.1. Here again, new types of molecular ally the western Mediterranean Sea was not considered as
markers might help reaching a more powerful identifica- a possible MU. However, the frequentation of the western
tion of turtle’s origin in the future (Komoroske et al. 2017; basin by high densities of juveniles and the recent nesting in
Hamabata et al. 2020). French, Italian and Spanish coasts increase the importance
Sporadic nests occurred on the French Mediterranean of this region for the conservation of Mediterranean log-
coasts and samples were collected at the two most recent gerhead turtle populations.
nesting sites in Provence (St-Aygulf in 2016) and Gulf The Gulf of Lion is considered as an important feed-
of Lion (Villeneuve-lès-M. in 2018). Such sporadic nest- ing area, notably for juvenile turtles in the migration phase
ing observed in other parts of the western Mediterranean (Garofalo et al. 2013). Juveniles represent about 85% of
(Spain and Italy) are characterized by haplotypes found both turtles frequenting the French Mediterranean coasts, and
in Atlantic and Mediterranean rookeries, thus suggesting they are facing classical threats, such as bycatch (mainly by
independent and long-distance colonization of the western trawling in winter and gill-netting in summer and maritime
Mediterranean (Carreras et al. 2018). Unfortunately, only traffic, Sacchi et al. 2020). Many juveniles are concentrated
the majority haplotype (CC-A2.1) has been identified among in front of the Rhône delta (Pettex et al. 2014), the main
the 9 sequences obtained for the control region from these Mediterranean river in term of nutritive input (Raimbault
two nesting events in France. As this haplotype is found in et al. 2009). These turtles likely follow the main east–west
nearly all rookeries, the possible origin of turtles is multiple: current (Northern Current; Mansui et al. 2020) and thus
from Atlantic (Florida and Bahamas) to multiple rookeries cross the sanctuary Pelagos, a large marine protected area
from the Mediterranean (e.g. Greece, Turkey, Italy) or even (MPA) which covers 87 000 km2 between northern Sardinia,
from Cape Verde or South Africa. By contrast, the micro- Provencal coasts and north-western coasts of Italy. There
satellite analysis indicated that individuals from nests are is no MPA directly in front of the Rhône River delta, the
clearly differentiated from other turtles analysed (Fig. 7 and closest being the Parc Marin de la Côte Bleue or the Parc
Online Resource 5). This could argue for an origin from National des Calanques respectively located about 20 and
rookeries not represented in our sampling (such as Libya) or 46 km (10.8 and 24.8 mi) west of the delta. However, the
outside the Mediterranean Sea (e.g. diverse Atlantic places), impact of anthropogenic activities on juvenile survival is
but testing this hypothesis will necessitate including more lacking in and outside these protected areas. In the Medi-
representatives of turtles outside the Mediterranean Sea. In terranean, 7.14% are covered by MPAs or other effective
the future, it will be thus interesting to pursue the analysis conservation measures but only 0.04% corresponds to strong
of egg-laying sites occurring on the French shoreline to bet- protection zones (fishing limitation, traffic reduction, etc.;
ter assess the origin of these new colonizers, a data that MedPAN 2016). As in other parts of the Mediterranean Sea,
will have some importance for the definition of management bycatch in fishing gear is the main anthropogenic threat at
units (Shamblin et al. 2014). sea for loggerhead turtles, and “the intensity of conservation
initiatives aimed at mitigating this threat is very low” (p.
Conservation issues 256, review in Casale et al. 2018).
Occasional nesting sites are found in the western Medi-
On the basis of diverse information, such as geographic dis- terranean basin, in Spain and Italy (Carreras et al. 2018),
tribution, monitoring localisation, number and localisation particularly in the South Tyrrhenian coasts where nests are
of nesting sites, genetic structure inferred from mitochon- regularly observed since 2012 (Maffucci et al. 2016). On the
drial (control region sequences) and nuclear (microsatellites) Gulf of Lion and Provence shoreline, three sporadic nest-
DNA, foraging areas, Wallace et al. (2010) defined several ing sites have been observed since 2006 in sandy beaches
Regional Management Units (RMUs) at the worldwide scale (localities k, af and ag in Fig. 1) which are the northern-
for C. caretta. The Mediterranean Sea represents one sepa- most latitudes observed for loggerhead turtle nests in the
rated RMU although, it is clear that the Mediterranean is Mediterranean Sea (Senegas et al. 2009). In Corsica, east-
also frequented by individuals from two other independent ern beaches that present favourable nesting environments
RMUs: the northwest Atlantic and the northeast Atlantic were regularly frequented until the 1940s and are again used
(Monzón-Argüello et al. 2010, Wallace et al. 2010). In the since 2014 (Delaugerre and Cesarini 2004; Gérigny et al.
Mediterranean RMU, Shamblin et al. (2014) recognized 2020). A combination of factors could explain these recent
seven Management Units: Calabria (Italy), western Greece, nesting events, such as the increase of sea level and tem-
Crete, western Turkey, eastern Turkey, eastern Mediterra- perature associated to decades of protection and conserva-
nean and Tunisia/Libya. These MUs were defined on the tion measures especially in eastern Mediterranean rookeries
basis of haplotype distinctiveness (private haplotype) and (Casale et al. 2018) which would contribute to produce new
13Marine Biology (2021) 168:52 Page 13 of 15 52
colonizers. A process of colonisation would be underway French metropolitan coasts (NOR: DEVL1500415N) for the mainland
from distant eastern nesting beaches (e.g. from Greece as sea turtle observatory program of the National Museum of Natural
History (MNHN).
deduced from the presence of the haplotype CC-A32.1) but
also from long-distance dispersal across oceans (Carreras Consent to participate All authors made substantial contributions to
et al. 2018, this study). Thus, the conservation challenges the paper and agree with the contents of the manuscript.
for these western Mediterranean nesting sites are the highly
Consent for publication All authors approved the version to be pub-
artificialized coasts and strong human frequentation (and lished and its submission to Marine Biology.
thus disturbance) on the remaining sandy beaches. As in
many rookeries, egg viability and post-hatching survival
from sporadic nests remain unknown but protection meas-
ures have already been implemented. Current actions con- References
ducted thanks to Non-Governmental Organisations (such
as the French Mediterranean stranding network and rescue Abreu-Grobois FA, Horrocks J, Formia A, et al. (2006) New mtDNA
centres) are the surveillance of nesting events, physical D-loop primers which work for a variety of marine turtle species
may increase the resolution of mixed stock analysis. In: Frick,
protection (barriers) of nests, tissue sampling for acquiring
M., Panagopoulou, A., Rees, A.F. and Williams, K. Book of
more knowledge on the origin of nesting turtles, and public Abstracts. Twenty Sixth Annual Symposium on Sea Turtle Biol-
awareness on the presence of these marine organism along ogy and Conservation. International Sea Turtle Society, Athens,
the coasts. Greece. 376 pp.
Bandelt HJ, Forster P, Rohl A (1999) Median-joining networks for
inferring intraspecific phylogenies. Mol Biol Evol 16:37–48
Supplementary Information The online version of this article (https://
Bass AL, Epperly SP, Braun-McNeill J (2004) Multi-year analysis of
doi.org/10.1007/s00227-021-03855-6) contains supplementary mate-
stock composition of a loggerhead turtle (Caretta caretta) foraging
rial, which is available to authorized users.
habitat using maximum likelihood and Bayesian methods. Con-
serv Genet 5:783–796
Acknowledgements This article is dedicated to Mr. Jean Lescure, Bolker B (2012) mixstock: functions for mixed stock analysis. R pack-
former researcher at the MNHN and president of the French Herpeto- age version 0.9.5.1. URL: https://cran.r-project.org/src/contr ib/
logical Society (SHF), for his pioneering action for a better knowledge Archive/mixstock/.
of marine turtles in the Mediterranean Sea. We warmly thank all the Bolten AB, Bjorndal KA, Martins HR et al (1998) Transatlantic devel-
people that made this study possible in collecting sea turtles along the opmental migrations of loggerhead sea turtles demonstrated by
French Mediterranean coasts: the volunteers of the French Mediter- mtDNA sequence analysis. Ecol Appl 8:1–7
ranean Stranding Network for Sea Turtles (Réseau Tortues Marines de Bolten AB, Witherington BE (2003) Loggerghead Sea Turtles. Smith-
Méditerranée Française, a committee of the SHF), especially the former sonian Books, Washington, DC
responsible of this committee Guy Olivier, Sidonie Catteau, Gaëlle Bowen BW, Bass AL, Soares L, Toonen RJ (2005) Conservation impli-
Darmon and Dr Jean-Marie Péricard; the staff and volunteers of the cations of complex population structure: lessons from the logger-
CESTMED rescue center (Centre d’Etude et de Sauvegarde des Tor- head turtle (Caretta caretta). Mol Ecol 14:2389–2402
tues Marines de Méditerranée); the veterinarian of the Departmental Bowen BW, Kamezaki N, Limpus CJ et al (1994) Global phylogeog-
Analysis Laboratory of Gard (Laboratoire Départemental d’Analyses raphy of the loggerhead turtle (Caretta Caretta) as indicated by
du Gard), Dr Joanne Béfort and the fishermen involved in recovering mitochondrial-DNA haplotypes. Evolution 48:1820–1828
sea turtles from bycatch. Bowen BW, Karl SA (2007) Population genetics and phylogeography
of sea turtles. Mol Ecol 16:4886–4907
Funding Parts of this work have been funded by a Grant (N#05/06/2014) Broderick AC, Glen F, Godley BJ, Hays GC (2002) Estimating the
from the TOTAL foundation and thank to the agreement between the number of green and loggerhead turtles nesting annually in the
French Herpetological Society (SHF), the French Biodiversity Agency Mediterranean. Oryx 36:227–235
(AFB) and the Ecole Pratique des Hautes Etudes (EPHE), aiming at Cardona L, Hays GC (2018) Ocean currents, individual movements and
increasing knowledge on sea turtles along the French marine facades. genetic structuring of populations. Mar Biol 165:10
Anaïs Loisier and Marie-Paule Savelli’s Master grants have been Carreras C, Pascual M, Cardona L et al (2007) The genetic structure of
funded by EPHE. the loggerhead sea turtle (Caretta caretta) in the Mediterranean as
revealed by nuclear and mitochondrial DNA and its conservation
Availability of data and material Our manuscript has data included as implications. Conserv Genet 8:761–775
electronic supplementary material. Carreras C, Pascual M, Tomas J et al (2018) Sporadic nesting reveals
long distance colonisation in the philopatric loggerhead sea turtle
(Caretta caretta). Sci Rep 8:1435
Declarations Carreras C, Pont S, Maffucci F et al (2006) Genetic structuring of
immature loggerhead sea turtles (Caretta caretta) in the Medi-
Conflict of interest All authors declare no conflict of interest. terranean Sea reflects water circulation patterns. Mar Biol
149:1269–1279
Ethics approval Loggerhead turtles are strictly protected in France Casale P, Broderick AC, Caminas JA et al (2018) Mediterranean sea
(national decree of October 14, 2005) and the sample collection was turtles: current knowledge and priorities for conservation and
allowed by the decree of December 31, 2012 on the renewal of the research. Endanger Species Res 36:229–267
environmental protection approval of the Société Herpétologique de Casale P, Freggi D, Basso R, Vallini C, Argano R (2007) A model of
France (SHF), and the decree of October 24, 2016 on the collection area fidelity, nomadism, and distribution patterns of loggerhead
of biological data in the event of sea turtle stranding or bycatch on
13You can also read