TRIPDECODER: Study Travel Time Attributes and Route Preferences of Metro Systems from Smart Card Data - arXiv
←
→
Page content transcription
If your browser does not render page correctly, please read the page content below
TRIPDECODER: Study Travel Time Attributes and Route
                                                 Preferences of Metro Systems from Smart Card Data
arXiv:2005.01492v1 [physics.soc-ph] 1 May 2020

                                                 XIANCAI TIAN, BAIHUA ZHENG, and YAZHE WANG, Living Analytics Research Centre, Singapore
                                                 Management University, Singapore
                                                 HSIAO-TING HUANG, Department of Electrical Engineering, National Cheng Kung University, Taiwan
                                                 CHIH-CHIEH HUNG∗ , Department of Computer Science and Information EngineeringIn, Tamkang
                                                 University, Taiwan
                                                 In this paper, we target at recovering the exact routes taken by commuters inside a metro system that are
                                                 not captured by an Automated Fare Collection (AFC) system and hence remain unknown. We strategically
                                                 propose two inference tasks to handle the recovering, one to infer the travel time of each travel link that
                                                 contributes to the total duration of any trip inside a metro network and the other to infer the route preferences
                                                 based on historical trip records and the travel time of each travel link inferred in the previous inference
                                                 task. As these two inference tasks have interrelationship, most of existing works perform these two tasks
                                                 simultaneously. However, our solution TripDecoder adopts a totally different approach. To the best of our
                                                 knowledge, TripDecoder is the first model that points out and fully utilizes the fact that there are some trips
                                                 inside a metro system with only one practical route available. It strategically decouples these two inference
                                                 tasks by only taking those trip records with only one practical route as the input for the first inference task
                                                 of travel time and feeding the inferred travel time to the second inference task as an additional input which
                                                 not only improves the accuracy but also effectively reduces the complexity of both inference tasks. Two
                                                 case studies have been performed based on the city-scale real trip records captured by the AFC systems in
                                                 Singapore and Taipei to compare the accuracy and efficiency of TripDecoder and its competitors. As expected,
                                                 TripDecoder has achieved the best accuracy in both datasets, and it also demonstrates its superior efficiency
                                                 and scalability.
                                                 CCS Concepts: • Information systems → Spatial-temporal systems; Data mining; • Mathematics of
                                                 computing → Maximum likelihood estimation.

                                                 Additional Key Words and Phrases: metro systems, smart card data, travel time inference, route choice
                                                 preference estimation, maximum likelihood estimation
                                                 ACM Reference Format:
                                                 Xiancai TIAN, Baihua ZHENG, Yazhe WANG, Hsiao-Ting HUANG, and Chih-Chieh HUNG. 2020. TRIPDE-
                                                 CODER: Study Travel Time Attributes and Route Preferences of Metro Systems from Smart Card Data. 1, 1
                                                 (May 2020), 20 pages. https://doi.org/10.1145/nnnnnnn.nnnnnnn
                                                 ∗ The   corresponding author.

                                                 Authors’ addresses: Xiancai TIAN, shawntian@smu.edu.sg; Baihua ZHENG, bhzheng@smu.edu.sg; Yazhe WANG,
                                                 yzwang@smu.edu.sg, Living Analytics Research Centre, Singapore Management University, Singapore; Hsiao-Ting HUANG,
                                                 q36064248@gs.ncku.edu.tw, Department of Electrical Engineering, National Cheng Kung University, Taiwan; Chih-Chieh
                                                 HUNG, smalloshin@gms.tku.edu.tw, Department of Computer Science and Information EngineeringIn, Tamkang University,
                                                 Taiwan.

                                                 Permission to make digital or hard copies of all or part of this work for personal or classroom use is granted without fee
                                                 provided that copies are not made or distributed for profit or commercial advantage and that copies bear this notice and
                                                 the full citation on the first page. Copyrights for components of this work owned by others than ACM must be honored.
                                                 Abstracting with credit is permitted. To copy otherwise, or republish, to post on servers or to redistribute to lists, requires
                                                 prior specific permission and/or a fee. Request permissions from permissions@acm.org.
                                                 © 2020 Association for Computing Machinery.
                                                 XXXX-XXXX/2020/5-ART $15.00
                                                 https://doi.org/10.1145/nnnnnnn.nnnnnnn

                                                                                                                          , Vol. 1, No. 1, Article . Publication date: May 2020.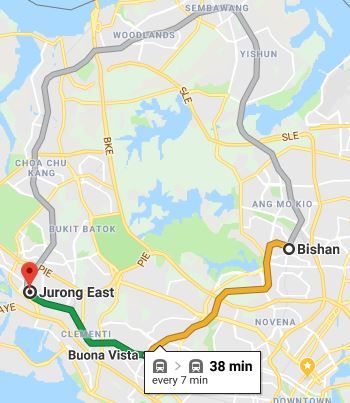
2                               Xiancai TIAN, Baihua ZHENG, Yazhe WANG, Hsiao-Ting HUANG, and Chih-Chieh HUNG

1      INTRODUCTION
For land-scarce and metro-rely countries like Singapore, it is extremely important to improve the
public transport systems in order to meet the increasing travel demands of a growing economy
and population. Mass Rapid Transit (MRT) system is a critical part of the public transport system
because of its advantages in both capacity and efficiency1 . In order to increase the MRT ridership
and encourage more commuters to take MRT, it is critical to improve the MRT services which has
attracted attention from the academy.
   For instance, predicting vehicle crowdedness and platform commuter intensity can help operators
evaluate service quality and design structural improvements for the metro network [8, 9, 17];
understanding commuters’ route choice preferences and route travel time allows operators to
provide more accurate route recommendation [3, 5]; studying commuters’ movement during MRT
disruption enables operators to identify potentially overcrowded stations and to take more targeted
remedial actions like arranging alternative transportation modes [11, 16, 20].
   Studies on commuters’ behaviour inside public transport systems have long been relying on
external data source like field surveys [1, 5, 10, 11] and crowdsourcing [17]. However, these data
sources have their own limitations. Take survey data as an example. It is easily subject to bias
and errors, and conducting surveys and processing the data can be both time-consuming and
labor-intensive. In addition, since most surveys are conducted with focus on particular location and
time, the results are often limited in scale and diversity. Data collected via crowdsourcing suffers
from similar issues. As a result, alternative data sources are required to be able to more accurately
and more comprehensively understand the spatial-temporal characteristics of travel patterns, such
as train control sensors [8, 9], and GPS data [3].
   In this paper, we aim at inferring the travel time required by any route inside the metro network,
and route preferences at both aggregation level and individual level, based on data collected from
automated fare collection (AFC) systems that have emerged and widely deployed over the last
decade. When the context is clear, we may use the term AFC data interchangeably with the term
smart card data, trip records or trip observations, and they all refer to some key information related
to trips (e.g., the time stamp and the MRT station/bus stop when a trip is started, and the time
stamp and the MRT station/bus stop when a trip is ended).
   As more and more public transportation systems are now using smart cards to collect trip fares,
it has generated massive precious data resource for public transport scientific study. However, the
smart card data has limitations. For example, because of the reliability requirement of a metro
network, redundant design is adopted to tolerate faults. Consequently, there could be multiple
routes available to bring a commuter from the boarding station to the alighting station. However,
as most metro networks are designed as closed systems and commuters only leave traces at board-
ing/alighting stations for the purpose of fare collection, the exact route taken by each individual
commuter remains unknown. On the other hand, the information of each commuter’s movement
inside the metro network is critical to the study of commuter behaviors at a microscopic level.
   As mentioned above, the main objective of this paper is to infer the travel time of any route,
and to infer the route preferences of commuters if there are multiple routes available to bring
the commuter from the boarding station to the alighting station. These two inference tasks have
interrelationship, and hence existing works on similar topics perform these two inference tasks
simultaneously, which significantly increases the complexity of the problem. We adopt a very
different approach. Our solution, TripDecoder, takes in a static metro network and its smart card
data as inputs. By carefully studying the data, TripDecoder points out a fact that some trips inside

1 In   this paper, the term MRT system is used interchangeably with metro system.

, Vol. 1, No. 1, Article . Publication date: May 2020.
TRIPDECODER: Study Travel Time Attributes and Route Preferences of Metro Systems from Smart Card Data               3

a metro system have only one practical route. It makes full use of this finding, and decouples the
two inference tasks into two separated steps.
   During the data pre-processing stage, a route candidate set is generated for each Origin-Destination
(OD) pair of stations, where unrealistic routes, such as routes that are extremely long with loops, are
removed. We then category OD pairs into two disjoint sets based on the number of available routes
linking them, i.e., OD pairs with a single route and OD pairs with multiple alternative routes. The
clever separation of OD pairs with single route from those with multiple routes actually motivates
the design of our first inference task. Accordingly, TripDecoder strategically decomposes the travel
time required by a trip into different travel links, and fully utilizes single-route OD pairs and their
corresponding trips (captured by the AFC system) to derive travel time of different travel links
that contribute to the travel time of any trip. Because TripDecoder only considers the trips of OD
pairs with single routes, there is no ambiguity in terms of the routes taken to complete the trips.
Therefore, we effectively remove the dependency of the route preference from the inferring of
travel time, and are able to produce more accurate estimation of the travel time of travel links.
The inferred travel time of different travel links are then used to construct travel time of routes
on multi-route OD pairs which becomes an additional and useful input for the inference of route
preferences. With route travel time known, the complexity of the inference of the route preferences
w.r.t. multiple routes has been effectively reduced.
   To illustrate and verify the proposed solution, we carry out case studies using real datasets,
i.e., the city scale real trip data captured by AFC systems in Singapore and Taipei. Our result
demonstrates the superior performance of TripDecoder, in terms of both accuracy and efficiency.
   The remainder of this paper is organized as follows. In Section 2, we review previous studies
on several related topics, including metro network travel time estimation, commuter route choice
behaviour, and the use of smart card data in understanding metro operation and flow assignment.
In Section 3, we present the preliminaries of TripDecoder, including the formulation of the problem
studied in this paper, the route choice set extraction, and data exploration insights. In Section 4, we
present the framework of TripDecoder and detail the two-step solution algorithm to recover the
route travel time and to learn the route preferences. In Section 5, we apply TripDecoder on real
trip data collected from Singapore and Taipei as two case studies and report the performance of
TripDecoder. We close the paper with conclusion and discussion of future research directions in
Section 6. Note that without the loss of generality, in the rest of paper we use Singapore metro
network and its smart card data collected during morning peak hours in 2015 December as an
example to explain how the proposed framework works.

2   LITERATURE REVIEW
Understanding the commuter flow in a transportation system is an important research topic. In
the existing literature, many of the works focus on studying commuter flow models based on
experience [6, 7, 12]. The models depend heavily on behavior assumptions and hence lack reliable
empirical data verification. Other studies are based on field surveys [1, 5, 10, 11], crowdsourcing [17],
train control sensors [8, 9], and GPS data [3]. These datasets are usually expensive to obtain, small
in scale, and poor in accuracy, therefore would greatly affect the analytic power of the applications
built based on them.
   In recent years, smart card data have provided us with new opportunities to perform data-centric
transit behavior study. [4] develops a heuristic method to assign commuter flows inside a metro
network based on AFC data. The main idea is to use train timetable to estimate the pure travel
time of every trip record, and then to cluster the trips based on the pure travel time between an
OD pair, with the assumption that each trip cluster corresponds to a candidate route connecting
the OD pair. The method is very efficient but it requires additional information of real-time train

                                                                , Vol. 1, No. 1, Article . Publication date: May 2020.
4 Xiancai TIAN, Baihua ZHENG, Yazhe WANG, Hsiao-Ting HUANG, and Chih-Chieh HUNG timetable, which is not always available. It also has accuracy issue due to the many assumptions made such as train services strictly follow the timetable, and commuters never fail to board on the immediate train after entering the stations. [13] studies the latent relationships among OD pairs, candidate routes and commuter travel time, and obtains the distribution of commuter flow on different candidate routes by a Latent Dirichlet Allocation (LDA) model. However, their model is not able to capture the travel time distribution on different routes, and thus could not infer local commuter flow of individual station/link segment of the metro network. To fully exploit the AFC data and predict the local commuter flow of individual link/station and commuters’ route preferences at the same time, many recent researches rely on statistical modelling based inferences [2, 14, 15, 19]. These models take commuter travel time as observations and characterize them as a mixture distribution from all potential routes. [14, 15] propose to construct posterior probability by combining the likelihood of observed commuter travel times provided by AFC data and prior knowledge about the studied transportation network. They assume the link travel time of the transit network follows the normal distribution, and the commuters’ route choice probability could be represented by a logit model of various influential factors (i.e., in-vehicle travel time, transfer time). Thereafter, they perform Bayesian inference to calibrate the parameters (i.e., mean/variance of link travel time and coefficient of influence factors of the route choice probability) of the model. [19] builds a similar posterior probability model as [14, 15], where they cnosider not only in-vehicle travel time and transfer time factors, but also crowdedness factor for route choice probability. To the best of our knowledge, work presented in [2] represents the state-of-the-art solution to the inference of travel time and route preferences of commuters inside a metro network based on AFC data. It proposes a different likelihood model of the observed commuter travel time by modeling the path travel time as complicated convolutions of Poisson distributions, and models the path choice probability as a logit model of the station number factor and the transfer number factor. Due to the intractability of the model, [2] also proposes approximate inference schemes to estimate the model parameters. The models discussed above assume the commuter route choice is determined by a few predetermined influential factors (e.g., route travel time, transfer number). However, factors that affect commuters’ route-choice decisions could be complicated and difficult to model, missing key influential factors may affect the accuracy of the model. Different from existing solutions, we adopt a data-driven approach. TripDecoder models the route preferences purely based on real travel time observations reflected by the smart card data but not any explicit influential factor. In addition, there is interrelationship between these two inference tasks and all the existing works perform these two inference tasks simultaneously, which significantly increases the complexity of proposed models. The models search for the optimal parameter combination in an extremely large search space, which results in low accuracy and poor efficiency and scalability. TripDecoder is designed to address both the accuracy issue and the performance issue, as we strongly believe that an ideal solution shall be able to achieve a high accuracy and to complete the inference tasks efficiently and meanwhile is scalable. To our best knowledge, this is the first work on learning the travel time and route preferences from AFC data that considers the efficiency and scalability of the inference model, in addition to the accuracy. A preliminary work was published in [18]. As compared with previous preliminary work, we have made following new contributions in this extended version. First, we have improved the inference models which helps to further improve the accuracy and the efficiency of the proposed model framework. For example, we notice the entry walking time and the exit walking time may follow different distributions, as the exiting action happens right after a train reaches the station while the entering action could happen any time. Accordingly, in this extended version, we assume they follow different distributions which does improve the accuracy. Instead of modeling the travel , Vol. 1, No. 1, Article . Publication date: May 2020.
TRIPDECODER: Study Travel Time Attributes and Route Preferences of Metro Systems from Smart Card Data                                                                           5

time from station si to its adjacent station s j and the time from s j to si differently, we simplify
the model by assuming the travel time is independent of the direction. It does help reduce the
complexity of the model and hence improve the efficiency, without downgrading the accuracy.
When we perform the inference, we explore the impact of initial values on the performance and
the new initial values used in this extended version actually are more appropriate as the training
time has been reduced. Second, we have significantly improved the experimental study. To be more
specific, we have included the work published in [2] as a new competitor; we have included the AFC
data collected from Taipei as an additional dataset and reported the performance of TripDecoder
and its competitors based on Taipei dataset; we have designed and implemented an evaluation
framework for the inference of route preference and reported the performance of TripDecoder and
its competitors; and we have included a new set of experiments to demonstrate the advantage of
TripDecoder in terms of efficiency and scalability, as compared with its competitors. Third, we have
detailed the insights we have obtained from our initial study on Singapore dataset, which suggest a
simple but very novel and effective approach to perform the inference of travel time. Fourth, we
have significantly improved the presentation and the organization of the paper. In brief, we believe
this extended version has included sufficient fresh contributions.

3     PRELIMINARY
Before we present TripDecoder, we first propose a trip reconstruction process in Section 3.1, which
defines a trip as a sequence of steps to ease the inference of the travel time required. We formulate
the metro system as a general graph network and introduce the notations used throughout the
paper. Next, we introduce the concept of candidate route set Rod that is defined for a given OD pair
⟨o, d⟩ in Section 3.2. We use this concept to cluster all the OD pairs into two disjoint categories, the
one with only one candidate route and the other with multiple candidate routes. We then perform
data exploration in Section 3.3, using AFC data collected from Singapore and Taipei, and report our
findings, which lay the foundation for TripDecoder. Table 1 lists the symbols that will be frequently
used in the rest of the paper.

3.1       Problem Formulation
In this paper, we model a metro network as a general transportation graph G(S, E, L), consisting
of a set of metro stations S, a set of edges E, and a set of metro lines L. A station s ∈ S could be
either a normal station that is crossed by only one metro line or an interchange that is crossed by
multiple metro lines. An edge (or a link, interchangeably) e(si , s j , l) ∈ E is a segment on a train
line l x ∈ L that connects two stations si and s j without passing any other station. Stations si and
s j are so called adjacent if there is an edge e(si , s j , l) ∈ E between them. Note that there could be
multiple edges corresponding to two adjacent stations (si , s j ), corresponding to different lines. In
addition, we model a metro network as an undirected graph for simplicity. However, the techniques
developed in this paper could be easily extended to support the case where a metro network is
modelled as a directed graph.
     An example metro network is depicted in Figure 1 for illustration purpose. Accordingly, we
have S = {s 1 , s 2 , s 3 , s 4 , s 5 , s 6 , · · · }, E = {e 1 (s 1 , s 2 , l 1 ), e 2 (s 2 , s 3 , l 1 ), e 3 (s 3 , s 4 , l 1 ), e 4 (s 2 , s 3 , l 2 ), e 5 (s 3 , s 5 , l 2 ),
e 5 (s 5 , s 6 , l 2 ) · · · }, and L = {l 1 , l 2 , · · · }. Station s 2 and station s 3 are adjacent, and they are connected
by two edges, i.e., e 2 and e 4 corresponding to lines l 1 and l 2 respectively. Stations s 2 and s 3 are also
interchanges as commuters can switch from one service line to another at both s 2 and s 3 , while
stations s 1 , s 4 , s 5 and s 6 are normal stations.
     A route r i j from an origin station si to a destination station s j is a sequence of adjacent edges
⟨e 1 , · · · , ek ⟩ that could bring commuters from station si to station s j . Edge e 1 (si 1 , s j1 , l 1 ) and edge
e 2 (si 2 , s j2 , l 2 ) are adjacent if e 1 .s j1 = e 2 .si 2 , while they do not necessarily correspond to the same line.

                                                                                                       , Vol. 1, No. 1, Article . Publication date: May 2020.
6 Xiancai TIAN, Baihua ZHENG, Yazhe WANG, Hsiao-Ting HUANG, and Chih-Chieh HUNG
Table 1. Frequent Symbols
Symbol Definition
G(S, E, L) a general transportation graph with S, E, L representing stations, edges, and
service lines respectively
ri j a route from station si to station s j
r i j .k the number of links travelled by a route r i j
r i j .q the number of transfers required by a route r i j
|r i j | the length of route r i j which is defined as r i j .k + α × r i j .q
Tr i j the travel time required by a route r i j
д
Ts entry walking time from the turnstile to the platform at station s
Tlw waiting time for the service line l at the platform
Tec train travel time corresponding to an link e
q
Ts transfer time required at interchange station s
Tsa exit walking time from the platform to the turnstile at station s
tr a trip record captured by AFC data, in the form of (id, so , sd , t)
T Rod the set of observed trips corresponding to a given OD pair ⟨o, d⟩, T Rod =
{tr |tr .so = o ∧ tr .sd = d }
Rod the set of routes corresponding to a given OD pair ⟨o, d⟩, i.e., Rod = ∪r od
min
r od the route corresponding to OD pair ⟨o, d⟩ with the shortest length
OD s /ODm the set of OD pairs that have one route/multiple routes
T Rs /T Rm the set of trip observations that corresponding to the OD pairs preserved by
OD s /ODm
s4 line l1
s1 s2 s3
line l2
s5 s6
Fig. 1. Example network
If two edges are in different line, that is e 1 .l 1 , e 2 .l 2 , it indicates the travel from e 1 to e 2 requires a
transfer from line e 1 .l 1 to another line e 2 .l 2 at the station e 1 .s j1 . For example, edges e 1 and e 2 are
adjacent but not edges e 1 and e 3 . Route r 15 = ⟨e 1 , e 2 , e 5 ⟩ provides an example route from station
s 1 to station s 5 which requires a transfer at station s 3 ; and r 15 ′ = ⟨e , e , e ⟩ is another route from
1 4 5
station s 1 to s 5 which requires a transfer at station s 2 .
In this paper, we only consider simple routes without loop, so that each route only visits a station
at most once. If we assume that there is no significant difference among the travel time required by
each edge, the length of a route r i j is determined by two parameters, the number of edges travelled
and the number of transfers required, denoted by r i j .k and r i j .q, respectively. Take the example
route r 15 as an example. We have r 15 .k = 3 as it passes three edges and r 15 .q = 1 as it requires one
transfer at the transfer station s 3 . Since a route may include transfer stations, we generalize the
length of a route by taking the number of transfers into account. Given a route r i j , the length of r i j
is defined as |r i j | = r i j .k + α × r i j .q, e.g., |r 15 | = 3 + α. Here, α is the penalty coefficient of transfer2 .
2A common practice in transportation research is to set this value to 2.
, Vol. 1, No. 1, Article . Publication date: May 2020.TRIPDECODER: Study Travel Time Attributes and Route Preferences of Metro Systems from Smart Card Data 7
Entry station Line 1 Transfer station Line 2 Exit station
Walk Wait
Entry Entry In-vehicle In-vehicle In-vehicle In-vehicle In-vehicle In-vehicle Exit
walking link waiting link travel link travel links travel link Transfer link travel link travel links travel link walking link
Fig. 2. Travel links of a trip in the metro system
In addition to the length of a route, we also denote Tr i j as the corresponding travel time required
when a commuter takes route r i j to travel from the boarding station si to the alighting station s j .
When the context is clear, we can use Tr to represent Tr i j for brevity. A trip starts when a commuter
enters the turnstile, which consists of following four components, walking to the platform, waiting
for the train, travelling via the train, and walking to the turnstile to exit the station and complete
the trip. If the route taken requires transfers, an additional component (i.e., transfer) is involved.
Accordingly, we can model Tr based on following five kinds of travel links, representing the five
different travel components described above. In the rest of the paper, the term travel link is used to
refer to one component of a trip via a metro system, which contributes to the total time required
by a trip from entering the boarding station to exiting the alighting station.
д
• Tsi : entry walking time from turnstiles to the platform at the boarding station si
• Tlwx : waiting time for the train service l x at station si
• Tec : train travel time of every edge e
q
• Ts : transfer time required at an interchange station s
• Tsaj : exit walking time from the platform to turnstiles at the alighting station s j
Here, the transfer time at station s consists of walking time from one platform to another, and
waiting time for the next train. For the case of Singapore, most interchanges are crossed by two
different metro lines. The only exception is the Dhoby Ghaut station in city center that is crossed
by three MRT lines, thus it has three unique transfer walking time distributions. In addition, Tlwx is
independent of the station, as the service frequency of a service line l x does not change from station
to station. Notice in reality, the entry/exit walking time at station s also depends on the platform
and turnstiles the commuters travel between, while we abuse the notation here for simplicity. Given
an edge e(si , s j , l x ) connecting station si and station s j , we assume the travel time required from si
to s j via service line l x is exactly the same as that required from s j to si via the same edge. In other
words, we assume that bi-directional travel costs between two adjacent stations are characterized by
an identical distribution. However, TripDecoder could be easily extended to perform the inferences
when we model a metro system as a directed graph, and the travel time required from station si
to its adjacent station s j might be different from that from s j to si . We further visualize the travel
links in Figure 2 to facilitate the understanding.
After decomposing a trip into five different types of travel links, we can sum the time spent on
each travel link of r i j in order to calculate the total travel time of r i j = ⟨e 1 , e 2 , · · · , ek ⟩, as shown in
Equation (1). Note, Sm refers to the set of interchange stations on route r i j where commuters have
to make transfers.
k
д
Õ q
Tr = Tsi + Tlwx + Tecb + Ts + Tsaj
Õ
(1)
b=1 s ∈Sm
The AFC system records the trips of individual commuters. Each trip observation, represented
as (id, so , sd , to , td ), captures the details of a real trip tr made by a commuter via the metro network.
Here, id is an encrypted unique string identifying a smart card, so is the origin station, sd is the
destination station, to records the time stamp when the commuter enters the station so , and td
, Vol. 1, No. 1, Article . Publication date: May 2020.8 Xiancai TIAN, Baihua ZHENG, Yazhe WANG, Hsiao-Ting HUANG, and Chih-Chieh HUNG
records the time stamp when the commuter exits the alighting station sd from a turnstile. In other
word, t = td − to captures the real travel time required. In the rest of this paper, we represent each
trip record as tr = (id, so , sd , t) for convenience. Given an OD pair ⟨o, d⟩, we collect all the trip
records tr that are corresponding to ⟨o, d⟩ into a set T Rod , i.e., ∀tr ∈ T Rod , tr .so = o ∧ tr .sd = d.
This paper aims at inferring the time corresponding to each travel link in order to infer the time
required by all possible routes, as well as the probabilities that commuters choose each candidate
route to travel for any given OD pair ⟨o, d⟩, given a static MRT network structure G(S, E, L) and
the set of trip observations captured by the AFC system. We formally define the first inference task
in Definition 3.1; we will present the formal definition of the second inference task in Section 3.2,
after we introduce the concept of candidate route set.
Definition 3.1. Inference of Route Travel Time. Given a metro network G(S, Ð E, L), and a large
set of trips corresponding to different OD pairs captured by AFC systems X = ⟨o,d ⟩ ∈S ×S ∧o,d T Rod ,
inference of route travel time is to infer the travel time of all the travel links that might contribute to
the total travel time required by any route r i j , which can best fit the traveling time observed in X . □
3.2 Candidate Routes Extraction
As mentioned previously, redundant design is adopted to tolerate faults, because of the reliability
requirement of a metro network. Consequently, there could be multiple routes available from an
origin station si to a destination station s j . We therefore introduce the concept of candidate route
set. Let Rod denote the complete set of possible routes of an OD pair ⟨o, d⟩, and let r od min refer to the
min min
one with the shortest length, i.e., ∀r ∈ Rod , |r od | ≤ |r | ∧ ∃r ∈ Rod , r = r od . Formally, we name
′ ′
Rod as the candidate route set corresponding to the OD pair ⟨o, d⟩.
To generate a candidate route set Rod for each OD pair ⟨o, d⟩, there are different strategies,
such as edge elimination and k-shortest-paths. Nevertheless, the number of stations in a metro
system usually is in the scale of either tens or hundreds, e.g., New York City Subway has in total
400+ stations, the most stations owned by a metro system. Consequently, we can simply adopt
brute-force-search algorithm to form Rod for different OD pairs ⟨o, d⟩s.
Given a candidate route set Rod w.r.t. an OD pair ⟨o, d⟩, we also notice that some routes may
never be used by commuters, e.g., those that are much longer than other routes, and those with too
′
many transfers that bring inconvenience. We, therefore, define a restricted candidate route set Rod
w.r.t. an OD pair ⟨o, d⟩, which excludes those rarely-used or never-used routes based on following
criteria:
• routes with any loops
• routes that are more than β (> 1) times longer than the shortest route r od min
• routes that are not the shortest paths but require more than σ transfers
The controlling parameters β and σ could be set according to different assumptions made on
commuters’ behavior. For example, in our study, we set both β and σ to two. The underlying
assumptions are i) commuters might not always take the shortest route, but they are not willing to
take routes that are much longer than necessary; and ii) some commuters may be willing to make
transfers for comfortability or other reasons, but a route that requires more than two transfers is
not preferred. However, the solution proposed in this paper is independent on the values of β or σ .
′ min ∨ r .q ≤ σ ) ∧ |r | ≤ β × r min }. In the rest of this paper, we refer
In brief, Rod = {r ∈ Rod |(r = r od od ′
candidate routes set of an OD pair ⟨o, d⟩ to its restricted candidate route set Rod . The notation |Rod |
stands for the number of routes inside the candidate route set Rod . Based on the candidate route
set, we present the second inference task that this paper wants to perform in Definition 3.2. Note
that we can infer the route preference at either the aggregation level or the individual level. At the
aggregation level, we can learn the route preferences of the entire commuter population based on
, Vol. 1, No. 1, Article . Publication date: May 2020.TRIPDECODER: Study Travel Time Attributes and Route Preferences of Metro Systems from Smart Card Data 9
1XPRI2'3DLUV
1XPRI&DQGLGDWH5RXWHV
Fig. 3. Candidate routes distribution of Singapore MRT (β = 2 ∧ σ = 2)
the city-scale trip observations; at the individual level, we can learn the preference of a particular
individual based on the trip records corresponding to that individual only.
Definition 3.2. Inference of Route Preferences. Given a metro network G(S, E, L) and a large
set of trips corresponding to different OD pairs captured by AFC systems X = ⟨o,d ⟩ ∈S ×S ∧o,d T Rod ,
Ð
inference of route preferences is to infer, for an OD pair ⟨o, d⟩ with multiple routes (i.e., |Rod | > 1), the
likelihood that each route r ∈ Rod will be taken by a commuter to travel from o to d. □
For illustration purpose, we report the size of candidate route sets of different OD pairs corre-
sponding to Singapore metro system in Figure 3. As it can be observed, the number of candidate
routes of OD pairs varies from 1 to 15. We then categorize all the OD pairs according to the sizes
of their respective candidate route sets. To be more specific, single route set OD s keeps all the OD
pairs with single route, and multiple route set ODm keeps all the OD pairs with multiple routes,
i.e., OD s = {⟨o, d⟩ ∈ S × S |o , d ∧ |Rod | = 1}, and ODm = {⟨o, d⟩ ∈ S × S |o , d ∧ |Rod | > 1}. The
inference of route preference only focuses on OD pairs preserved by ODm .
3.3 Data Exploration Insights
As we highlight in Section 1, TripDecoder adopts an approach that is very different from all the
existing solutions, i.e., decoupling the inference of the route travel time from the inferring of the
route preferences. To the best of our knowledge, this is the first work that decouples these two
inference tasks, which in turn benefits both the accuracy and the efficiency of the inferences. It
is worth noting that although decoupling sounds simple, it is non-trivial to propose a two-step
framework to not only simplify the inference tasks but also improve the accuracy, as these two
inference tasks have interrelationship. Our design is partially motivated by the insights we have
collected from Singapore AFC data in our data exploration, to be detailed next.
The Singapore MRT network, as shown in Figure 4, consists of 102 stations, 7 MRT lines (including
two line extensions), and 114 edges between adjacent stations (until May 2016). Trip data collected
by the AFC system in 2015 December is utilized as one data source in our study. As train operation
timetable differs from peak hours to non-peak hours and from weekday to weekend, we study trips
happened during weekday morning peak and evening peak respectively, i.e., in Singapore, morning
peak is from 7:30am to 9:30am, and evening peak is from 5:30pm to 7:30pm.
, Vol. 1, No. 1, Article . Publication date: May 2020.10 Xiancai TIAN, Baihua ZHENG, Yazhe WANG, Hsiao-Ting HUANG, and Chih-Chieh HUNG
Kranji Woodlands Sembawang
NS7 NS8 NS9 NS10 NS11
Marsiling Admiralty
Yew Tee NS5
NS13 Yishun 7
Punggol
11 NS14 Khatib
NE17
Bukit Sengkang NE16
Choa Chu Kang NS4 Panjang
DT1
NS15 Yio Chu Kang Buangkok NE15
Cashew DT2
Hougang NE14
NS16 Ang Mo Kio
Hillview DT3 Kovan NE13
Bukit Gombak NS3
Beauty World DT5
Marymount Bishan Lorong Chuan 1
CC16 NS17 CC15 CC14 NE12 CC13
King Albert Park DT6 Serangoon EW1 Pasir Ris
Caldecott CC17 CC12 Bartley
2 Braddell NS18
Woodleigh NE11
Bukit Batok NS2
Tai Seng
EW29 Joo Koon Sixth Avenue DT7 CC11
Tampines
Tan Kah Kee Stevens NS19 Toa Payoh EW2
DT8 CC19 DT9 DT10
Botanic NE10 Potong Pasir CC10 MacPherson
EW28 Pioneer Gardens NS20 Novena
Boon Keng EW3 Simei
Lakeside Jurong East NS21 DT11 Newton
NE9
EW27 EW26 EW25 NS1 EW24
CC20 Farrer Road
Boon Lay Chinese NE8 Farrer Park Paya Tanah
Clementi
Garden 4 EW23
Orchard NS22 Lebar
EW8 CC9 EW7
Kembangan
EW6 EW5
Merah
EW4
CC21 Holland Village
EW22 Dover NE7 DT12 Little India Eunos Bedok
Somerset NS23
EW9 Aljunied
8
CC8 Dakota
Expo
3
Buona Vista EW21 CC22
EW10 Kallang CG1 CG2
DT13 Rochor
EW20 Commonwealth Dhoby Ghaut NS24 NE6 CC1 Changi
one-north CC23 EW11 Lavender
CC7 Mountbatten Airport
Queenstown EW19
Kent Ridge CC24 CC2 Bras Basah EW12 DT14 Bugis CC6 Stadium
NE5 Clarke Quay
Redhill EW18
12 CC5 Nicoll Highway
Tiong Bahru EW17
Haw Par Villa CC25 NE4 DT19 Chinatown CC3 Esplanade
DT15 CC4 Promenade
Outram Park EW16 NE3 DT18 Telok Ayer City Hall EW13 NS25
Pasir Panjang CC26
Raffles Place EW14 NS26
Tanjong Pagar EW15 DT16 CE1 Bayfront
Labrador Park CC27
Downtown
DT17
East West Line
Telok Blangah CC28
North South Line
North East Line
HarbourFront NE1 CC29 NS27 CE2 Marina Bay Circle Line
Downtown Line
6 9 10
NS28 Marina South Pier
Footnote: * Denote stations which are currently not in operation along existing lines 5
Mass Rapid Transit System Map, C 2016 Singapore
Fig. 4. Singapore MRT network map (as of 2016 May)
Table 2. Statistics of Candidate Routes Sets for Singapore and Taipei
Singapore Taipei
OD s ODm OD s ODm
Number of OD pairs 4,042 6,260 7,258 4,298
% of OD pairs 39.24% 60.76% 62.81% 37.19%
Table 3. Number of Trips Covering Individual Travel Links
Number of travel links
Number of trips Singapore Taipei
(0,100] 10 6
(100,1K] 21 34
(1K, 10K] 93 166
(10K, 100K] 197 205
>100K 127 82
There are in total 10, 302 (i.e., = 101 × 102) OD pairs inside the Singapore MRT network. After
generating candidate route sets for all OD pairs as described in Section 3.2, we find that 39.24% of OD
pairs have only one candidate route, i.e., single route set OD s consists of 10, 302 × 39.24% = 4, 042
OD pairs, as reported in Table 2. When we further check those 4, 042 OD pairs in OD s , we find out
that their routes actually cover each single travel link that might be a component of the travel time
Tr of any route r (i.e., a component of Equation (1)).
, Vol. 1, No. 1, Article . Publication date: May 2020.TRIPDECODER: Study Travel Time Attributes and Route Preferences of Metro Systems from Smart Card Data 11
To be more specific, given a metro system, we could enumerate all the travel links. Take Sin-
gapore MRT network as an example. There are 7 service lines, so there are in total 7 travel links
corresponding to Tlwx . There are 114 edges, so there are in total 114 travel links corresponding to
Tec . There are 102 stations with 19 being interchanges and 83 being normal stations. Each normal
д
station contributes one travel link to Tsi and one travel link to Tsai , while each interchange could
д
produce multiple travel links to Tsi and Tsai , dependent on the number of the platforms and the
number of exits it has. Take Dhoby Ghaut station as an example. It is passed by 3 lines and has 2
exits located at very different locations, where each unique platform-exit combination produces a
д
unique travel link, so in total it contributes to 3 × 2 = 6 travel links to both Tsi and Tsai . In summary,
д
there are 153 travel links corresponding to Ts and Tsa respectively. The number of travel links
q
corresponding to Ts depends on the number of lines passing by each interchange station, and the
number of interchange stations, and in total there are 21 travel links. In other words, we have
(7 + 114 + 153 × 2 + 21) = 448 travel links corresponding to the Singapore metro system (as of May
2016). If we could derive all those 448 travel links, the travel time of any route could be recovered
based on Equation (1). The real trip records corresponding to single route OD pairs captured by the
AFC system actually cover each single travel link. Here, we say a trip record covers a travel link if
and only if the travel link contributes to the time duration required by the trip.
This observation suggests a possibility that we actually have sufficient trip observations to
perform inference of route travel time based only on the trips corresponding to the OD pairs in
the single route set OD s . Recall that all the OD pairs ⟨o, d⟩s in the single route set OD s share a
common unique feature, that is there is only one route sending a commuter from the origin station
o to the destination station d. Accordingly, given an AFC trip record tr from o to d, we know the
exact route taken by the commuter for the trip tr . This is to say, we can locate all the travel links
travelled by tr without any ambiguity, i.e., the entry/exit station, the links e 1 , e 2 , · · · , ek travelled
and the transfer Sm required in Equation (1) are known. In other words, we can take all the trip
records tr s that are corresponding to OD pairs inside the single route set OD s to infer the travel
time of different travel links. This significantly simplifies the inferring of the travel time, which
will be further demonstrated by our experimental study to be presented in Section 5.
To further verify our conjecture and test if there are sufficient trip records to perform the
inference, for each travel link in the metro network G, we further count the number of trips
corresponding to only the single route OD pairs that cover the travel link, as reported in Table 3.
Notice that the count reported is based on one month of morning peak trip records collected by
AFC system in Singapore. As can be observed, 97.8% of the travel links are covered by more than
100 trip records, and 93.1% of the travel links are covered by more than 1, 000 trip records, which
suggests that the trips corresponding to single-route OD pairs are indeed sufficient to perform
robust inferences of the travel time of each travel link. Note that the number of trips will be further
increased when the duration corresponding to the data collection is extended. Consequently, we
would like to conclude that the finding of the trip records of single-route OD pairs being sufficient
to infer the travel time is NOT a coincidence that is only observed from the Singapore dataset. For
example, we have performed a similar study on Taipei dataset, again based on one month city-scale
data collection. As reported in Table 2 and Table 3, the above statement is also valid on Taipei
dataset.
, Vol. 1, No. 1, Article . Publication date: May 2020.12 Xiancai TIAN, Baihua ZHENG, Yazhe WANG, Hsiao-Ting HUANG, and Chih-Chieh HUNG
Inference of
single route route travel time
OD pairs
metro system
Inference of
smart card multi-route route preferences
data OD pairs
TripDecoder
Fig. 5. TripDecoder framework
4 SOLUTION ALGORITHMS
As highlighted before, we propose to decouple the inference of route travel time from the inference
of route preferences. Accordingly, there are two major components in TripDecoder, the frame-
work proposed in this paper to perform the inference tasks. Figure 5 depicts the architecture of
TripDecoder. In the following, we detail how TripDecoder performs these two inference tasks.
4.1 Travel Time Inference
As stated in Equation (1), the travel time of a trip consists of five types of travel links, represented
д q д q
by Ts , Tlw , Tec , Ts and Tsa respectively. In this project, we assume Ts , Tlw , Tec , Ts and Tsa all follow
normal distribution, due to its simplicity and additive properties.
д д д
Ts ∼ N (µ s , σs ) (2)
Tlw ∼ N (µlw , σlw ) (3)
Tec ∼ N (µ ec , σec ) (4)
q q q
Ts ∼ N (µ s , σs ) (5)
Tsa ∼ N (µ sa , σsa ) (6)
where the probability distribution function of Gaussian distribution N (µ, σ ) is defined as
1 −(x −u)2
N (x; µ, σ ) = √ e 2σ 2 (7)
2πσ 2
As mentioned before, we assume the waiting time of a service line l is independent on the
stations, while different MRT lines can have different {µlw , σlw }.
For the inference of route travel time, it has to learn the mean and the variance in the normal
distribution for each travel link. The travel time from station i to station j which follows a normal
distribution is denoted by Ti j ∼ N (µ i j , σi2j ). Since Ti j assembles the travel time of every travel link
covering the route, the distribution of Ti j can be approximated by a Gaussian distribution and the
mean µ i j and variance σi2j could be derived as follows:
Ti j ∼ N (µ i j , σi j ) (8)
K
д q
µ i j = µ si + µlwx + µ ecb + µ s + µ saj
Õ Õ
(9)
b=1 s ∈Sm
K
д2 q2
σi2j = σsi + σlwx 2 + σecb 2 + σs + σsaj 2
Õ Õ
(10)
b=1 s ∈Sm
, Vol. 1, No. 1, Article . Publication date: May 2020.TRIPDECODER: Study Travel Time Attributes and Route Preferences of Metro Systems from Smart Card Data 13
Table 4. Initial Values for Travel Steps
Travel link µ (seconds) σ (seconds)
Normal station entry/exit walking 60 12
Interchange entry/exit walking 120 24
Transfer walking 60 12
Train service waiting tf * 0.5 tf * 0.05
a tf represents train frequency of a MRT line
For OD pair ⟨i, j⟩ with a single route (i.e., ⟨i, j⟩ ∈ OD s ), the likelihood of observing travel time t
is
−(t −ui j )2
1 2σi2j
L(µ i j , σi2j ; t) = N (t; µ i j , σi2j ) =q e (11)
2πσi2j
д д q q
Let parameter set Θ include all the travel time parameters to be inferred, i.e., {µ s , σs }, {µ s , σs },
and {µ sa , σsa } for all the stations s ∈ S, {µ ec , σec } for all the edges e ∈ E, and {µlw , σlw } for all
the lines l ∈ L. We propose to use maximum likelihood methods to estimate them. Given a
set of history trip records T Rs corresponding to the OD pairs in the single route set OD s , i.e.,
T Rs = {(idi , oi , di , ti )|⟨oi , di ⟩ ∈ OD s }, the full likelihood of T Rs is
−(t i −uo d )2
Rs |
|T
i i
Ö 1 2σ 2
L(Θ;T Rs ) = e oi di (12)
q
2
i=1 2πσ
oi di
Taking the logarithm of Equation (12), we can get the log-likelihood as
|T Rs |
" #
Õ 1 (ti − µ oi di )2
l(Θ;T Rs ) = − ln(2πσo2i di ) − (13)
i=1
2 2σo2i di
To begin with, we initialize Θ based on prior knowledge of the metro network or empirical
observations. Take Singapore MRT network as an example. µ ec is set based on statistics provided
д д
by Singapore Land Transport Authority (LTA), and the corresponding σec is set to µ ec /10. {µ s , σs },
q q a a w w
{µ s , σs }, {µ s , σs } and {µl , σl } are set based on empirical observations as shown in Table 4.
Thereafter, we perform stochastic gradient descent (SGD) to tune the parameters by maximizing
l(Θ;T Rs ).
4.2 Route Preferences Inference
Based on travel time deduced in Section 4.1, we are ready to assemble travel time distribution of
any route. For a given OD pair ⟨o, d⟩ ∈ ODm , each candidate route in Rod has a unique travel time
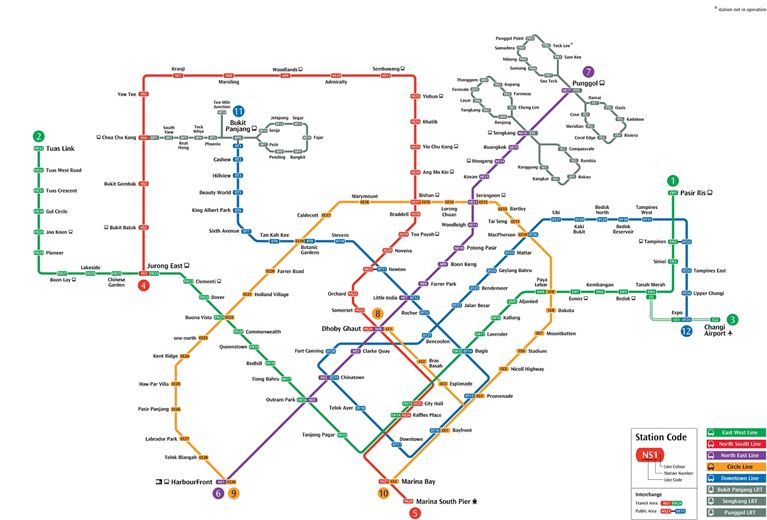
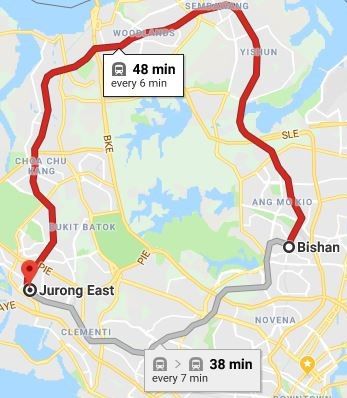
distribution. Take the routes from Bishan station to Jurong East station as an example. The real
travel time distribution based on T Rod is depicted in Figure 6, where we could observe two different
patterns, one pattern having an average travel time of about 33 minutes, and the other having an
average travel time of about 50 minutes. It is very likely that these two patterns of the travel time
represent the two different candidate routes, as suggested by Google Map shown in Figure 7. Thus,
T Rod can be modeled as a mixture of distributions from the different candidate routes,
Õ
T Rod ∼ π (r )N (t; µ r , σr2 ) (14)
r ∈R od
, Vol. 1, No. 1, Article . Publication date: May 2020.14 Xiancai TIAN, Baihua ZHENG, Yazhe WANG, Hsiao-Ting HUANG, and Chih-Chieh HUNG
)UHTXHQF\
7UDYHO7LPH
VHFRQGV
Fig. 6. Travel time observations from Bishan to Jurong East
Route 1 Route 2
Fig. 7. Two candidate routes from Bishan to Jurong East on Google Map
where µ r and σr of each candidate route have already been derived in Section Í 4.1. π (r ) refers to the
probability that commuters take r when traveling from o to d and thus r ∈Rod π (r ) = 1.
Assume we have a set of historical trip records T Rm corresponding to the OD pairs in the multiple
route set ODm , i.e., T Rm = {(id, oi , di , ti )| ⟨oi , di ⟩ ∈ ODm }. Let Π represent the set of parameters
related to route preference to be derived, i.e., Π = {pi(r )|r ∈ Rod ∧ |Rod | > 1}. Then, the full
likelihood of T Rm can be written as,
, Vol. 1, No. 1, Article . Publication date: May 2020.TRIPDECODER: Study Travel Time Attributes and Route Preferences of Metro Systems from Smart Card Data 15
Table 5. Smart Card Data Sample
id type entry date entry time exit date exit time origin id destination id
02***5F adult 2015-12-02 08:20:04 2015-12-02 08:27:27 35 12
02***5F adult 2015-12-02 18:13:57 2015-12-02 18:21:25 12 35
02***5F adult 2015-12-03 08:13:51 2015-12-03 08:21:21 35 12
02***5F adult 2015-12-03 18:31:45 2015-12-03 18:38:11 12 35
02***5F adult 2015-12-03 18:47:45 2015-12-03 19:01:16 35 12
Table 6. Smart Card Dataset Attributes
attribute notation description
id c id unique identifier of a smart card
type type commuter type (i.e., child, adult, senior)
entry date datein starting date of a ride
exit date dateout ending date of a ride
entry time tin starting time of a ride
exit time tout ending time of a ride
origin id idin unique identifier of the origin MRT station/bus stop
destination id idout unique identifier of the destination MRT station/bus stop
Rm |
|TÖ Õ
L(Π;T Rm ) = [ π (r )N (ti ; µ r , σr2 )] (15)
i=1 r ∈R oi di
Taking the logarithm of Equation (15), we get the log-likelihood as
Rm |
|TÕ Õ
l(Π;T Rm ) = ln( π (r )N (ti ; µ r , σr2 )) (16)
i=1 r ∈R oi di
To begin with, we assign equal likelihood to every candidate route of any OD pairs in ODm , i.e.,
π (r ) = 1/|Rod |, ∀r ∈ Rod ∧ ∀⟨o, d⟩ ∈ ODm
To get the maximum of Equation (16), again we perform SGD to tune route preferences Π.
5 CASE STUDY
To demonstrate the superior performance of TripDecoder, we conduct studies based on two real
sets of city-scale trip records collected in Singapore and Taipei. As mentioned before, we consider
both accuracy and efficiency as the goals when we design TripDecoder. Consequently, we will
compare the accuracy and the efficiency of TripDecoder with the state-of-the-art works. In the
following, we first briefly explain the real datasets used in this study, and then present the two
sets of experiments that evaluate the accuracy and the efficiency of TripDecoder as well as other
state-of-the-art works.
5.1 Experiments Settings
5.1.1 Data Brief. Our study is based on two sets of city-scale real trip records, captured by AFC
systems in Singapore and Taipei respectively. In particular, EZ-Link card and EasyCard are used as
, Vol. 1, No. 1, Article . Publication date: May 2020.16 Xiancai TIAN, Baihua ZHENG, Yazhe WANG, Hsiao-Ting HUANG, and Chih-Chieh HUNG
Table 7. Travel Time Prediction Error
Singapore Taipei
Morning Peak Evening Peak Morning Peak Evening Peak
TripDecoder 8.53% 10.38% 10.26% 10.88%
NIPS 17.40% 20.19% 19.63% 21.67%
Google Map 19.94% 19.49% 23.67% 25.45%
Gothere 12.06% 13.57% - -
the smart cards for payment of public transport in Singapore and Taipei, respectively. EZ-Link card
data collected in Singapore in 2015 December, and EasyCard data collected in Taipei in 2018 August
are used in this study. As our study is based on metro networks, we exclude the data corresponding
to bus rides in this study.
As listed in Table 5, each EZ-Link record in our data collection is corresponding to one MRT
ride, including the boarding and alighting MRT stations and the corresponding timestamps. Other
information such as the commuter type and the fare charge are also recorded. Apart from that,
each smart card is associated with an encrypted unique identifier, so that we can identify all the
rides taken by one commuter with commuter’s real identity being well protected. Table 6 lists the
attributes captured by each EZ-Link record. Taipei EasyCard data is no different except that it
doesn’t release the encrypted unique identifier of each card so we are not able to differentiate the
trips made by one commuter from those made by other commuters.
Due to defects of an AFC system, sometimes it generates duplicate records or trip records with
unrealistic travel duration (e.g., trips that last more than multiple hours or less than two minutes).
These records may bias our analytics and hence are removed.
5.1.2 Baselines. Our proposed method TripDecoder is compared against both commercial Apps and
academic research works. For commercial Apps, we include Google Map, the most popular direction
service in both Singapore and Taipei as the main representative. In addition, we also include Gothere
(https://gothere.sg), a very popular direction service used in Singapore. For academic research
works, the inference model published in NIPS 2017 [2] is the latest work which is employed as the
representative of the state-of-the-art work, denoted as NIPS.
5.1.3 Metrics. We employ the prediction error and the execution time to evaluate model effectiveness
and efficiency respectively. Given a set of trip observations X and a prediction method ρ, let µ od
be the expected travel time of route r od predicted by ρ. The prediction error of travel time of ρ is
defined as:
1 Õ |µ od − t |
error X, ρ = (17)
|X | t
(so ,sd ,t )∈X
The execution time reported in this paper is obtained by running the two inference tasks on
Microsoft Windows 10 Education instances, each of which is shipped with a Intel Core i8-8700
CPU @3.20GHz and a 32.0GB RAM.
5.2 Accuracy Evaluation
TripDecoder deduces both travel time parameters Θ and route preference Π. To report its per-
formance in a more comprehensive way, we conduct different sets of experiments to compare
the performance of TripDecoder with its competitors, for both the prediction error of derived Θ
(corresponding to the inference of travel time) and that of Π (corresponding to the inference of
route preferences).
, Vol. 1, No. 1, Article . Publication date: May 2020.TRIPDECODER: Study Travel Time Attributes and Route Preferences of Metro Systems from Smart Card Data 17
Table 8. Route Preferences Prediction Error (dataset: Singapore)
Morning Peak Evening Peak
TripDecoder 6.20% 7.02%
Shortest Route 7.40% 8.00%
NIPS 15.99% 16.52%
Evaluation of Travel Time Parameters. In Section 4.1, we use trip observations set T Rs to infer
travel link time parameters, which are then used to construct travel time of any route. As there
is only one route for any OD pair in OD s , there is no ambiguity among the candidate routes so
we know exactly the route taken by the commuters to travel from an origin o to a destination d
for each ⟨o, d⟩ ∈ OD s . Consequently, we can derive µ od for each trip record in T Rs and derive the
prediction error following Equation (17).
Table 7 reports the prediction error of TripDecoder and its competitors. For both Google Map and
Gothere, we submit 20 queries for each OD ⟨o, d⟩ pair in OD s and report the average performance.
Each of those 20 queries has the boarding station o as its current location, alighting station d as
its destination, and the trip start time is randomly selected from the duration (e.g., for morning
peak in Singapore, the trip start time is randomly selected from 7:30am to 9:30am). As could be
observed from the results, TripDecoder demonstrates a superior accuracy performance. For example,
TripDecoder reduces the prediction error of Google Map by 14.25% and 17.57%, for Singapore dataset
and Taipei dataset respectively.
Evaluation of Route Preferences. As stated in Definition 3.2, the inference of route preferences
is to infer the likelihood that a commuter takes a specific route r ∈ Rod when the route candidate set
Rod has multiple routes. However, we do not have the ground truth of which commuter takes which
route to complete her trip inside the metro network. Consequently, how to evaluate the accuracy
of the second inference task remains challenging. In this study, we propose a novel evaluation plan
that is based on an assumption that a commuter who has to travel from station so to station sd
regularly has her own preferences, if there are multiple routes available. The main idea is to learn
individual commuter’s preference for the trip from station so to the station sd from the historical
trips made by the commuter, and to predict the route taken by the commuter when she is about
to make the same trip. Based on the route preference, we can infer the time required and get the
accuracy when we compare the predicted time with the ground truth time captured by AFC data.
In order to implement this evaluation plan, we strategically group the trip records in T Rm based
on ⟨id, o, d⟩. That is to say trip records in the same group, denoted as T Rodid , share the same id, o and
d values and we order the groups in descending order of their set sizes |T Rod id |, the number of trip
records in each group. We then select the top 10% of the groups based on their set size. In Singapore
dataset, top 10% groups have their set size ranging between 20 and 23. For each of such selected
groups T Rod id , we partition the trip records into two disjoint subsets based on the ratio of 1 : 1, with
one as the training subset and the other as the testing subset. We then feed the training subset
to TripDecoder and NIPS for the inference of route preference of the commuter whose encrypted
identifier is id, and use the inferred route preference to predict the route taken by the commuter
for the trips in the testing subset. For each trip ⟨id, o, d⟩ in the testing subset, we can predict the
time tp required by this trip, which is derived based on the preferred route r od inferred, the time
parameter of travel links inferred in the previous inference of route travel time, and Equation (1).
Accordingly, given the testing subset, we can measure the prediction error of TripDecoder and
NIPS, respectively based on Equation (17).
, Vol. 1, No. 1, Article . Publication date: May 2020.You can also read