Lakes Region Plan 2015-2020 - Lakes Region Planning ...
←
→
Page content transcription
If your browser does not render page correctly, please read the page content below
Lakes Region Plan 2015-2020
(this page left intentionally blank)

LAKES REGION PLAN 2015-2020 Natural Hazards and Climate Change   1
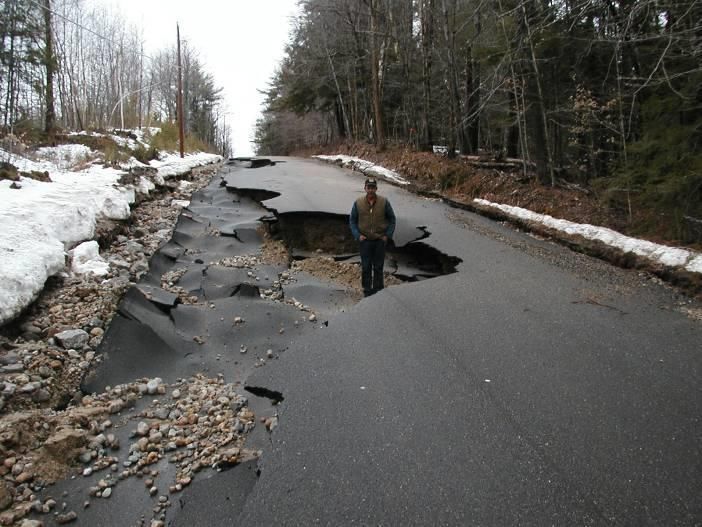
Table of Contents
I. Existing Conditions ................................................................................................... 4
        A. Hazards in the Lakes Region.............................................................................................. 4
             1. Flood ................................................................................................................................ 5
                      a) Floodplains ............................................................................................................ 6
                      b) Road Washouts .................................................................................................... 6
                      c) Dams ...................................................................................................................... 6
                      d) Ice Jam ................................................................................................................... 8
             2. Severe Winter Weather .................................................................................................. 9
             3. Severe Wind................................................................................................................... 10
                      a) Hurricane ............................................................................................................. 10
                      b) Tornado ............................................................................................................... 10
                      c) Downburst .......................................................................................................... 11
             4. Fire .................................................................................................................................. 11
                      a) Wildfire ................................................................................................................ 11
                      b) Conflagration ...................................................................................................... 11
             5. Earthquake..................................................................................................................... 12
             6. Health Hazards ............................................................................................................. 13
        B. Potential Impacts ............................................................................................................... 13
             1. People ............................................................................................................................. 13
             2. Structures ....................................................................................................................... 14
             3. Infrastructure................................................................................................................. 14
II. Factors Affecting Hazards and Impacts ................................................................. 15
        A. Climate Changes (past, present and future) ................................................................... 15
             1. Weather, Climate, Hazards .......................................................................................... 15
             2. Temperature .................................................................................................................. 15
             3. Precipitation................................................................................................................... 15
             4. Snow Cover and Ice Out ............................................................................................. 16
             5. Additional Climate Change Indicators ...................................................................... 16
        B. Future Climate Change...................................................................................................... 16
             1. Temperature .................................................................................................................. 16

                                                      LAKES REGION PLAN 2015-2020 Natural Hazards and Climate Change                                         2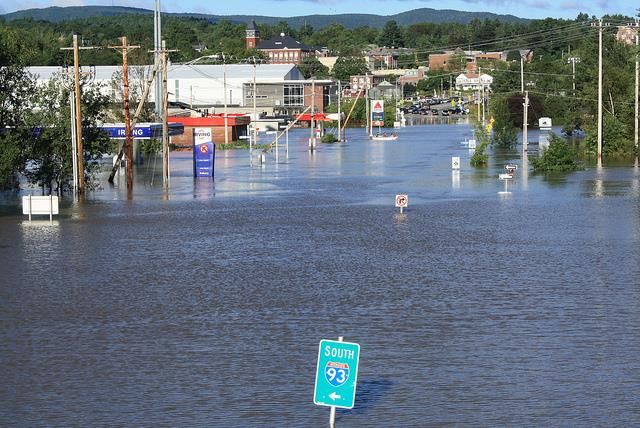
2. Precipitation................................................................................................................... 17
            3. Snow Cover ................................................................................................................... 17
            4. Other .............................................................................................................................. 17
       C. Development Activity ....................................................................................................... 17
            1. Floodplains .................................................................................................................... 17
            2. Hillsides and Ridges ..................................................................................................... 18
       D. Changing Demographics .................................................................................................. 18
III. Barriers & Opportunities ....................................................................................... 18
       A. Mitigation ............................................................................................................................ 18
       B. Current Planning ................................................................................................................ 18
       C. Awareness/Communication............................................................................................. 19
       D. Funding ............................................................................................................................... 19
       E. Collaboration ...................................................................................................................... 20
IV. Goals, Objectives, Actions ..................................................................................... 20
       A. Planning............................................................................................................................... 20
       B. Mitigation ............................................................................................................................ 21
       C. Education Outreach .......................................................................................................... 21
V. Resources …………………………………………………………………………....21

                                                    LAKES REGION PLAN 2015-2020 Natural Hazards and Climate Change                                       3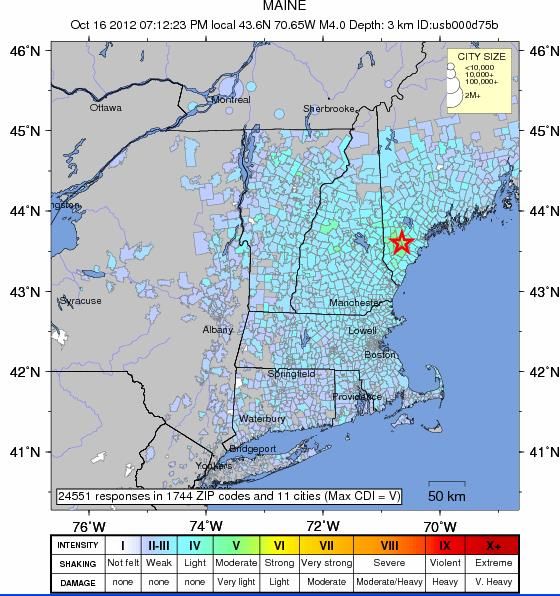
Natural Hazards
& Climate Change
________________________________________________________________________

I. EXISTING CONDITIONS

   A. Hazards in the Lakes Region

The Lakes Region is susceptible to a variety of natural hazards. The most frequently occurring
hazard events include flooding, severe winter weather, and severe wind events. Occasionally, two or
more of these hazards occur at the same time, such as during a tropical storm when flooding and
high winds occur simultaneously.

Weather events are often regional in nature, impacting the entire state or a portion of the state. Local
impacts from an event can vary. Some hazards, such as downbursts, are limited to a small area, while
others such as a nor’easter impact the entire region. While some hazard events seem to occur
randomly, the location of where certain hazard events, such as localized flooding, are likely to occur
is predictable.

Weather and hazard data tend to be reported on a county-wide or state-wide basis. The Lakes
Region encompasses all of Belknap County and portions of Carroll, Grafton, and Merrimack
Counties. Historical data gives us an awareness of the hazards we have experienced in the past and a
sense of what we should expect in the future. Often these reports include a description of the
impact that the events have had on people and the built environment. Figure 1 shows the Declared
Disasters that have impacted New Hampshire since 2007. In some cases the declaration applies to
the entire state while in other cases only certain counties are named in the declaration. The amount
of funding is based in part upon estimated damages and population. Between 1986 and 2013 there
were 28 Presidentially Declared Disasters or Emergency Declarations that impacted one or more of
the four counties in the Lakes Region. Ten of those declared events occurred prior to 2002, while
eighteen declared events have occurred since 2003.

                                   LAKES REGION PLAN 2015-2020 Natural Hazards and Climate Change     4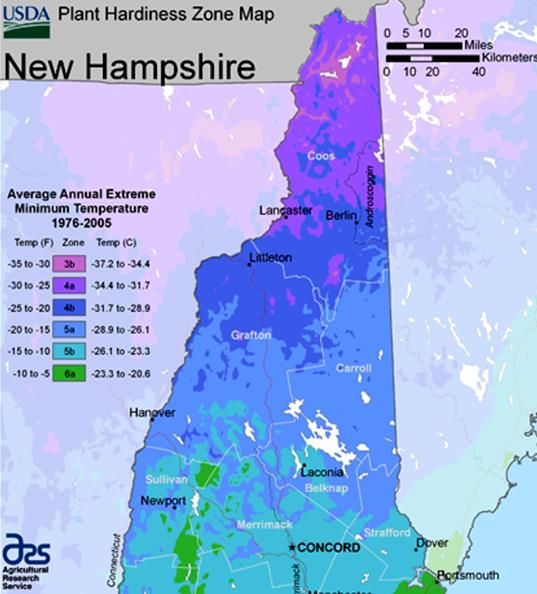
Figure 1 – Disaster Declarations in New Hampshire since 2007

Weather in particular is a dynamic phenomenon. There are a number of factors that influence
weather, which is often the driving factor in New England’s hazards. With the development of
computer modeling that can analyze massive amounts of data, weather forecasting has advanced
significantly during the last several decades. The exact path of a hurricane or nor’easter is often
difficult to predict but small differences can have a significant effect on what type of weather a
particular area receives. Tropical Storm Irene is an example of this; while Vermont and northwestern
New Hampshire received huge amounts of rainfall, resulting in swollen streams and rivers and
catastrophic erosion, eastern New Hampshire and the Lakes Region escaped with relatively minor
amounts of flooding (see http://www.erh.noaa.gov/gyx/Irene/Irene%20Rainfall.PNG).

By looking back over past records scientists can often detect patterns in the region’s climate. A
recent detailed review of climatic data for the state shows that winter temperatures have been rising
along with the number of intense rain and snowstorms. Where we can plan, we should plan.
Mitigating the impacts of hazard events on people’s lives and property both public and private is
prudent.

        1. Flood
Flooding is defined as a temporary overflow of water onto lands that are not normally covered by
water. It results from the overflow of rivers and tributaries or inadequate drainage. With the varied
terrain of the Lakes Region, a variety of forms of flooding can occur ranging from rushing streams

                                  LAKES REGION PLAN 2015-2020 Natural Hazards and Climate Change   5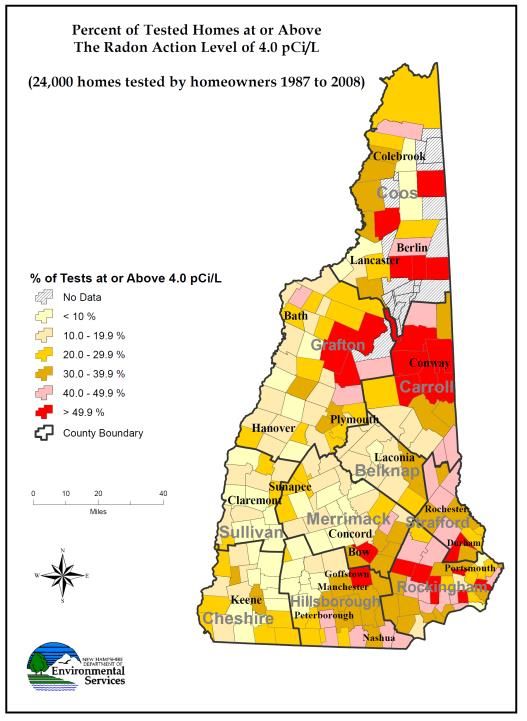
in mountainous areas such as the Sandwich, Squam, and Belknap ranges to bigger rivers, wider
floodplains, and even overfilled lakes.
Figure 2 - Pemigewasset River flooding in Holderness along NH Rte. 175A, April 2011
Credit: http://farm7.staticflickr.com/6079/6092948164_57ea16a060_z.jpg
a) Floodplains
Flooding is most commonly associated with structures and properties located within the 1% annual
(or 100-year) floodplain. Areas in this floodplain have been identified as having a one percent chance
of flooding any given year. Residents and community decision-makers can refer to real-time data
from stream gauges which report the height of many of rivers and lakes throughout the region.1 This
can be compared with historical data at these sites, sometimes dating back more than a century.
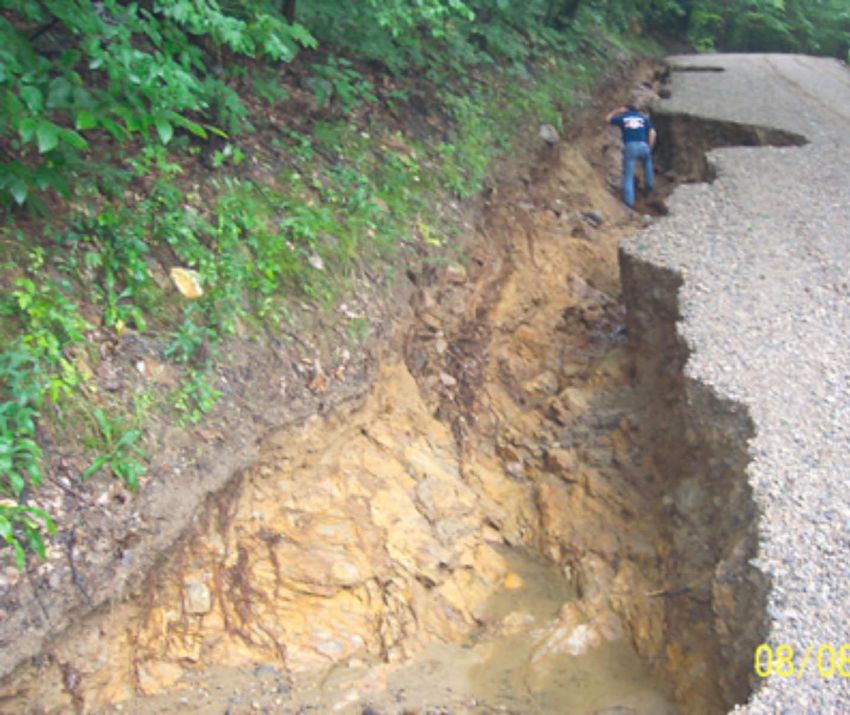
b) Road Washouts
Numerous streams crisscross the region’s
landscape, supplying the ponds, rivers, and lakes
which dominate the area. While some are
identified as having floodplains, others merely
become rushing streams in a heavy rainfall or
quick snowmelt. Where these are in proximity to
roads, they can result in erosion and washout of
roads and culverts. Steep hillsides are particularly
susceptible to such damage.
c) Dams
Dams in New Hampshire are classified by the Figure 3 - Beech Pond Road Wolfeboro, 2008
New Hampshire Department of Environmental
Services Dams Bureau. The four dam hazard classifications (High, Significant, Low, and Non-
Menace) are based on the potential losses associated with a dam failure. High and Significant Hazard
dams have the highest potential for damage; this could include damage to state or municipal
1 US Geological Survey stream gauges http://waterdata.usgs.gov/nh/nwis/sw.
LAKES REGION PLAN 2015-2020 Natural Hazards and Climate Change 6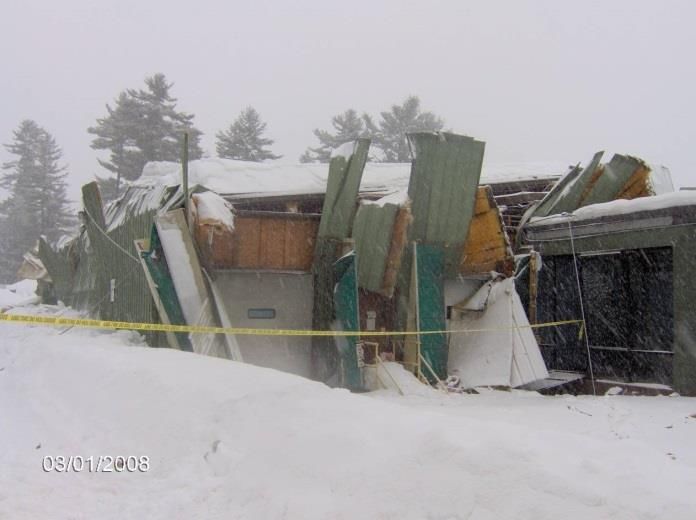
roadways as well as structures. There are 362 active dams in the Lakes Region; 13 are high hazard
dams, 24 are significant hazard dams, and 60 are low hazards, the rest are non-menace dams.

                Figure 4 – Significant and High Hazard Dams in the Lakes Region
                                                                                 DRAINAGE
 Hazard                                                               HEIGHT     AREA (sq.
 Class           NAME               TOWN               RIVER            (ft.)      mi.)      OWNER
          FRANKLIN FALLS
H         FLOOD CTRL            FRANKLIN       PEMIGEWASSET RIVER       140.00     1000.00   Federal
H         AYERS ISLAND DAM      BRISTOL        PEMIGEWASSET RIVER        90.00      746.00   Utility
H         EASTMAN FALLS DAM     FRANKLIN       PEMIGEWASSET RIVER        27.00     1013.00   Utility
H         SAWYER LAKE DAM       GILMANTON      BADGER BROOK              19.00        1.60    Local
H         SQUAM LAKE DAM        ASHLAND        SQUAM RIVER               18.00       57.80    State
H         SARGENT LAKE DAM      BELMONT        TIOGA RIVER               17.00        2.78   Private
H         ALTON POWER DAM       ALTON          MERRYMEETING RIVER        16.00       35.40    State
H         SUNCOOK LAKE DAM      BARNSTEAD      SUNCOOK RIVER             16.00       54.80    State
H         GRIST MILL POND DAM   ASHLAND        SQUAM RIVER               16.00       58.60   Private
                                               TR LAKE
H         LAKE WAUKEWAN DAM     MEREDITH       WINNIPESAUKEE             15.00       12.50   Private
H         CRESCENT LAKE DAM     WOLFEBORO      SMITH RIVER               15.00       36.00    Local
H         WEBSTER LAKE DAM      FRANKLIN       CHANCE POND BROOK         14.00       19.00    State
H         NEWFOUND LAKE DAM     BRISTOL        NEWFOUND RIVER            12.00       95.00    State
          WOLFEBORO SEWAGE
S         LAGOON                WOLFEBORO      BLOOD BROOK               45.00        0.06    Local
S         DAN HOLE RIVER DAM    OSSIPEE        DAN HOLE                  29.00       11.89    Local
S         CLEMENT DAM           TILTON         WINNIPESAUKEE RIVER       26.00      500.00   Private
S         STEVENS MILL DAM      FRANKLIN       WINNIPESAUKEE RIVER       22.00      474.00   Private
S         BRADLEY LAKE DAM      ANDOVER        HAME SHOP BROOK           19.00        4.00    Local
S         IPC UPPER DAM         BRISTOL        NEWFOUND RIVER            17.50       96.40   Private
S         SUNSET LAKE DAM       ALTON          SUNCOOK RIVER             17.00        6.90    State
S         BOG POND DAM          DANBURY        BOG BROOK                 17.00        7.20    State
                                MOULTONBORO    TR LAKE
S         LAKE KANASATKA DAM    UGH            WINNIPESAUKEE             17.00        7.30    State
S         MELVIN RIVER DAM      TUFTONBORO     MELVIN RIVER              16.50       15.61    State
S         COPPS POND DAM        TUFTONBORO     WINGATE BROOK             16.00        4.40    State
S         CRYSTAL LAKE DAM      GILMANTON      SUNCOOK RIVER             16.00       27.00    State
S         LOWER IPC DAM         BRISTOL        NEWFOUND RIVER            16.00       96.10   Private
          BARNSTEAD PARADE
S         DAM                   BARNSTEAD      SUNCOOK RIVER             16.00      114.00    State
          ASHLAND SEWAGE
S         LAGOON DAM            ASHLAND        NA                        15.00        0.00    Local
          GORDON HILL WATER
S         SUPPLY POND           NEW HAMPTON    DICKERMAN BROOK           14.50        0.60    Local
          BIG DAN HOLE POND
S         DAM                   OSSIPEE        DAN HOLE POND             12.50        5.68    Local
S         JACKSON POND DAM      NEW HAMPTON    JACKSON POND              12.00        1.05   Private
S         DICKERMAN POND DAM    NEW HAMPTON    DICKERMAN BROOK           11.00        1.96    State
          CAMP BELKNAP
S         SEWAGE LAGOON         TUFTONBORO     NA                        10.00        0.00   Private
S         HIGHLAND LAKE DAM     ANDOVER        TR SUCKER BROOK            9.20        5.02    Local
          CLEARWATER CAMP
S         LAGOON DAM            MEREDITH       NA                         8.00        0.00   Private
S         RUST POND DAM         WOLFEBORO      PERRY BROOK                8.00        2.66   Private
S         NEWFOUND RIVER DAM    BRISTOL        NEWFOUND RIVER             7.00       98.24   Private

                                 LAKES REGION PLAN 2015-2020 Natural Hazards and Climate Change        7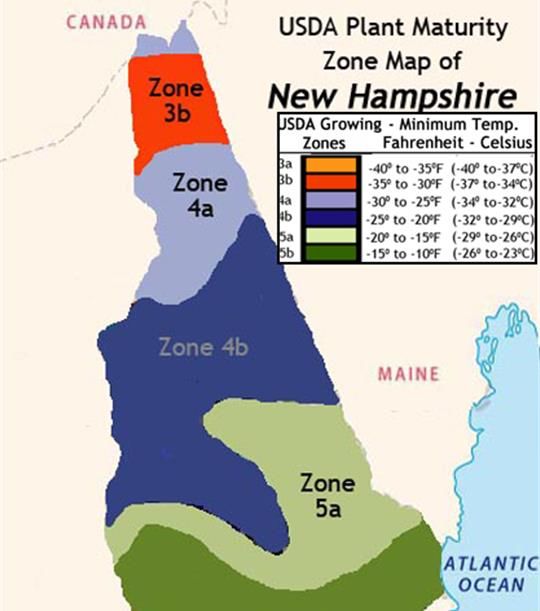
Some of these dams generate hydroelectric power and many are used for flood control. By adjusting
the height of the dam, the owner regulates water levels both upstream and downstream of the dam.
Lowering the water level on lakes in the fall facilitates repair work on docks and reduces the
possibility of damage to docks in the winter due to ice. In the spring, the owner of the dam controls
how much water is released and a balance has to be struck between upstream and downstream
needs. Release of too much water all at once can result in flooding and damages downstream, but
holding back too much water during a wet spring or summer can lead to flooding of shorefront
properties.

            d) Ice Jam
Ice forming in riverbeds and against structures presents significant hazardous conditions for
communities. Meltwater or stormwater may encounter these ice formations and apply lateral and/or
vertical force upon structures. Moving ice may scour abutments and riverbanks. Ice may also create
temporary dams. These dams can create flood hazard conditions where none previously existed. As
indicated by the stream gauge (Figures 5 and 6) record, ice jams can lead to very rapid changes in
river levels (in this case a fifteen foot increase in twelve hours).

                                         Flood Risk Management

Franklin Falls Dam was built and constructed in 1943 on the Pemigewasset River to protect cities and
towns along the Merrimack from flood damage. The operation of the Franklin Falls Dam is different
from the operation of other Federal flood control dams in New England for two primary
reasons: The dam is built on a major tributary river with the largest upstream watershed of all Federal
flood control dams in New England, and the dam has a limited storage capacity (equivalent of 2.8
inches of runoff across the entire watershed) while most Federal dams in New England have between 6
to 8 inches of runoff across their respective, smaller watersheds.

Since the dam has such an enormous watershed and very limited storage capacity by design, it is
operated to reduce downstream maximum peak flows and alter the timing of when peak flows impact
downstream properties and populations. Since its conception in 1943, Franklin Falls Dam has
prevented more than $165 million in damages.

http://www.nae.usace.army.mil/Missions/Recreation/FranklinFallsDam.aspx

                                    LAKES REGION PLAN 2015-2020 Natural Hazards and Climate Change   8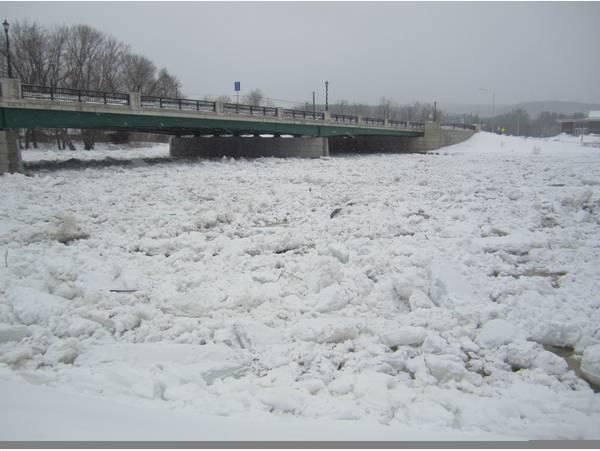
Figures 5 and 6: Ice jam on the Pemigewasset River at Holderness

        March 2011 Ice Jam at NH Route 175A                Stream gauge at bridge indicating change in
         bridge across the Pemigewasset River                    river level in early March 2011.

       2.     Severe Winter Weather
Winter weather conditions in particular can vary a great deal throughout the region; there may be
snow in the mountains of Sandwich or Alexandria, sleet in Meredith, and rain in Barnstead.

A heavy snowstorm can be defined as one which deposits four or more inches of snow in a twelve
hour period. The region typically receives greater than 66” of snow annually.2 Records from the
Laconia Airport indicate that eight or more inches have fallen in a single day on most dates from late
November through mid-March but the average snowfall on any day from November through April
is less than an inch. The record also shows that deposits of more than ten inches have happened in
each of these months and on several days in February. Gilford has seen more than fifteen, and even
twenty inches of snow in one day.

In the winter months, the region may experience blizzard conditions. A blizzard is characterized by
sustained winds or frequent gusts of 35 miles per hour or greater and considerable amounts of
falling or blowing snow that last for a duration of
three hours or longer. The combination of winds
and snow reduce visibility to less than a quarter
mile.3

New Hampshire generally experiences at least
one or two nor’easters each year with varying
degrees of severity. A nor’easter is defined as a
large anticyclone weather system that resides near
the New England region. These storms have the
potential to inflict more damage than many
hurricanes because high winds can last from
twelve hours to three days, while the duration of
hurricanes ranges from six to twelve hours. A                 Figure 7: Roof collapse, Franklin, NH - 2008

2
    Northeast States Emergency Consortium, http://www.nesec.org/, visited January 25, 2011.
3   “Winter storm terms,” http://www.fema.gov/hazard/winter/wi_terms.shtm, visited February 8, 2011.

                                         LAKES REGION PLAN 2015-2020 Natural Hazards and Climate Change      9
nor’easter also has the potential to sustain hurricane force winds, produce torrential rain, and create
blizzard conditions in winter months.
An ice storm coats trees, power lines, streets, vehicles, and roofs with a very slick and heavy layer of
ice. In the winter of 1998, a major ice storm crippled much of New Hampshire, coating everything
with as much as three inches of ice, resulting in more than $17 million in damages. In the Lakes
Region elevation is a major factor; those areas over 1,000’ in elevation were hit especially hard
during this event. The U.S. Army Corps of Engineers, Cold Regions Research and Engineering
Laboratory estimates a 40 – 90 year return period for an event with a uniform ice thickness of
between 0.75 and 1.25 inches. Ten years later (2008), however, New Hampshire was struck again by
another severe ice storm, this time damages cost $15 million.
3. Severe Wind
On average, six tornadoes touch down somewhere in New England each year. There is no way of
knowing where or when the next damaging tornado will strike as they are among the most
unpredictable weather phenomena. Downbursts are 10 times more likely to occur than tornadoes.
a) Hurricane
Hurricanes are severe tropical storms that have winds of at least 74 miles per hour. In the Lakes
Region they could produce heavy rain and strong winds that could cause flooding or damage
buildings, trees, power lines, and cars.4 Hurricanes are measured by the Saffir-Simpson Hurricane
Scale: a 1-5 rating based on a hurricane's intensity using wind speed as the determining factor with
Category 5 being the strongest. New Hampshire has not experienced a severe hurricane since 1938.
On September 21, 1938, a Category 3 hurricane claimed 13 lives in New Hampshire and many more
throughout New England. Official records at the Weather Bureau in Concord show sustained winds
of 56 miles per hour, but around the state, gusts around 100 miles per hour were reported, mostly
due to topographical acceleration. The Merrimack River rose nearly 11 feet above its flood stage, The
Hanover Gazette reported that in New Hampshire, 60,000 people were homeless and many areas were
without power. Damages were estimated at $22 million.5 Hurricane Bob, a Category 2 storm, in
1991, was declared a major federal disaster in New Hampshire and is recorded as a severe storm in
the state’s history.6
b) Tornado
Tornadoes are violent rotating storms that extend to the ground with winds that can reach 300 miles
per hour. They are produced from thunderstorms and can uproot trees and buildings. Tornados are
classified using the Fujita Scale ranging from the F0 up to the F6, based on wind speed (ranging
from 40 mph to over 300 mph) and physical damage. Since 1964 there have been 24 tornados
reported in the four counties represented in the Lakes Region, all have been F0, F1, or F2. In July
2008 an F2 tornado ran through five counties in New Hampshire and impacted Alton, Wolfeboro,
and Ossipee.
4 http://www.fema.gov/hazard/hurricane/hu_about.shtm, visited January 25, 2011.
5 http://www.nh.gov/safety/divisions/hsem/NaturalHazards/index.html, visited January 25, 2011.
6 http://www.fema.gov/news/event.fema?id=2118 visited January 25, 2011
LAKES REGION PLAN 2015-2020 Natural Hazards and Climate Change 10c) Downburst
According to the National Oceanic and Atmospheric Administration (NOAA), a downburst is a
strong downdraft, rotational in nature, which causes damaging winds on or near the ground. Winds
can exceed 130 mph.7 Downbursts fall into two categories based on their size:
- microbursts, which cover an area less than 2.5 miles in diameter, and
- macrobursts, which cover an area at least 2.5 miles in diameter.
Microbursts do occur in the Lakes Region; in 2012 one occurred in Tilton and one in Franklin.
There were no injuries but several homes and vehicles were damaged by downed trees.
4. Fire
a) Wildfire
A wildfire is defined as a fire in wooded, potentially remote areas that may endanger lives. Typically
wildfires in the northeast are small in size, although there is the potential for larger fires. New
Hampshire has about 500 wild land fires each year; most of these burn less than half an acre. Much
of the Lakes Region is forested and susceptible to fire. In 2012, 76 acres burned over a two-day
period in Hill. In the 1950s several thousand acres burned in Tuftonboro, Ossipee, and Effingham.
b) Conflagration
Conflagration is an extensive, destructive fire in a populated area that endangers lives and affects
multiple buildings. Historically, many New Hampshire towns were settled in areas near the
confluence of waterways in order to power the mills. Often the town centers were at a low point in
the topography, resulting in dense residential development on the steeper surrounding hillsides.
Hillsides provide a natural updraft that makes fire fighting more difficult. In particular, structural
fires spread more readily in hillside developments because burning buildings pre-heat the structures
that are situated above them.
Within the Lakes Region, the City of
Laconia was the site of one of the most
devastating conflagration to occur in the
State of New Hampshire. The 1903
Great Lakeport Fire consumed more than
100 homes, two churches, two factories, a
large mill, a power plant, and a fire
station. The town of Wolfeboro’s history
includes a small conflagration in the
winter of 1956.
The majority of structures in the region
Figure 8: April 12, 2009 – Alton Bay
are old, wood buildings, some of which
lack fire suppression systems. As such,
several town and city centers in the region are susceptible to conflagration. In April 2009 the Alton
Bay Christian Conference Center, a complex of seasonal cottages built closely together up a hillside
with limited vehicular access between buildings, caught fire, resulting in an 11-alarm fire that
destroyed more than 40 structures.
7Weather Glossary. National Oceanic and Atmospheric Administration,
http://www.weather.gov/glossary/index.php?letter=d, visited March 8, 2011.
LAKES REGION PLAN 2015-2020 Natural Hazards and Climate Change 115. Earthquake
An earthquake is a series of vibrations in the Earth’s crust induced by the abrupt rupture and
rebound of rocks in which elastic strain has been slowly accumulating. Earthquakes are commonly
measured using magnitude, or the amount of seismic energy released at the epicenter of the
earthquake. The Richter magnitude scale is a mathematical device used to compare the size of
earthquakes.
Figure 9 – Richter Table8
Magnitude Earthquake Effects
2.5 or less Usually not felt, but can be recorded by seismograph.
2.5 to 5.4 Often felt, but only causes minor damage.
5.5 to 6.0 Slight damage to buildings and other structures.
6.1 to 6.9 May cause a lot of damage in very populated areas.
7.0 to 7.9 Major earthquake. Serious damage.
8.0 or greater Great earthquake. Can totally destroy communities near the epicenter.
New Hampshire is considered to be in an area of moderate seismic activity with respect to other
regions of the country. This means the state could experience large (6.5-7.0 magnitude) earthquakes,
but they are not likely to occur as frequently as in a high hazard area like the Pacific coast. There is
the potential for earthquakes in the region to register 5.5 on the Richter Scale, causing slight damage
to buildings and structures. Due to the unique geology of New Hampshire, earthquake propagation
waves travel up to 40 times further than they
do in the western United States, possibly
enlarging the area of damage.8 The strongest
earthquakes to strike New Hampshire
occurred December 20 and 24, 1940 in the
town of Ossipee. Both earthquakes had a
magnitude of 5.5 and were felt over an area of
400,000 square miles.
On average, the Lakes Region experiences an
earthquake every two years, though these
earthquakes are mild and go mostly
undetected by people. Sanbornton and
Tamworth are identified as major epicenters
in the region.9 A search of the USGS
National Earthquake Information Center
database shows that since 1977 there have
been 15 earthquakes with a magnitude of at
least 3.0 within a 100 km (62 mi.) radius of
the region; the largest was magnitude 4.5.10 Figure 10: Areas where the October 16, 2012
earthquake was felt.
Two such earthquakes have occurred since
2006; a 3.4 event in 2010 centered in
8 http://www.nh.gov/safety/divisions/hsem/NaturalHazards/index.html visited February 8, 2011.
9 http://des.nh.gov/organization/commissioner/pip/factsheets/geo/documents/geo-3.pdf , pg. 3, visited January 25,
2011.
10 USGS. http://earthquake.usgs.gov/earthquakes/eqarchives/epic/, Accessed August 2, 2012
LAKES REGION PLAN 2015-2020 Natural Hazards and Climate Change 12Penacook, NH and a 4.0 quake in southern Maine shook the region on October 16, 2012. 11
6. Health Hazards
There are several other natural hazards that can impact the health and welfare of Lakes Region.
Elements such as arsenic and radon are naturally found in some of our bedrock and can be released
over time, seeping in to water wells or building up in the air of underground rooms such as
basements. Both are colorless, odorless gasses; the only way of detecting their presence is through
testing.
Wells drilled into New Hampshire’s bedrock fractures
have about a 1 in 5 probability of containing naturally
occurring arsenic above 10 parts per billion, the
threshold set by the US Environmental Protection
Agency (EPA) in 2001. Prolonged exposure to levels
above this threshold is associated with increased risk of
cancer and other non-cancerous effects.12
Radon is a naturally occurring colorless, odorless
radioactive gas usually associated with granite rock
formations. The gas can seep into basements through
the air or be transported via water and released once the
water is aerated, such as during a shower. Extended
exposure to radon can lead to higher rates of cancer in
humans. Radon is not a singular event; it can take years
or decades to see the effects. The NH Office of
Community and Public Health’s Bureau of Radiological
Health indicates that one third of homes in New
Hampshire have indoor radon levels that exceed the US Figure 11 - Radon by Municipality
Environmental Protection Agency’s “action level” of 4
pCi/l..13,14
B. Potential Impacts
1. People
On August 4, 2008, rain events caused substantial flash flooding and washouts in Ashland, New
Hampton, Center Harbor, and Meredith. In addition to property damages, a young girl died in
Ashland as a result of this storm.15 Intense winds and ice or heavy, wet snow can result in downed
trees, limbs, and wires blocking road access and cutting power to neighborhoods and entire
communities. Actions that can reduce the likelihood or impacts due to these hazards include regular
tree maintenance programs, underground wires, and limiting the number of single-access roads.
Communities can also identify and publicize cooling centers and shelters with heat. Many Lakes
Region communities have also publicized through brochures, at meetings, and on municipal
11 USGS, Earthquake Archive Search. http://earthquake.usgs.gov/earthquakes/search/ accessed August 8, 2013
12 NH DES, Arsenic Information. http://des.nh.gov/organization/divisions/water/dwgb/capacity/arsenic.htm
accessed April 10, 2014.
13 http://www.nh.gov/safety/divisions/hsem/NaturalHazards/index.html visited February 8, 2011.
14 NH DES Radon Program http://des.nh.gov/organization/divisions/air/pehb/ehs/radon/index.htm, accessed
October 9, 2012.
15 USAToday http://usatoday30.usatoday.com/news/nation/2008-08-08-596728286_x.htm.
LAKES REGION PLAN 2015-2020 Natural Hazards and Climate Change 13websites what those who need power for medical equipment should do in the event of a temporary
power outage.
2. Structures
Flat-roofed buildings are particularly susceptible to damage from snow and ice loads. Enforcement
of state and local building codes and reminding owners of the benefits to keeping the roof cleared
can reduce occurrences of roof-collapse. Older buildings constructed of masonry are quite rigid and
susceptible to damage in a strong earthquake.
Buildings in floodplains and floodways are susceptible to damage. More than 800 properties in the
Lakes Region are insured under the National Flood Insurance Program (NFIP); still more may be
covered by private insurers. Since the mid-1970s, 380 losses have been paid through this program,
totaling $2.8 million. One-third of these payments have been on repetitive losses. Ensuring that
floodplain ordinances are up to date and followed through on code enforcement can reduce the
susceptibility of new structures to flooding. Working with owners of existing structures that are in
the floodplain, especially those that have had repetitive losses to elevate, flood-proof, or even move
these structures out of the floodplain can reduce the risk of loss.
3. Infrastructure
A relatively large earthquake would impact roads and bridges, potentially limiting the ability of
emergency services to be rendered. Rushing water causes erosion and can result in road washouts.
Implementing workable stormwater management regulations and road and driveway standards,
limiting construction on steep slopes,
and planning for more intense storm
events in stormwater calculations can
all help to reduce damages to roads,
bridges, culverts, and other drainage
infrastructure.
When electrical wires come down
during wind or ice storms, many
people throughout the state and region
can be affected. As more sectors of
the region’s economy,
communications systems, and
emergency response services rely on
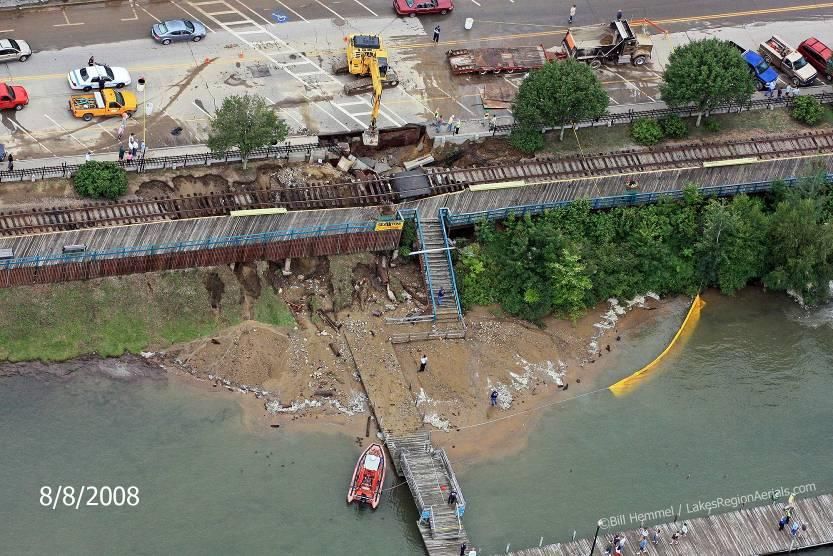
internet connectivity, ensuring the Figure 12: Washout at Weirs Beach, Laconia – 2008
reliability of this transmission
infrastructure gains importance. In some areas protection simply involves limiting the likelihood
that limbs and trees will come down on wires, other cases it may be more be more technological in
nature. Due to the configuration of transmission networks, even events beyond the boundaries of
this region can impact local power supplies.
LAKES REGION PLAN 2015-2020 Natural Hazards and Climate Change 14II. FACTORS AFFECTING HAZARDS AND IMPACTS
Numerous factors may affect natural hazards and the impact that they have upon a region. Some
affect the hazards themselves; for example, a change in climate may result in changes in the
frequency of severity of a particular type of hazard event. Factors such as where development
occurs or the type of construction can reduce the impact that an event may have on homes,
businesses, infrastructure, and individuals.
A. Climate Changes (past, present, and future)
1. Weather, Climate, Hazards
Weather is the hourly and daily changes in local conditions such as temperature, precipitation,
humidity, and wind. Climate is the 30-year average of these indicators. Many of the hazards
discussed in this chapter are either weather events such as severe wind or ice storms or they are
often linked to weather events, as in flooding. Thus, changes in climate will likely have an affect on
some of the hazards impacting the region. As communities consider how best to protect people,
infrastructure, and properties from hazards, it would be prudent for them to consider these
anticipated changes in the region’s climate.
An extensive review of climate data in New Hampshire was conducted by the Earth Systems
Research Center at the University of New Hampshire’s Institute for the Study of Earth, Oceans, and
Space. This work produced two reports, one for southern NH and one for northern NH; much of
the information in this section is based on that analysis. The Lakes Region is considered as part of
southern NH with the northern reaches of the region, Tamworth, Sandwich, and Holderness
overlapping into northern NH. This study reviewed weather records from 1895 through 2012.
They explored trends over the past century; identifying increases in some temperatures and increases
in the number of heavy precipitation events since 1970.
2. Temperature
Southern New Hampshire has grown warmer over the
past century; most locations showed consistent long-
term increases in both minimum and maximum
temperatures. In most cases this increase was detected
throughout the year. The greatest increase was found in
the nighttime minimum temperatures, especially during
the winter. Much of that warming has occurred since
1970, with four to five fewer “cold days” (less than 32F)
per decade.
Figure 13: Number of very heavy (>4” in 48
3. Precipitation hrs.) precipitation events per decade
There has been a modest increase in the amount of
precipitation falling on the region over the past century and the rate of increase has been greater
since 1970. The noticeable change in precipitation is the manner in which it occurs. The number of
very heavy precipitation events, those producing over four inches of precipitation in a 48-hour
period, has shown at least a four-fold increase since 196016.
16Wake, C., et.al. (2014). Climate Change in Southern New Hampshire: Past, Present, Future. Online at
http://climatesolutionsne.org/sites/climatesolutionsne.org/files/2014_southernnh_climate_assessment_unhsi_csne_gsf
.pdf.
LAKES REGION PLAN 2015-2020 Natural Hazards and Climate Change 154. Snow Cover and Ice Out
Changes in ice-out dates are frequently used as an indicator of winter/early spring climate changes as
the date closely correlates with surface air temperatures in the months prior to the breakup of the
ice. Overall, ice-out dates have been occurring earlier over the past 115 years and, since 1970, about
a week earlier. The number of snow-covered days (one or more inches of snow on the ground) has
been decreasing by about two days per decade since 1970.
5. Additional Climate Change Indicators
The length of the growing season in southern New Hampshire has increased by 6-10 days per
decade since 1960. In 2012 the US Department of Agriculture (USDA) revised its plant hardiness
maps to show that most of the Lakes Region had shifted from Zones 4b and 5a to a mix of Zones
5a and 5b, representing a 5F increase in minimum winter temperature (Figures 14a and b). It also
has increased the likelihood of increased heat stress, inadequate winter chill period (time below
freezing required by many fruit trees), and increased pressure from invasive species.
Figure 14a and 14b. USDA plant hardiness zones prior to 2012 (left) and after 2012 (right). From
http://www.growing-herbs.com/zones/new_hampshire.html.
B. Future Climate Change
Using multiple models Wake, et al. (2013) modeled two separate scenarios for future climate
conditions in New Hampshire based on a high and a low level of global output of heat-trapping
emissions such as carbon dioxide, ozone, and methane. The models rely upon multiple variables
including energy usage, fuel types, and advances in technology. Our current pattern is projected to
result in an outcome similar to the high emissions model. From these models, both near term (2010
– 2039) and long-term (2070 – 2099), projections were made.
1. Temperature
In the short term, temperature is projected to rise 2F regardless of whether low emissions or high
emissions are produced. However, in the long-term there is a difference as the low emissions
LAKES REGION PLAN 2015-2020 Natural Hazards and Climate Change 16scenario produces a 4F increase and the high emissions scenario results in an 8-9F increase. The
projected number of days above 90F in southern New Hampshire will rise from less than ten per
year to 20 days by the end of the century with a low emissions scenario and more than 50 days per
year in a high emissions scenario. From 1980-2009 southern New Hampshire experienced an
average of 164 nights where the temperature dropped below 32F; under the low emissions scenario
this would drop to 144 days by the end of the century and 120 under the high emissions scenario.
2. Precipitation
Annual precipitation is projected to increase 17-20 percent by the end of the century under both
emissions scenarios. The Lakes Region can expect to experience more extreme precipitation events
in the high emissions scenario. From 1980-2009 there were an average of 4.3 very heavy
precipitation events per decade under the low emissions scenario; we can expect ten such events per
decade, while under the high emissions scenario we will likely see twelve very heavy precipitation
events each decade by the end of the century.
3. Snow Cover
The models project that there will be a 20 percent decrease in snow covered days by the end of the
century under low emissions (89-95 days) and 50 percent decrease under high emissions (52 days).
4. Other
The growing season is projected to increase by 20 days under low emissions scenario and 49 days
under high emissions by the end of the century. Impacts will likely be lower crop yields due to heat
stress and fewer chilling days and increased pressures from invasive species.
C. Development Activity
1. Floodplains
All Lakes Region communities have a floodplain ordinance, which regulates development in the
floodplain. These ordinances require that structures in the floodplain meet certain standards such as
raising the lowest floor of the building above the highest level that water is expected to reach and
ensuring that mobile homes are securely tied down. A floodplain ordinance also requires that the
community take active steps to enforce the standards and maintain records. In return for adoption
and implementation of an ordinance, property owners are eligible to purchase flood insurance
through the NFIP.
In recent years changes have been made to the program to make it operate more effectively in an
effort to reduce damages, get rate-payers to bear more of the program costs, and better reflect the
current and anticipated changes in flood levels.
New Hampshire’s Shoreland Water Quality Protection Act (RSA 483B) provides minimum
standards for all public waters in the state regarding use of the land within 250’ of the shore. The
intent of this law is to protect not only the environment and natural resources but also to protect
buildings and land from flooding and erosion. Many activities within the protected shoreland
require a permit from NH DES. Local planning boards should be familiar with this law and how it
may impact their review and approval of projects. Municipalities may adopt stricter standards if they
wish.
LAKES REGION PLAN 2015-2020 Natural Hazards and Climate Change 17Another method of restricting development on land that is prone to flooding is to either place the
land in conservation or purchase the land development rights. When the Franklin Falls dam was
built, some land upstream of the dam was placed under control of the US Army Corps of Engineers;
most of it is available to the public for recreational use.
2. Hillsides and Ridges
About thirty percent of the land in the Lakes Region has a slope of at least 15% and more than a
third has a slope of 25% or more. While construction on steep slopes may be feasible, it is not
advisable due to concerns about erosion from the construction site, road, and driveway both during
and after construction. Accessibility by emergency vehicles can be a concern. Many Lakes Region
communities have steep slopes ordinances as well as road and driveway standards to guide
development in a manner that will limit the potential damage to the land, property, and
infrastructure due to erosion.
D. Changing Demographics
The average age of Lakes Region residents is higher than the rest of the state. Approximately 20
percent of the population of Belknap and Carroll Counties is over 65 years old, twice the figure for
the entire state.17 Communities need to plan for an aging population and have the capacity to
address the needs of this demographic, especially in conjunction with hazard events. The
implications for communities include addressing the special needs of this population when power
supplies are compromised, such as those needing oxygen, heating and cooling the elderly population,
and providing a means of transport.
III. BARRIERS & OPPORTUNITIES
A. Mitigation
To help the Lakes Region become as resilient as possible to hazards in both the short- and long-
term, actions can be taken to both mitigate the hazards (reduce the likelihood of the hazard
occurring) and mitigate the impacts of the hazards on people, structures, infrastructure, and
businesses (sometimes referred to as “adaptation”).
B. Current Planning
All communities in the region have hazard mitigation plans and local emergency operations plans.
Each community has a locally adopted master plan, which sets down the best and most appropriate
future development of the area and to aid the planning board in designing ordinances. The master
plan must have a vision and a land use section and under section NH RSA 674:2 III (e) the
community may also include, “a natural hazards section which documents the physical
characteristics, severity, frequency, and extent of any potential natural hazards to the community. It
should identify those elements of the built environment at risk from natural hazards as well as extent
of current and future vulnerability that may result from current zoning and development policies.”
Some communities have adopted their hazard mitigation plan by reference as the natural hazards
section of their master plan.
Sixty percent of the communities in the Lakes Region have developed a Water Resources Plan for
Rural Fire Protection, which involved inventorying and mapping cisterns, fire ponds, dry hydrants,
assessing protection levels, identifying gaps, and making recommendations for rural firefighting
17 NH Office of Energy and Planning, Census 2010 http://www.nh.gov/oep/data-center/census/index.htm
LAKES REGION PLAN 2015-2020 Natural Hazards and Climate Change 18sources. These were developed by North Country Resource and Development Commission. All
communities are covered by one of five regional public health networks, which help coordinate
health care preparedness in the event of a disaster http://nhphn.org/.
As noted earlier, all communities participate in the National Flood Insurance Program and have
some level of floodplain ordinance. Digital floodplain maps were produced by FEMA for
Merrimack, Grafton, and Carroll Counties in the last ten years, providing a convenient and precise
mapping layer as well as the opportunity for communities and individuals to review and comment
on the floodplain boundaries; however, Belknap County communities are still working with the
paper maps drawn in the 1970s and 1980s due to funding limitations at FEMA and a shift in
priorities to coastal mapping.
Neighborhood Action
A number of communities in the region have Not all planning and mitigation efforts
implemented steep slopes ordinances, limiting need to start with the municipality.
development in areas that are prone to erosion. The Chocorua Ski & Beach Club
Likewise many communities have road standards, for Association in Tamworth is an
some these include private roads and driveways. While example of a neighborhood taking
having such standards does add to the cost of action to mitigate the likelihood of
development, some of those costs may be recouped wildfire damaging their homes.
over the long term in the form of reduced road
maintenance costs and depreciation. These standards The Ski & Beach Club is home to 190
are important for emergency vehicles being able to residents. The development sits in the
access the property. Ossipee Pine Barrens, which is
particularly susceptible to wildfire.
C. Awareness/Communication Several wildfires burned more than
As noted in the beginning of this chapter, weather 1,000 acres each in this area in the
forecasting and reporting has improved greatly over the 1950s.
past several decades. Residents and visitors have
numerous media outlets for reports on impending The Chocorua Ski & Beach Club
natural hazard events. Likewise there are multiple Association has been recognized as a
media outlets for finding out about local conditions and Firewise Community site since 2007.
resources. Most Lakes Region communities post By adhering to their Best Management
official alerts on their municipal webpage and many can Practices the residents of this
contact residents and businesses through an alert development are safer and more aware
program such as Reverse 911, Code Red, or of the wildfire risks.
Everbridge, which enable public safety officials to http://www.firewise.org/
notify residents of hazardous situations.
More communities in the region are reaching out to provide access to informational materials to
help people in the region be prepared for hazards at town halls, public libraries, and on websites.
Some provide workshops for residents and businesses.
D. Funding
Taking action to reduce the likelihood that a hazard event will impact people, structures and
infrastructure, and businesses throughout the region usually does involve a cost. FEMA has
calculated that each dollar spent on prevention can save four dollars spent on recovery. Education
and outreach are often relatively low cost efforts; likewise ordinances and regulations are usually
fairly inexpensive to create and adopt but may place additional costs on residents, developers, and
LAKES REGION PLAN 2015-2020 Natural Hazards and Climate Change 19businesses. Infrastructure projects usually have a high cost to the community. In all cases there
needs to be a consideration of the short- and long-term costs with the associated benefits.
For some actions, assistance with funding is available from sources such as FEMA, Community
Development Block Grant (CDBG), US Department of Agriculture (USDA), and Economic
Development Administration (EDA). Matching funds and a benefit-cost analysis are required for
most programs.
E. Collaboration
All Lakes Region communities are served by regional hazmat teams. Fire and police departments
throughout the region have mutual aid agreements with nearby communities which facilitate the
giving and receiving of assistance in an emergency. Some of the region’s public works departments
have similar arrangements coordinated through UNH Technology Transfer
(http://www.t2.unh.edu/ma).
IV. GOALS, OBJECTIVES, ACTIONS
A. Planning
1. Continue to work with communities and FEMA to update local hazard
mitigation plans
2. Provide GIS mapping assistance to communities, including HAZUS
mapping to help analyze risks from hazards
3. Assist communities in mapping, inventorying, and assessing infrastructure
4. Provide planning and mapping support to communities through the Fluvial
Erosion Hazard program to identify areas most susceptible to riverine
erosion
5. Promote planning efforts that reduce the likelihood of impact due to
flooding, including:
a) development of accurate, up-to-date floodplain mapping (FEMA),
especially in Belknap County
b) implementation of floodplain ordinances to reduce development in
the floodplain
c) development and implementation of stormwater and steep slopes
ordinances/regulations along with road and driveway standards to
reduce the likelihood of erosion
d) use of drainage infrastructure (culverts, bridges, ditches) with the
capacity to accommodate very heavy precipitation events
e) encourage regular inspections and communication between dam
owners, NH Department of Environmental Services, and
communities both up- and downstream regarding maintenance and
flow.
6. Promote the development of tree maintenance programs both public and
private to the reduce the likelihood that trees and limbs will damage
infrastructure and property during wind and ice events
7. Promote planning efforts that reduce the likelihood of impact on homes,
businesses, and people due to fire, including implementation of many of the
FireWise principles
8. Encourage the adoption and implementation of the state building code,
which includes structural protections against seismic events
LAKES REGION PLAN 2015-2020 Natural Hazards and Climate Change 209. Promote planning efforts that reduce the likelihood of impact to the region
due to health hazards
a) promote home water monitoring for substances such as arsenic and
radon
b) encourage coordination between communities, stakeholders, and
regional health networks
10. Encourage efforts to identify and remedy any “choke points” in the regional
energy infrastructure system.
B. Mitigation
1. Explore opportunities for funding of projects that have regional importance
through FEMA and other entities
2. Where appropriate, facilitate the purchase and removal of flood-prone
structures
3. Encourage energy use practices that result in a lower carbon emissions
C. Education, Outreach
1. Provide opportunities for local decision-makers to learn more about state
and national hazard planning efforts and opportunities. Topics might include
- FEMA grant programs & other funding opportunities
- NHDES dam bureau
- Floodplain mapping & Flood Insurance program
- Anticipated impacts of climate change on hazards
V. RESOURCES
Program Comment website
National Oceanic and Weather information http://www.noaa.gov/
Atmospheric
Administration (NOAA)
NOAA: Storm Events Searchable database of storm events http://www.ncdc.noaa.gov/stormeve
Database nts/
US Geological Survey Water Searchable database for stream http://waterdata.usgs.gov/nh/nwis
Data for New Hampshire gauges/water levels, historical and
real-time
FEMA Home Page Information about disaster http://www.fema.gov/
preparation, mitigation, and resources
FEMA Map Service Center FEMA Flood Maps https://msc.fema.gov/webapp/wcs/
stores/servlet/FemaWelcomeView?st
oreId=10001&catalogId=10001&lang
Id=-1
FireWise Communities Program for homeowners and http://www.firewise.org/
communities to help make property
resistant to wildfire
Fire Adapted Communities Build fire resiliency into a community http://www.fireadapted.org/
LAKES REGION PLAN 2015-2020 Natural Hazards and Climate Change 21Program Comment website
New Hampshire Division of Information about fires and fire http://www.nhdfl.org/fire-
Forests and Lands - Fire prevention in New Hampshire control-and-law-enforcement/fire-
Prevention, prevention.aspx
US Geological Survey – Information about earthquakes, http://earthquake.usgs.gov/
Earthquake Hazards including a searchable database
Program
NH Department of Information about arsenic, testing http://des.nh.gov/organization/di
Environmental Services programs, and treatment options visions/water/dwgb/capacity/arse
Arsenic Information nic.htm
New Hampshire Public An overview of the network and links http://nhphn.org/
Health Networks to regional networks
NH NRCS Watershed A variety of planning and protection http://www.nrcs.usda.gov/wps/p
Protection Programs programs. ortal/nrcs/main/nh/programs/pl
anning/
New Hampshire Homeland Home page – Information about http://www.nh.gov/safety/divisio
Security and Emergency planning, training, mitigation, ns/hsem/index.html
Management recovery, and funding
New Hampshire Homeland Listing of various planning, mitigation http://www.nh.gov/safety/divisio
Security and Emergency programs and documents ns/hsem/HazardMitigation/hmgp
Management, Hazard .html
Mitigation Grant Program
Adaptation Toolkit for A thorough resource for communities http://des.nh.gov/organization/di
Municipalities to help in planning for climate change visions/air/tsb/tps/climate/toolki
from basic information to t/index.htm
assessments, implementation and
funding options.
Climate Change in Southern A comprehensive review of data http://climatesolutionsne.org/site
New Hampshire: Past, regarding past changes in New s/climatesolutionsne.org/files/201
Present, Future Hampshire’s climate, review of 4_southernnh_climate_assessment
impacts, and modeling of future _unhsi_csne_gsf.pdf
scenarios – south of the Sandwich
Range
Climate Change in Northern A comprehensive review of data http://climatesolutionsne.org/site
New Hampshire: Past, regarding past changes in New s/climatesolutionsne.org/files/201
Present, Future Hampshire’s climate, review of 4_northernnh_climate_assessment
impacts, and modeling of future _unhsi_csne_gsf.pdf
scenarios – Sandwich Range north
National Climatic Data Source for data, maps, and reports on http://www.ncdc.noaa.gov/
Center climate information
US Environmental Information about the impacts of http://www.epa.gov/
Protection Agency: Climate climate change on various aspects of climatechange/impacts-
Change Impacts the environment and economy in the adaptation/northeast.html
Northeast
LAKES REGION PLAN 2015-2020 Natural Hazards and Climate Change 22(this page left intentionally blank) LAKES REGION PLAN 2015-2020 Natural Hazards and Climate Change 23
You can also read