HAZARD AND RISK IN THE HAWKESBURY-NEPEAN VALLEY - Annex A Supporting document NSW SES Response Arrangements for - Emergency NSW
←
→
Page content transcription
If your browser does not render page correctly, please read the page content below
HAZARD AND RISK IN THE
 HAWKESBURY-NEPEAN
       VALLEY
                        Annex A
  Supporting document (NSW SES Response Arrangements for
Hawkesbury-Nepean Valley) to the Hawkesbury-Nepean Flood Plan
                     Last Update: June 2020
Hawkesbury-Nepean Valley Flood Plan Version 2020-0.11

                                                                  CONTENTS
CONTENTS ....................................................................................................................................................... 1

LIST OF MAPS................................................................................................................................................... 2

LIST OF FIGURES............................................................................................................................................... 2

LIST OF TABLES ................................................................................................................................................ 2

VERSION LIST ................................................................................................................................................... 3

AMENDMENT LIST ........................................................................................................................................... 3

PART 1                THE FLOOD THREAT ................................................................................................................. 4

PART 2                EFFECTS OF FLOODING ON THE COMMUNITY ........................................................................ 25

                             Flood Islands ........................................................................................................................ 25
                             Low Flood Island................................................................................................................... 26
                             Trapped Perimeters .............................................................................................................. 26
                             High Trapped Perimeters ..................................................................................................... 26
                             Low Trapped Perimeters ...................................................................................................... 26
                             Areas with Overland Escape Routes ..................................................................................... 27
                             Areas with Rising Road Access ............................................................................................. 27
                             Indirectly Affected Areas ...................................................................................................... 27

LIST OF REFERENCES ...................................................................................................................................... 41

                                          Annex A Hazard and Risk in Hawkesbury-Nepean Valley                                                          Page 1
Hawkesbury-Nepean Valley Flood Plan Version 2020-0.11

                                                               LIST OF MAPS
Map 1: Hawkesbury-Nepean River Basin (212 in the AWRC classification) ........................................................... 5
Map 2: Floodplains in the Hawkesbury-Nepean Valley .......................................................................................... 7
Map 3: Wallacia Floodplain .................................................................................................................................... 8
Map 4: Penrith / Emu Plains / Castlereagh Floodplain ........................................................................................... 9
Map 5: Richmond/ Windsor / Wilberforce Floodplain ......................................................................................... 10
Map 6: Lower Hawkesbury Floodplain ................................................................................................................. 11

                                                           LIST OF FIGURES
Figure 1: Sub-catchment contributions to flooding at Windsor from recent floods ............................................ 13
Figure 2: Seasonality of Hawkesbury-Nepean floods ........................................................................................... 14
Figure 3: The 'bathtub effect’ caused by some of the natural choke points in the Hawkesbury-Nepean Valley. 17
Figure 4: Comparison of the differences in flood levels and flood risk between the Hawkesbury-Nepean River
         and other floodplains ............................................................................................................................. 17
Figure 5: Hawkesbury-Nepean Flood History showing Major Floods at or above 12.2m at Windsor.................. 21
Figure 6: High Flood Island ................................................................................................................................... 26
Figure 7: Low Flood Island .................................................................................................................................... 26
Figure 8: High Trapped Perimeter ........................................................................................................................ 26
Figure 9: Low Trapped Perimeter ......................................................................................................................... 26
Figure 10: Area with Overland Escape Route ....................................................................................................... 27
Figure 11: Area with Rising Road Access .............................................................................................................. 27
Figure 12: Indirectly affected area........................................................................................................................ 27
Figure 13: Estimates of the residential properties affected by flooding in the Hawkesbury-Nepean Valley
         dependant on flood size (Source: HNV Strategy Database, January 2020) ............................................ 33

                                                             LIST OF TABLES
Table 1: Indicative Flow Travel Times for the Hawkesbury-Nepean River ........................................................... 16
Table 2: Hawkesbury-Nepean flood levels for different probabilities at various flood warning gauges ............. 23
Table 3: The main Hawkesbury-Nepean flood risk areas and the heights at which they are expected to be flood
         affected in the Richmond Windsor Floodplain ....................................................................................... 28
Table 4: The main Hawkesbury-Nepean flood risk areas and the heights at which they are expected to be flood
         affected in other areas ........................................................................................................................... 29
Table 5: Estimated number of properties and people affected by flooding in the Hawkesbury-Nepean
         floodplain................................................................................................................................................ 31
Table 6: Estimated number of residential properties flooded by Local Government Area .................................. 32
Table 7: Summary of Utilities and Infrastructure Consequences Windsor / Wilberforce Floodplain .................. 38
Table 8: Summary of Utility and Infrastructure Consequences Penrith / Castlereagh Floodplain ....................... 39

                                           Annex A Hazard and Risk in Hawkesbury-Nepean Valley                                                         Page 2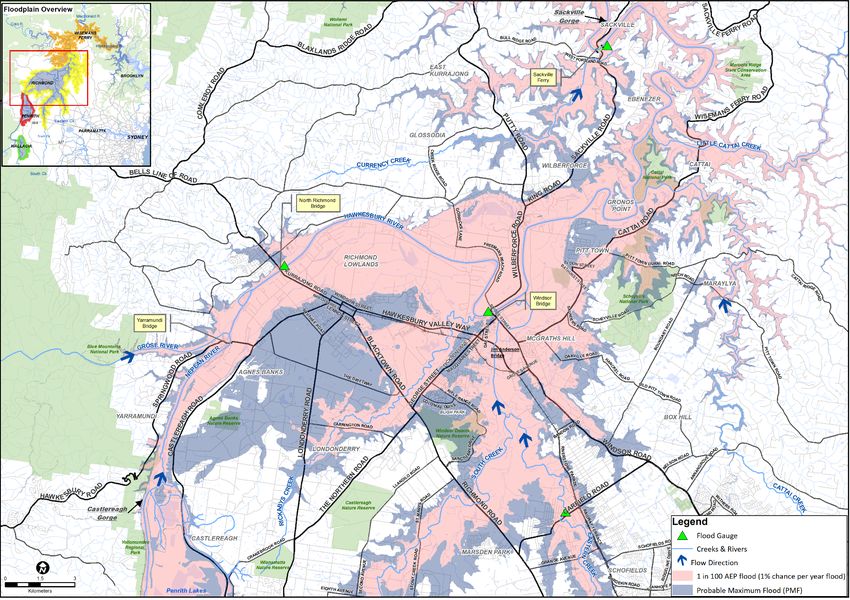
Hawkesbury-Nepean Valley Flood Plan Version 2020-0.11

                                         VERSION LIST
The following table lists all previously versions of this Annex.

 Description                                                                     Date

 September 2013 as amended June 2014                                      June 2014

 September 2015 update                                                    Sep 2015

                                    AMENDMENT LIST
Suggestions for amendments to this Annex should be forwarded to:

Deputy Commissioner Operations
NSW State Emergency Service
PO Box 6126, 93-99 Burrelli St, Wollongong NSW 2500

Amendments promulgated in the amendments list below have been entered in this Annex.

 Amendment       Description                                       Updated by     Date
 Number

                           Annex A Hazard and Risk in Hawkesbury-Nepean Valley           Page 3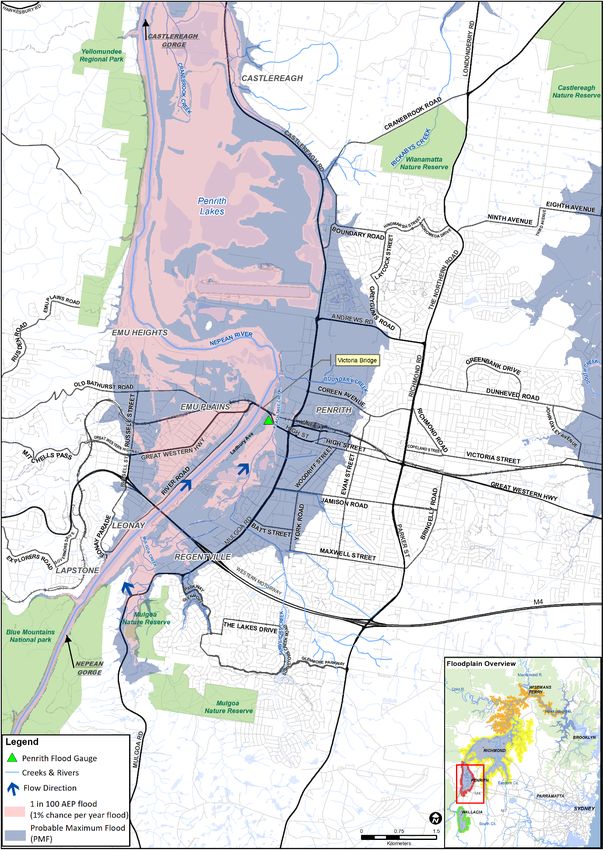
Hawkesbury-Nepean Valley Flood Plan Version 2020-0.11

PART 1 THE FLOOD THREAT                               The Hawkesbury River flows generally North
                                                      east from Yarramundi through the main urban
                                                      and agricultural areas of Richmond and
       LANDFORMS AND RIVER SYSTEMS                    Windsor. It continues through rugged
The Hawkesbury-Nepean catchment is around             sandstone gorge country before discharging
21,400 square kilometres in size stretching           into the ocean at Broken Bay.
from Goulburn in the south almost to Singleton        The Wollondilly River originates in farm land
in the north-west.                                    near Goulburn and is fed by smaller tributaries
The Hawkesbury-Nepean River is around 470             including the Nattai and Wingecarribee Rivers.
kilometers long. It flows generally in a north        The Wollondilly River flows through Sydney’s
easterly direction from its source near               water supply catchment area into the
Goulburn, until eventually discharging into the       Warragamba River which in turn flows into
Pacific Ocean north of Sydney at Broken Bay.          Lake Burragorang. This lake is formed by the
                                                      Warragamba Dam. Water that is discharged
The Hawkesbury and Nepean rivers are
                                                      through the dam flows into the Warragamba
actually the same river with the Nepean
                                                      River which joins the Nepean River below
forming the upstream portion, and the
                                                      Warragamba Dam.
Hawkesbury the lower half. There are a
number of other large rivers and creeks that          The Coxs River originates to the west of the
flow into the Hawkesbury-Nepean River                 Blue Mountains near the Capertee Valley. It
system. The major ones include the:                   flows in a south easterly direction, initially
                                                      through farmland, then through rugged
   •   Wollondilly River
                                                      bushland valleys to the south of Blue
   •   Coxs River                                     Mountains townships. It eventually flows into
                                                      Lake Burragorang.
   •    Grose River
                                                      The Warragamba River starts downstream of
   •    South Creek                                   Warragamba Dam and joins the Nepean River
   •    Colo River and                                3.5 kilometres below Warragamba Dam. The
                                                      Warragamba catchment is 9,051 square
   •    Macdonald River
                                                      kilometres and makes up about 80% of the
MAP 1 shows an overview of the Hawkesbury-            catchment to Penrith and 70% to Windsor.
Nepean Valley from Bents Basin to Broken Bay          Most of the time only small environmental
– the area covered by the Hawkesbury-Nepean           releases are made from the Warragamba Dam
Flood Plan. The area along the Nepean River           to the Warragamba River, but the flows can be
upstream of Bents Basin, is covered by the            very large when the dam spills.
Upper Nepean Flood Plan.
                                                      The Grose River originates in the Blue
                                                      Mountains and travels east through rugged
Major Rivers                                          World Heritage Area before joining the Nepean
The Nepean River has its origins in the rugged        River at Yarramundi near Richmond. Its
high rainfall area of the Illawarra escarpment.       catchment of 650 square kilometres is a
It is fed by smaller tributaries including the        relatively small part of the total catchment and
Avon, Cataract and Cordeaux rivers. The               can contribute to fast rising level at North
Warragamba River joins the Nepean River just          Richmond.
downstream of Wallacia. It continues north            South Creek joins the Hawkesbury River at
along the base of the Blue Mountains through          Windsor. South Creek drains a 640 square
the open plains of Emu Plains and Penrith until       kilometre catchment in Western Sydney. It has
it reaches the junction with the Grose River at       its headwaters near Narellan and generally
Yarramundi. At this point it becomes known as         flows in a northerly direction. This catchment
the Hawkesbury River.                                 contains large urbanised areas and the site of
                                                      Western Sydney Airport. Ropes and Kemps

                           Annex A Hazard and Risk in Hawkesbury-Nepean Valley              Page 4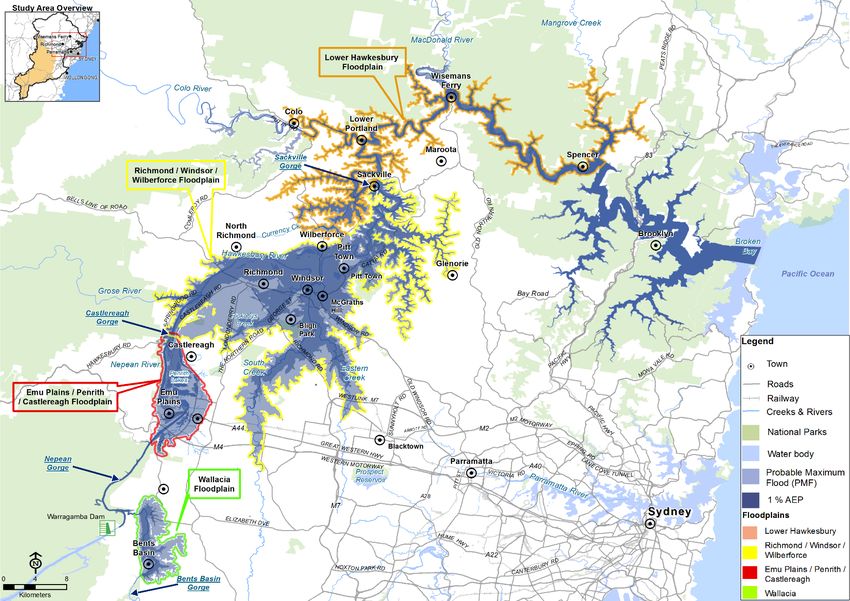
Hawkesbury-Nepean Valley Flood Plan Version 2020-0.11

Creek are major tributaries of South Creek.            Windsor   where      the    landscape    is
Eastern, Ropes and Kemps creeks are major              predominantly steep vegetated sandstone hill
tributaries of South Creek (1).                        slopes.
The South Creek catchment receives                     The Macdonald River originates in rugged
comparatively less rainfall than the Grose River       bushland at the northern end of the
(2).                                                   catchment. It drains an area of about 1,910
                                                       square kilometres. The Macdonald River joins
The Colo River originates in the Blue
                                                       the Hawkesbury River near Wisemans Ferry,
Mountains and consists of predominantly
                                                       where the river is surrounded by steep
natural rugged bushland areas. It drains an
                                                       vegetated sandstone hill slopes (3).
area of 4,640 square kilometres. The Colo River
joins the Hawkesbury River downstream of the
main urban areas around Richmond and

                 Map 1: Hawkesbury-Nepean River Basin (212 in the AWRC classification)

                           Annex A Hazard and Risk in Hawkesbury-Nepean Valley            Page 5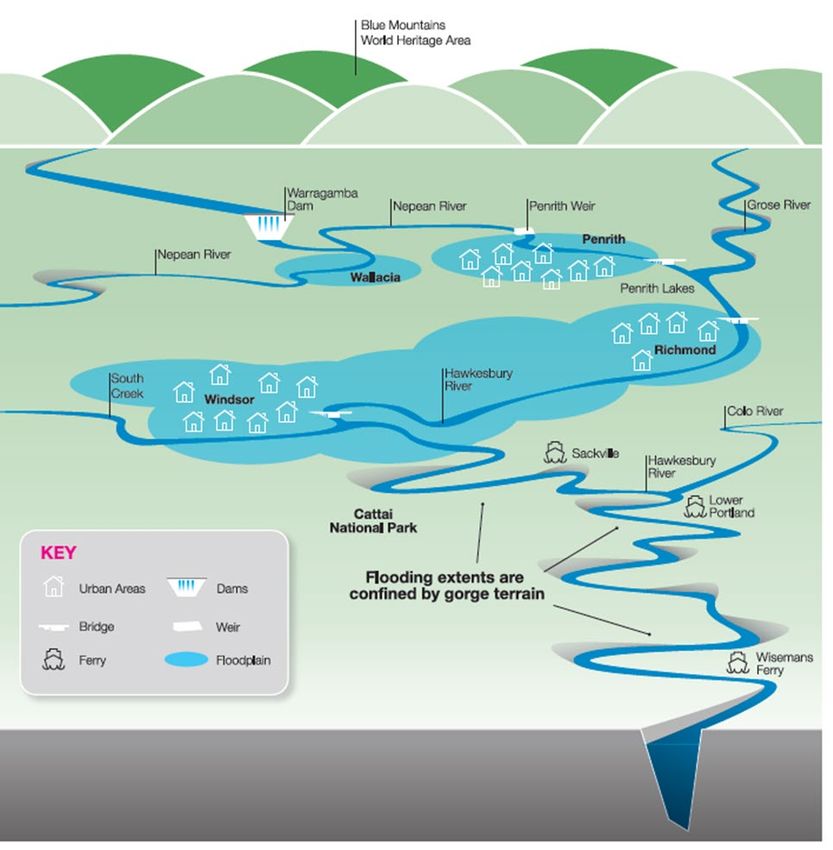
Hawkesbury-Nepean Valley Flood Plan Version 2020-0.11

Floodplains and Gorges                                 Penrith / Emu Plains / Castlereagh
Floodplains are areas of land beside rivers that       Floodplain
can be inundated by floodwaters up to the              From Emu Plains to Castlereagh there is
largest possible flood extent. They are                another slightly larger floodplain located
normally reasonably flat fertile areas that are        within the Penrith local government area.
made up by the sediments that have been
                                                       This floodplain extends into Emu Plains and
deposited during past flood events.
                                                       Leonay on the western side of the river to the
Whilst flooding is a natural process bringing          foothills of the Blue Mountains (refer to Maps
with it many benefits, floods can have                 2 and 4).
significant impacts on people living and
                                                       On the eastern side of the river the floodplain
working on these floodplains, their property
                                                       extends into parts of the Penrith, and the
and infrastructure.
                                                       Penrith Lakes area before constricting again
Within the Hawkesbury-Nepean Valley the                near Castlereagh through the Castlereagh
major flood risk areas are located on the              Gorge (4).
floodplains and tributaries between Wallacia
and Spencer. There are four main identifiable          Richmond / Windsor / Wilberforce
floodplains within this Hawkesbury-Nepean              Floodplain
Valley area. These are the:
                                                       Downstream of the Castlereagh Gorge the
    •   Wallacia Floodplain;                           River enters a distinct basin extending from
    •   Penrith / Emu Plains / Castlereagh             North Richmond to Wilberforce. This is the
        Floodplain;                                    largest of the floodplains covering parts of the
                                                       Penrith, Hawkesbury, Blacktown and The Hills
    •   Richmond / Windsor / Wilberforce               local government areas (refer to Maps 2 and
        Floodplain; and                                5). It encompasses:
    •   Lower Hawkesbury Floodplain                        •   Richmond, Windsor, McGraths Hill,
An overview of these floodplains is shown on                   Bligh Park, Wilberforce, Cattai and Pitt
Map 2 and are further described below.                         Town;
                                                           •   Rickabys Creek;
Wallacia Floodplain
                                                           •   The lower sections of South Creek
The Wallacia Floodplain is located within parts                (incorporating Eastern and Ropes
of the Penrith, Wollondilly and Liverpool local                creeks) including Marsden Park; and
government areas and includes the township
of Wallacia (Refer to Maps 2 and 3).                       •   Bushells Lagoon, Wilberforce.

The Wallacia Floodplain is around 10km in              Lower Hawkesbury Floodplain
length and is located between Bents Basin and
Wallacia. The Nepean River runs through a              The remaining floodplain is comparatively
very narrow sandstone gorge, known as Bents            narrow. It starts where the river constricts near
Gorge until it reaches Bent Basin State                Ebenezer and takes in the area downstream to
Conservation Area where the floodplain                 Spencer (Refer to Maps 2 and 6).
widens.                                                This area is generally referred to as the Lower
Downstream of Wallacia the Nepean River                Hawkesbury and is located within parts of The
narrows again through the Nepean Gorge to a            Hills, Hornsby and Central Coast local
point just upstream of Emu Plains. The                 government areas.
Warragamba River joins the Nepean River in
this gorge 3.5km downstream of Warragamba
Dam.

                           Annex A Hazard and Risk in Hawkesbury-Nepean Valley                 Page 6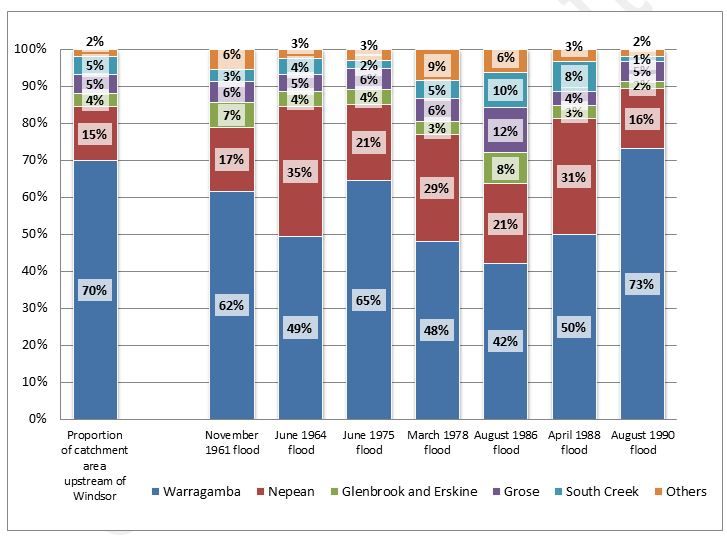
Hawkesbury-Nepean Valley Flood Plan Version 2020-0.11

Map 2: Floodplains in the Hawkesbury-Nepean Valley

 Annex A Hazard and Risk in Hawkesbury-Nepean Valley                                      Page 7
Hawkesbury-Nepean Valley Flood Plan Version 2020-0.11

          Map 3: Wallacia Floodplain

Annex A Hazard and Risk in Hawkesbury-Nepean Valley                                        Page 8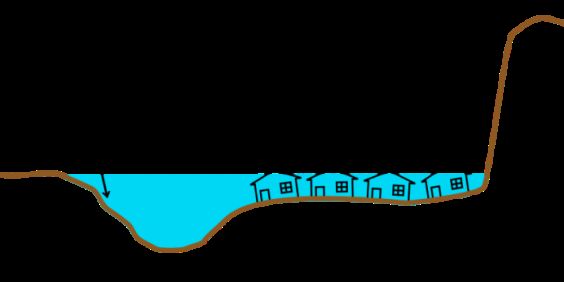
Hawkesbury-Nepean Valley Flood Plan Version 2020-0.11

Map 4: Penrith / Emu Plains / Castlereagh Floodplain

Annex A Hazard and Risk in Hawkesbury-Nepean Valley                Page 9
Hawkesbury-Nepean Valley Flood Plan Version 2020-0.11

Map 5: Richmond/ Windsor / Wilberforce Floodplain

Annex A Hazard and Risk in Hawkesbury-Nepean Valley                                       Page 10
Hawkesbury-Nepean Valley Flood Plan Version 2020-0.11

       Map 6: Lower Hawkesbury Floodplain

Annex A Hazard and Risk in Hawkesbury-Nepean Valley                                        Page 11
Hawkesbury-Nepean Valley Flood Plan Version 2020-0.11
Below Ebenezer the River enters another The large storage volume of Warragamba Dam
narrow sandstone gorge known as Sackville can mitigate flooding to some extent by
Gorge which continues through to Wisemans capturing early floodwaters, but only if the
Ferry and then on to Broken Bay, a river rainfall occurs upstream of the dam and if not
distance of around 100 kilometres. Unlike the already full. Once the dam reaches full supply
upstream constrictions near Wallacia and level, the gates are progressively opened,
Castlereagh, which are relatively short, this which can have a major contribution to
gorge consists of a long and very narrow downstream flood levels (11).
waterway.
The Colo River and the Macdonald River join Dam Emergencies
the Hawkesbury River within Sackville Gorge. Dam emergencies, particularly concerning the
After Wisemans Ferry the gorge opens up Warragamba and upper Nepean dams could
slightly downstream to Spencer. Below have some downstream consequences within
Spencer the valley opens out further into the the area covered by this plan. However, both
wide basin of Broken Bay where the dams have no known structural deficiencies,
Hawkesbury River discharges into the Pacific have been upgraded to modern design
Ocean. standards and are capable of catering for
extreme flood events. As such, the probability
STORAGE DAMS of dam failure is considered to be very low (9)
(10).
There are a number of water supply reservoirs
on tributaries upstream of Penrith including Dam emergency arrangements are detailed in
the Warragamba, Wingecarribee, Avon, supporting document “Annex G Dam
Cataract, Cordeaux and Nepean Dams. Of Emergency Arrangements” to this plan.
these, Warragamba Dam is the largest of the
reservoirs with 41% percent (9000 square RIVER CONTRIBUTIONS TO
kilometres) of the entire Hawkesbury-Nepean FLOODING
catchment located upstream of this dam (5). The Warragamba catchment makes up around
Mangrove Creek Dam is situated in the lower 70% of the catchment area located upstream
part of the catchment near the headwaters of of Windsor (Figure 1). Since the dam was
Mangrove Creek, north west of Gosford. constructed in 1960, there have been
significant variations in the contribution from
Dam locations are shown on Map 1 – the Warragamba Dam catchment to flooding
Hawkesbury-Nepean River Basin. at Windsor ranging from between 73% to only
Given that their primary purpose is for water 42% of all floodwaters (see Figure 1) (11).
supply, these dams are managed to ensure There are also a number of other tributaries
that they are kept as full as possible and which contribute to flooding in the Richmond /
therefore have minimal flood mitigation Windsor / Wilberforce floodplain including the
effects. Nepean River, Grose River and South Creek.
With the exception of Warragamba Dam and These catchments are smaller than the
Wingecarribee Dam, these dams have non- Warragamba Dam catchment however they
gated overflow spillways and cannot be generally respond more quickly to rainfall.
operated as flood mitigation dams (6) (7) (8) (9) Typically, their flow arrives in the floodplain
(10). before the flow from Warragamba Dam. This
means that river levels can rise at Windsor
Although Warragamba Dam has gates, these
regardless of what is happening upstream of
are currently operated for Dam safety
Warragamba Dam (11).
purposes and are not operated for flood
mitigation (11). The Grose River in particular drains a high
rainfall area in the Blue Mountains and can
have a significant effect on flooding at
Annex A Hazard and Risk in Hawkesbury-Nepean Valley Page 12Hawkesbury-Nepean Valley Flood Plan Version 2020-0.11
Windsor. Flood flows from this tributary can flooding from Richmond and into the Lower
result in the river level at North Richmond Hawkesbury (12).
rising markedly before flood water arrives
Similarly, the Colo River is known to have
from upstream on the Nepean River or via
contributed significantly to flood levels in the
Warragamba Dam. Flood flows from the Grose
Lower Hawkesbury (12).
River alone can produce moderate to major
Figure 1: Sub-catchment contributions to flooding at Windsor from recent floods
(Source: WaterNSW) (11)
Annex A Hazard and Risk in Hawkesbury-Nepean Valley Page 13Hawkesbury-Nepean Valley Flood Plan Version 2020-0.11
18
16
Number of floods at Windsor, 1799-2020
14
12
10
8
6
4
2
0
Jan Feb Mar Apr May Jun Jul Aug Sep Oct Nov Dec
Figure 2: Seasonality of Hawkesbury-Nepean floods
Note: based on flood history at Windsor, 1799-2020 (13)
WEATHER SYSTEMS AND sustained falls of only 10-15 millimetres per
FLOODING hour and can produce severe floods.
The Hawkesbury-Nepean catchment displays The rainfall that produces severe flooding in
wide variation in rainfall distribution. The the Hawkesbury-Nepean Valley will usually
annual average rainfall for the whole come from East Coast Low Pressure Systems.
catchment is approximately 1000 millimetres These systems develop off the state’s coast,
however the annual average rainfall over the and direct moist winds onto the coast. Usually,
headwaters of the Nepean is 1500 millimetres but not exclusively, they move in a southerly
while on the southern extremity of the basin direction. Once these air masses strike coastal
near Goulburn the figure is about 625 ranges such as the Illawarra escarpment or the
millimetres. The majority of the rainfall occurs Great Dividing Range. The resulting uplift of air
in the summer months, but floods may be often produces very high rates of rainfall and
experienced during any part of the year. heavy rain.
There are many localities in the valley that Sea conditions can also influence flooding in
have received 175 millimetres of rainfall in a 24 the lower river reaches. Along the coast,
hour period. Falls in excess of 250 millimetres oceanic storm surges and large waves may
in a 24 hour period have been recorded at result from East Coast Low Pressure Systems
Katoomba, Lawson, Springwood, Penrith and and their associated gales and storm-force
Kurrajong Heights. It should be noted that winds. Such conditions may lead to coastal
these rainfall totals can often result from inundation of seawater and can delay the
Annex A Hazard and Risk in Hawkesbury-Nepean Valley Page 14Hawkesbury-Nepean Valley Flood Plan Version 2020-0.11
floodwaters from the Hawkesbury River CHARACTERISTICS OF FLOODING
reaching the Pacific Ocean.
The larger floods that have occurred on the Bathtub Effect
Hawkesbury-Nepean River have often been The Hawkesbury-Nepean Valley has a unique
accompanied by storm surge of 0.1-0.3 metres feature that dramatically affects the behaviour
in Broken Bay. These effects are most apparent of floods.
if storm surge conditions occur during periods
of spring or extreme tides. On a typical coastal river the valley
progressively widens as it approaches the
A comparison of major Hawkesbury River ocean outflow. However, in the Hawkesbury-
floods at Windsor since 1860 to a tabulation of Nepean the series of wide floodplains,
the weather systems causing the floods, shows separated by narrow sandstone gorges, causes
that all but one of 13 major floods were flood waters to back up on the floodplains
associated with East Coast Low Pressure behind these natural ‘choke points’. Water
Systems. Among these were the flood of cannot escape as quickly as it enters and so it
record in June 1867, and the second highest fills up like a bathtub. This is known as the
flood of record in November 1961. Major ‘bathtub effect’ and it results in water levels
flooding in 1964, 1978, 1988 and 1990 resulted that are well above those typically expected
from similar weather systems (14). (11) (See Figure 3).
Several flood-producing East Coast Low At Windsor for example, the river level could
Pressure Systems may be experienced annually rise from a normal non-flood level of 0.7
in New South Wales. During the 1990s for metres up to about 26.7 metres AHD in the
example, there were between two and five Probable Maximum Flood (PMF). With many
such occurrences in most years. This can result house floor levels built at around 17.3m AHD
in multiple flood events on the same river this means that floodwaters can be higher than
system within the same year. 9 metres above the floor. This is equivalent to
the height of a three story building (15). (See
Climate Variability Figure 4).
The history of floods at Windsor since the
1790s suggests multi-decadal periods of more Flood Islands and Trapped Areas
frequent and larger floods, interspersed by Another feature of flooding within the
multi-decadal periods of less frequent and Hawkesbury-Nepean Valley is that many roads
smaller floods. These periods have been have low points that flood and are cut off
described as flood-dominated and drought- before the higher inhabited areas are
dominated regimes, respectively. Floods still inundated creating ‘flood islands’ (11).
occur during the decades dominated by drier
conditions and the relative infrequency of As the flood rises, these flood islands are
floods during those decades should not be gradually inundated such that during major
taken to represent the total flood hazard flood events they may be completely
profile. submerged. Those that aren’t fully submerged
may only have small patches of flood free land
remaining.
Climate Change
Similarly, many areas, particularly within the
Climate change is expected to affect flood
gorges, can become trapped by flood waters
behaviour within the Hawkesbury-Nepean
when access roads and ferries are cut with
catchment through increased severity of flood
limited means of escape due to the steep and
producing storms or other weather systems.
rugged surrounding terrain.
Rainfall is projected to increase by 4.7% by
2030 and 9.4% by 2060 under projected For further information see 2.4 – Flood
medium climate change (15). Emergency Response Classification of
Communities.
Annex A Hazard and Risk in Hawkesbury-Nepean Valley Page 15Hawkesbury-Nepean Valley Flood Plan Version 2020-0.11
TIMEFRAMES There is also considerable variability in flood
peak times (15). For example, downstream
Extreme floods within the Hawkesbury-
areas may peak before upstream locations,
Nepean Valley with the greatest depths of
given the bathtub effect and the timing of the
flooding can develop reasonably quickly. The
downstream tributary inflows such as the
highest possible flood level is called the
Grose River and Colo River. In the February
Probable Maximum Flood (PMF). The time
2020 flood, inflows from the Grose River drove
from the start of rainfall, to peak levels of a
relatively early flooding at the North Richmond
PMF can be as little as 24 hours. Historical
Bridge, before flows arrived from the Upper
events to date have tended to develop over 3
Nepean.
days or more (16) (See section 1.10 – Extreme
Flooding for further details). The rate of rise and travel times have
significant implications for the evacuation of
Rates of water level rise can be variable, with
the large number of people off the floodplain.
the fastest rises historically experienced in the
Table 1 shows the indicative flood travel times
Richmond / Windsor / Wilberforce area of
for various locations along the Hawkesbury-
almost 1 metre per hour prior to the river
Nepean River.
breaking its banks (16). Once the river breaks
its banks and spreads onto the floodplain these
rates of rise tend to decrease.
Indicative
Locations
Travel Time
Menangle to Camden Bridge 5 hours
Camden Bridge to Wallacia Weir 11 hours
Wallacia Weir to Penrith 2 hours*
Warragamba Dam outflow to Penrith 2-3 hours
Penrith to North Richmond 2-4 hours
North Richmond to Windsor 1-12 hours
Windsor to Sackville 3 to 11 hours
Sackville to Lower Portland 6 hours
Lower Portland to Webbs Creek (Wisemans Ferry) 6 to 11 hours
Table 1: Indicative Flow Travel Times for the Hawkesbury-Nepean River
Note: * for Warragamba-dominated floods, peaks at Penrith tend to precede peaks at Wallacia (15)
Annex A Hazard and Risk in Hawkesbury-Nepean Valley Page 16Hawkesbury-Nepean Valley Flood Plan Version 2020-0.11
Figure 3: The 'bathtub effect’ caused by some of the natural choke points in the Hawkesbury-Nepean Valley
(Source: Infrastructure NSW (17))
Figure 4: Comparison of the differences in flood levels and flood risk between the Hawkesbury-Nepean River
and other floodplains
(Source: Infrastructure NSW (18))
A. WMAwater for the Taskforce
B. Lismore Floodplain Risk Management Plan – Glossary and Appendices (Lismore City Council, 2014)
C. Nyngan April 1990 Flood Investigation (NSW Department of Water Resources, 1990)
Annex A Hazard and Risk in Hawkesbury-Nepean Valley Page 17Hawkesbury-Nepean Valley Flood Plan Version 2020-0.11
RIVER LEVEL GAUGING predicted gauge height for locations within the
gauge reference area.
In the monitoring of floods and the planning
that takes place to deal with floods, river water
Key Flood Gauges
levels are related to river gauging stations.
These gauges measure the height of the water The key reference flood gauges for the
surface at points along a river. The Australian Hawkesbury-Nepean Valley, and for which the
Bureau of Meteorology (Bureau) provides Bureau provides flood predictions are listed
flood height predictions to several of these below. The designated AWRC Gauge number is
gauges such that people can gain an shown in parentheses:
understanding of how large the flood is • Menangle (212904);
expected to be.
• Wallacia Weir (212202);
Gauge Zero • Penrith at Victoria Bridge (212201);
The level of a river gauge "gauge zero" is • North Richmond Bridge (212902);
typically set at the low flow level of the stream.
River heights are measured in metres above • Windsor PWD (212426);
the gauge zero. For example, a river height • Sackville at Sackville Ferry (212406);
reading of 5 metres means that the water level
has risen 5 metres above its lowest level (19). • Putty Road (212908);
Heights within the landscape are normally • Lower Portland (212407);
measured in relation to mean sea level using • Webbs Creek (Wisemans Ferry)
Australian Height Datum (AHD). For example, (212408).
the automatic flood gauge at Penrith has a
gauge zero of 14.14m. This means that if the Further details on River Level gauges in the
reading was 11.0m at the Penrith flood gauge Hawkesbury-Nepean Valley are provided in
this would be equivalent to a height of 25.14m Annex B of this plan.
AHD. The gauge at Windsor has a gauge zero of
0m. This means that if the reading was 1.0m at FLOODING OF FLOODPLAINS
the Windsor gauge it would be equivalent to
1.0m AHD. Flooding of Wallacia Floodplain
At the Victoria Bridge gauge at Penrith the Flooding in the Wallacia floodplain can be
gauge zero is 14.136m, therefore a reading of dominated by floodwaters coming from the
10m at the gauge would be equivalent to Nepean River Catchment (typically smaller
24.136m AHD. events), from the Warragamba River
Catchment (larger events), or a combination of
Gauge Reference Area both. The narrow gorges between Wallacia and
Penrith limit the rate of outflow and can cause
The slope of a river channel changes along its floodwater to backup the Nepean River from
length, with some sections flatter and others the Warragamba / Nepean rivers junction to
steeper. Because of these changes along the the Wallacia floodplain.
river, flood gauges are only able to be related
to particular sections of the river and Floodwaters travel through Bents Gorge
floodplain known as the “gauge reference entering the Wallacia floodplain at Bents Basin
area”. (Refer to Map 3).
Depending on what historical or modelled data Once on the Wallacia Floodplain, flood waters
is available, the consequences of flooding such can back up Jerrys Creek from the Nepean
as when roads will be cut, and when houses River surrounding the town of Wallacia to the
will begin to flood can be inferred from the north east and west (20). During a PMF most of
Wallacia would be flooded, with only a thin
Annex A Hazard and Risk in Hawkesbury-Nepean Valley Page 18Hawkesbury-Nepean Valley Flood Plan Version 2020-0.11
strip of land to the south of town near Flooding of Richmond / Windsor
Greendale Road remaining flood free. Floodplain
On the western side of the river, the lower The natural constriction in the floodplain as the
lying land along Bents Basin Road can become river enters the Sackville Gorge has a marked
inundated by floodwaters. influence on flood behaviour upstream of this
point (Refer to Map 5).
Flooding of Penrith / Emu Plains
Floodwaters flow freely into the Richmond /
Floodplain Windsor floodplain but cannot escape at the
The upper section of the river near Penrith and same rate through the Sackville Gorge. As a
Leonay has natural levee banks which help to result, water levels around Richmond and
keep flood waters contained within them to Windsor can rise to 26.7m (15) with normal
around the 1 in 100 (1%) chance per year flood river levels being about 0.5m.
event (around 11.6m at the Penrith gauge or Low lying farming areas including Richmond
25.8m AHD) (15) (Refer to Map 4). Lowlands, Cornwallis, Pitt Town Bottoms and
However some flooding occurs prior to the areas along Rickabys and South Creeks are
river breaking its banks where flood waters flooded first.
back up in local creeks including: Cranebrook Depending on the size of the flood, areas that
Creek, Lapstone Creek, Knapsack Creek, are normally hills or rises in the landscape can
Boundary Creek, Peach Tree Creek, become surrounded by floodwaters and
Schoolhouse Creek and Mulgoa Creek (4). become isolated ‘flood islands’. If floodwater
Downstream of Victoria Bridge and Penrith continues to rise, these islands can then
Weir, just south of the Penrith Lakes area, the become completely covered by floodwater.
river turns sharply to the west. Floodwaters This includes the townships of McGraths Hill,
start to bypass this bend and inundate areas of Pitt Town, Windsor, Bligh Park and parts of
Emu Plains. Flooding of the Emu Heights area Richmond.
is primarily caused by backwater flooding from
the Nepean River, while flooding in the Penrith Grose River
Lakes area develops from a combination of
Flood flows from this tributary can result in the
backwater flooding and over bank breakouts
river level at North Richmond rising markedly
(4).
before floodwater arrives from upstream on
Floodwater also backs up on the southern side the Hawkesbury River. There is only one
of the main Western Rail Line embankment in rainfall and river level gauging station in the
Emu Plains which is a main flow control in the Grose Valley and no river gauge at its junction
floodplain (4) (21). with the Hawkesbury River. The short travel
Floodwater can isolate parts of the time from the junction of these two rivers to
communities in Emu Plains including Emu North Richmond, means that warning time can
Heights, Leonay, Central and East Emu Plains, be short. Flood flows from the Grose River
North Penrith, and the Peach Tree Creek area alone can produce moderate to major flooding
creating ‘flood islands’. Depending on the size from Richmond and into the Lower
of the flood, these islands can gradually Hawkesbury (12).
become completely covered by flood waters.
South Creek
During large flood events floodwaters meet up
on the southern and northern sides of the main Normally flooding of South Creek occurs as a
Western Rail line in Emu Plains. result of local catchment runoff. However,
during major flooding of the Hawkesbury-
During a PMF most of Emu Plains, the Penrith Nepean River, the lower reaches of South
Lakes area and parts of Penrith, extending into Creek can ‘back up’ South Creek from the
part of the Penrith central business district,
would be flooded.
Annex A Hazard and Risk in Hawkesbury-Nepean Valley Page 19Hawkesbury-Nepean Valley Flood Plan Version 2020-0.11
Hawkesbury River and flood the surrounding It is believed that significant bank erosion
areas (1). occurred within the Macdonald River during
previous flood events which caused large
The influence of this Hawkesbury-Nepean
amounts of sand to be deposited within the
backwater flooding on South Creek generally
river, and the river to widen. In more recent
extends as far upstream as Mayo Road or
years some of this sand was flushed out of the
Dunheved Road in Werrington. However
system. Further riverbank erosion and
during a PMF event these backwaters can
widening is considered a possibility during
extend as far upstream as the Western
future flood events (3).
Motorway (M4) and main Western Rail Line
(1).
FLOOD HISTORY
Flooding of Lower Hawkesbury The Hawkesbury-Nepean Valley has
Floodplain experienced numerous serious floods since
before the earliest days of European
Flooding along the Hawkesbury River and its settlement. Floods have occurred in nearly all
tributaries between Cattai and Broken Bay is months of the year (Figure 2: Seasonality of
confined within relatively deep and narrow Hawkesbury-Nepean floods ).
river gorges. This results in steep flood
gradients and very high flow velocities both The earliest European explorers noticed
within the river channel and the limited evidence of significant floods along the
adjoining floodplains (15) (Refer to Map 6). Nepean and Hawkesbury Rivers, with debris
lodged in the treetops 30 to 45 feet (9.1m to
The flood behaviour of the Lower Hawkesbury 13.7m) above the normal river levels (22).
River can be influenced by flooding from the
Hawkesbury River upstream of Sackville A series of floods in the early 1800’s had major
combined with flooding from the major implications for the food supply and economy
tributaries below Sackville (12). of the Sydney Colony, and led Governor
Macquarie to call for the relocation of early
Flooding in the lower reaches can also be settlements along the river to higher ground
influenced by the interaction of floodwater (22).
with tidal variations (5) (12).
The highest recorded flood in the Hawkesbury-
Colo River Nepean Valley occurred in 1867 when a height
of 27.5m AHD was reached at Penrith, and
The Colo River can inject a large flow into the 19.7m AHD at Windsor (15). This flood was also
Hawkesbury River at Lower Portland. This can the worst that has occurred in terms of lives
cause backup flooding along the Hawkesbury lost and the destruction of property and
River towards Sackville (12). livestock. If this same flood occurred today it
At higher Hawkesbury River flows, the effect would reach 19.3m AHD at Windsor because
can be to slow down the rate of drainage from the presence of Warragamba Dam has some
the primary floodplain which holds up flood flood mitigating effect (11).
levels in the Richmond / Windsor area (12). The highest flood since Warragamba Dam was
completed in 1960, and the highest in living
Macdonald River memory, occurred in November 1961 when
Flooding in the Macdonald River Valley is flood levels reached 9.75m (23.9m AHD) at
primarily due to surface runoff generated from Penrith and 15.0m at Windsor.
the steep vegetated local catchment. The most recent major flood (defined as being
However, in the lower reaches, the Macdonald above 12.2m at Windsor) was experienced in
River can be affected by backwater flooding 1990 when flood levels reached 9.3m (23.4m
from the Hawkesbury River (3). AHD) at Penrith and 13.5m at Windsor.
Annex A Hazard and Risk in Hawkesbury-Nepean Valley Page 20Hawkesbury-Nepean Valley Flood Plan Version 2020-0.11
Other major floods in the valley and their in February 2020, which reached only a minor
heights at Windsor and Penrith are shown in level at Penrith (6.1m = 20.3m AHD) and
Figure 5. moderate level at Windsor (9.3m).
Despite a history of significant floods, most of There is some sedimentary evidence that
the current population living within the floods larger than the 1867 flood occurred
floodplain have experienced only small flood prior to European settlement (23).
events. The highest flood since 1992 occurred
35
PMF at Penrith
30
Peak flood height (m AHD)
PMF at Windsor
25
20
15
10
5
0
1806 Mar
1809 May
1816 Jun
1819 Mar
1864 Jun
1867 Jun
1870 Apr
1875 Jun
1890 Mar
1988 May
1879 Sep
1900 Jul
1904 Jul
1964 Jun
1978 Mar
1990 Aug
1817 Feb
1873 Feb
1956 Feb
1961 Nov
Windsor Penrith
Figure 5: Hawkesbury-Nepean Flood History showing Major Floods at or above 12.2m at Windsor
Data source: (15)
Notes:
• The PMF level at Windsor is 26.7m AHD, and at Penrith is 32.8m AHD (15). (Flood levels
are higher at Penrith due to it being upstream and higher in elevation).
• All readings were taken at either the Windsor Bridge gauge at Windsor or the Victoria
Bridge gauge at Penrith and are in metres AHD.
• The gauge zero for the Windsor gauge is 0m, and the gauge zero for Victoria Bridge
manual gauge at Penrith is 14.136m.
• All flood levels are as observed, without adjustment for Warragamba Dam, which was
completed in 1960.
Annex A Hazard and Risk in Hawkesbury-Nepean Valley Page 21Hawkesbury-Nepean Valley Flood Plan Version 2020-0.11
significant solution or single infrastructure
FLOOD MITIGATION SYSTEMS option that can eliminate all of the flood risks
in the Hawkesbury-Nepean Valley.
There is currently no significant flood specific
mitigation infrastructure within the
FLOOD FREQUENCY/SIZE
Hawkesbury-Nepean Valley to reduce risk to
property from a Hawkesbury-Nepean River Floods that are frequent are smaller; floods
flood (11). that are rarer are larger. The frequency and
size of floods at six key flood warning gauges is
A number of small flood mitigation systems
described in Table 2. These results are derived
have been constructed further upstream in the
from detailed flood investigations.
South Creek catchment primarily to deal with
local catchment flooding in the St Marys and The size of floods is often described as a flood
Werrington areas (1). level (or height) at a river gauge (see Section
1.8).
There is also a small private levee in a tributary
of McKenzie’s Creek near Pitt Town which The frequency of floods is expressed as an
appears to slightly delay water from entering Annual Exceedance Probability (AEP). This is
the Pitt Town Bottoms area from South Creek. the chance of a flood of a given or larger size
occurring in any one year. AEP may be
A number of investigations of flood mitigation
expressed as either a percentage (%) or 1 in X.
options have been undertaken for the
For example, the peak level corresponding to a
Hawkesbury-Nepean River, including the
5% AEP (or 1 in 20 AEP) flood has a 5% chance
Hawkesbury-Nepean Valley Flood Review (11)
(that is, a one-in-20 chance) of being reached
and the Taskforce Options Assessment Report
or exceeded in any one year. This is the
(18). These have considered options to:
preferred way to express flood probabilities.
• Store or capture flood waters (e.g.
Periods of both more frequent and more
flood mitigation dam,
severe flooding than have been seen in recent
modification of Warragamba Dam
times must be expected in the future.
Gate operations).
It is expected that with climate change, flood
• Drain or divert water away from
levels for the 1% (1 in 100) AEP event at
the valley (e.g. diversions and
Windsor would rise by 0.7m (for a 9.1%
dredging).
increase in rainfall in 2071). Another way of
• Provide local protection up to a looking at it is that the current 1% (1 in 100)
certain level (e.g. levees). AEP chance level will occur more frequently
and would become a 1 in 65 AEP event (15).
Investigations into these flood mitigation
solutions have found that there is no simple or
Annex A Hazard and Risk in Hawkesbury-Nepean Valley Page 22Hawkesbury-Nepean Valley Flood Plan Version 2020-0.11
Table 2: Hawkesbury-Nepean flood levels for different probabilities at various flood warning gauges
Wisemans Ferry
Frequency Penrith (at Victoria North Richmond Windsor (at Windsor
Wallacia Weir Sackville (Webbs Creek Ferry
(AEP) Bridge) Bridge Bridge)
site)
% 1 in X m AHD m on m AHD m on m AHD m on m AHD m on gauge m AHD m on m AHD m on
chance chance per gauge gauge gauge gauge gauge
per year year
20% 1 in 5 34.8 8.2 19.6 5.4 11.4 11.4 9.9 9.7 6.3 6.3 2.8 3.0
10% 1 in 10 37.0 10.4 21.3 7.2 13.7 13.7 11.9 11.8 8.4 8.4 3.7 3.9
5% 1 in 20 39.3 12.7 23.3 9.2 15.4 15.4 13.7 13.6 10.1 10.1 4.8 5.0
2% 1 in 50 42.5 15.9 24.8 10.7 16.5 16.5 16.1 15.9 12.1 12.1 6.2 6.4
1% 1 in 100 44.6 18.0 25.8 11.6 17.6 17.6 17.3 17.2 13.2 13.2 7.2 7.4
0.5% 1 in 200 46.5 19.9 26.5 12.3 18.6 18.6 18.4 18.2 14.2 14.2 8.2 8.4
0.2% 1 in 500 48.9 22.3 27.1 13.0 19.8 19.8 19.6 19.5 15.6 15.6 9.5 9.7
0.1% 1 in 1000 50.7 24.1 27.5 13.4 20.7 20.7 20.6 20.4 16.7 16.7 10.5 10.7
0.05% 1 in 2000 54.2 27.6 28.4 14.2 21.9 21.9 21.7 21.6 18.0 18.0 11.4 11.6
0.02% 1 in 5000 58.3 31.7 29.4 15.3 22.8 22.8 22.6 22.5 19.2 19.2 12.8 13.0
PMF 66.3 39.7 32.8 18.6 26.8 26.8 26.4 26.6 23.6 23.6 14.5 14.7
Source: Hawkesbury-Nepean Valley Regional Flood Study: Final Report (July 2019) (15)
Note: For Wallacia Weir, higher flood levels for more frequent flood sizes are reported in the Upper Nepean River Flood Study (1995) (24). The 1% (1 in 100) AEP level is
45.6m AHD in the Upper Nepean River Flood Study. Further investigation of Wallacia flood levels is occurring through development of the Hawkesbury-Nepean River Flood
Study (Infrastructure NSW) in 2020-21. This work may lead to changed flood level estimates for other locations too.
Annex A Hazard and Risk in Hawkesbury-Nepean Valley Page 23Hawkesbury-Nepean Valley Flood Plan Version 2020-0.11
rising water results in the highest water level in
EXTREME FLOODING Warragamba Dam (but not the downstream
floodplain) and is therefore most critical for
For planning to be capable of being effective in
dam safety (25).
all circumstances, it must take into account the
worst floods that could occur. Information The 24 hour PMF for the Warragamba
about the full range of possible flooding is catchment would have an estimated peak
obtained from scientific studies that have inflow at Warragamba Dam of approximately
determined how bad the worst floods are likely 52,100 cubic metres of water each second and
to be. The greatest depth of rainfall possible an outflow of approximately 42,200 cubic
over a given area in a nominated time period metres per second. It is estimated that this
(e.g. 24hrs or 72hrs) is called the Probable PMF would have a total flood volume of
Maximum Precipitation (PMP). around 6,000 gigalitres (25).
The highest possible flood level is called the By way of comparison, the November 1961
Probable Maximum Flood (PMF). For the flood (the largest flood in living memory) had
Hawkesbury-Nepean Valley it is when the PMP an estimated peak inflow at Warragamba Dam
distributed over the whole catchment in a 72 of 9,000 cubic metres per second and an
hour period that the greatest depth of flooding outflow of 7,590 cubic metres per second. The
results (i.e. the 72 hour PMF). The modelling November 1961 flood which reached 23.9m
for the 72 hour PMF in the Hawkesbury- AHD at Penrith and 15.0m at Windsor has been
Nepean Valley assumes the following estimated to have a 2.5% AEP (one in 40
conditions: chance of occurring in any one year) (25).
• Full storage at the Warragamba Floods much larger than those in living
Dam; memory, and even larger than the flood of
record can occur within the Hawkesbury-
• A fully saturated (wet) catchment.
Nepean Valley.
The rainfall required is in the order of 770
Map 2 shows the predicted PMF Flood extent
millimetres across the Warragamba catchment
as well as the 1% AEP (1 in 100 year) flood
in a 72 hour period (72 hour PMP) (15). Note
extent for the Hawkesbury-Nepean Valley.
that this requires an average of only about 11
millimetres/hour.
A PMP in the entire Hawkesbury-Nepean
catchment and the resulting PMF is estimated
to have 0.001% AEP (one chance in 100,000
each year) of occurring (15). This means they
are very rare probability events.
Rainfall heavy enough to support the idea of
PMP has been observed in various places
around the world including Australia
(Wollongong 1984 – 440 millimetres in 6 hours
over a 100 square kilometre area). Flood
records from around the world demonstrate
that PMF events have occurred.
The PMP distributed over other time periods
and the resulting floods that they would
produce have also been modelled for the
Hawkesbury-Nepean Valley and its sub-
catchments. For instance, the 24 hour PMP for
the Warragamba catchment results in the
critical PMF for Warragamba Dam. The rapidly
Annex A Hazard and Risk in Hawkesbury-Nepean Valley Page 24Hawkesbury-Nepean Valley Flood Plan Version 2020-0.11
5 million people in Sydney, the Illawarra and
PART 2 EFFECTS OF the Blue Mountains (26).
FLOODING ON THE
FLOOD EMERGENCY RESPONSE
COMMUNITY CLASSIFICATION OF COMMUNITIES
Communities can be affected by flooding
INFORMATION SOURCES
either directly, or indirectly. Depending on
Data used in this plan has been sourced from their location in the landscape, and the roads
the most current published reports. This and services available to them during a flood
information is currently being reviewed as part these communities can have differing needs
of the Hawkesbury-Nepean Valley Flood for assistance during a flood such as
Review Stage 2 Taskforce. This plan will be information and warning provision,
updated accordingly as further information evacuation, resupply and/or rescue.
becomes available. Communities can be classified according to the
impact that flooding has on them and the
POPULATION potential assistance they may require. The five
It is estimated that around 91,000 people are classifications are outlined in the Flood
currently living in areas prone to flooding from Emergency Response Classification Guidelines
the Hawkesbury-Nepean River. This estimate and are described below (Refer to Figures 5 to
assumes that dwellings are occupied as they 11):
were on census night (2016), however these • Flood Islands (High and Low);
numbers are likely to vary with higher numbers
• Areas with Overland Escape
expected during summer, on weekends and
Routes;
during holiday periods.
Sydney’s population is expected to grow • Areas with Rising Road Access;
significantly into the future, with new • Trapped Perimeters (High and
development areas including part of the North Low); and
West Growth Centre located within the
Hawkesbury-Nepean floodplain (11). Within • Indirectly affected areas.
the Metropolitan West subregion of Sydney Note: These definitions are described in terms
(most of which is located in the Hawkesbury- of the impact of a PMF. However these
Nepean Valley) there is an expected increase classifications may be different at different
of 89,000 people by 2031 (11). levels of flooding (e.g. the same community
may be isolated during a smaller flood event,
SIGNIFICANCE OF AREA but may be completely inundated during a
The Western Sydney region is one of larger event).
Australia’s largest and most diverse economies Flood Islands
with an annual gross regional product of over
$104 billion in 2013-2014. Important These are inhabited areas of high ground
industries include fresh fruit and vegetables, within a floodplain linked to flood free areas by
turf farms, horse studs, eggs and poultry, an access road. The access road can be cut by
oyster farms, manufacturing and processing flood water, closing the only evacuation route
industries, water-ski parks and other forms of and creating an island.
tourism. After closure of the road the only access to the
The Hawkesbury-Nepean catchment is also area is by boat or by aircraft.
significant due to its many natural values Flood islands are further classified according to
including the Blue Mountains World Heritage what can happen after the evacuation route is
Area. It is the source of drinking water to over cut into High Flood Islands and Low Flood
Islands.
Annex A Hazard and Risk in Hawkesbury-Nepean Valley Page 25Hawkesbury-Nepean Valley Flood Plan Version 2020-0.11
High Flood Island flood conditions may prevent usual boat
access.
The flood island is higher than the limit of
flooding (i.e. above the PMF). The island is The ability to retreat to higher ground does not
surrounded by flood water but there is still exist due to topography or impassable
enough land available to provide a flood free structures. Trapped perimeter areas are
space for people remaining in the area. This further classified according to what can
flood free space may not be enough to happen after the evacuation route is cut as
adequately sustain the population. Properties follows:
may or may not be flooded.
High Trapped Perimeters
The area will require resupply by boat or air if
not evacuated before the road is cut. These are inhabited areas above the PMF but
Evacuation will have to take place before the only access road/s is across flood prone
isolation occurs if it will not be possible to land. Road access may be closed during a flood.
provide adequate support during the period of The area will require resupply by boat or air if
isolation, if essential services won’t be not evacuated before the road is cut.
available, or if houses will be flooded. Evacuation will have to take place before
isolation occurs if it will not be possible to
provide adequate support during the period of
isolation, if essential services won’t be
available, or if houses will be flooded.
Figure 6: High Flood Island
Low Flood Island
The flood island is lower than the limit of
flooding (i.e. below the PMF). If flood water Figure 8: High Trapped Perimeter
continues to rise after it is isolated, the island
Low Trapped Perimeters
will eventually be completely covered with all
properties inundated. People left stranded on The inhabited area is lower than the limit of
the island may drown unless rescued. flooding (i.e. below the PMF) or does not have
Evacuation must be completed before roads enough land to cope with the number of
are inundated. people in the area. During a flood event the
area is isolated by floodwater and property
may be inundated. If flood water continues to
rise after the area is isolated it will eventually
be completely covered. People left stranded
may drown if not rescued. Evacuation must be
completed before roads are inundated.
Figure 7: Low Flood Island
Trapped Perimeters
These are similar to flood islands in that they
are inhabited or potentially habitable areas of
higher ground. They exist at the fringe of the
floodplain where the only practical road or
overland access is through flood prone land
Figure 9: Low Trapped Perimeter
and unavailable during a flood event. In some
cases normal access to the area is by boat but
Annex A Hazard and Risk in Hawkesbury-Nepean Valley Page 26Hawkesbury-Nepean Valley Flood Plan Version 2020-0.11
Areas with Overland Escape Routes
These are inhabited areas on flood prone
ridges jutting into the floodplain or on the
valley side. The access road/s cross lower lying
flood prone land.
Evacuation can take place by road only until
access roads are closed by flood water. Escape Figure 11: Area with Rising Road Access
from rising flood water will be possible by
walking overland to higher ground. Anyone not Indirectly Affected Areas
able to walk out must be reached by using There will be areas outside the limit of flooding
boats and aircraft. If people cannot get out which will not be inundated and will not lose
before inundation, rescue will most likely be road access. Never the less they may be
from rooftops. Pedestrian evacuation must indirectly affected as a result of flood damaged
never be relied upon as a primary evacuation infrastructure such as due to the loss of
strategy. It is only ever a back-up strategy if transport links, electricity supply, water
vehicular evacuation fails. supply, sewage or telecommunications
services. They may require resupply or in the
worst case, evacuation.
Figure 10: Area with Overland Escape Route
Areas with Rising Road Access
Figure 12: Indirectly affected area
These are inhabited areas on flood prone
ridges jutting into the floodplain or on the HAWKESBURY-NEPEAN FLOOD
valley side with access road/s rising steadily EMERGENCY RESPONSE
uphill and away from the rising flood waters. CLASSIFICATIONS
The community cannot be completely isolated
Within the Hawkesbury-Nepean Valley each
before inundation reaches its maximum
area has been classified according to its flood
extent.
emergency response classification. Some of
Evacuation can take place by vehicle or on foot the most critical areas including those that are
along the road as flood waters advance. People classified as Low and High Flood Islands and
should not be trapped unless they delay their Trapped Perimeters are shown in Table 3 and
evacuation. For example people living in two Table 4.
storey homes may initially decide to stay but
These are summarised by floodplain and
reconsider after water surrounds them.
according to the order that their evacuation
These communities contain low-lying areas routes are cut (See also Annex C, Tables 2 to 5
from which people will be progressively for a full list of Sectors, their Emergency
evacuated to higher ground as the level of Response Classification and heights at which
inundation increases. This inundation could be roads are expected to be cut).
caused either by direct flooding from the river
system or by localised flooding from creeks.
Annex A Hazard and Risk in Hawkesbury-Nepean Valley Page 27You can also read