Assessing the Long-Term Planform Dynamics of Ganges-Jamuna Conuence With the Aid of Remote Sensing and GIS
←
→
Page content transcription
If your browser does not render page correctly, please read the page content below
Assessing the Long-Term Planform Dynamics of
Ganges-Jamuna Confluence With the Aid of Remote
Sensing and GIS
Nafis Sadik Khan
Bangladesh University of Engineering and Technology
Sujit Kumar Roy ( sujitroy.bejoy@gmail.com )
Bangladesh University of Engineering and Technology (BUET) https://orcid.org/0000-0003-4465-9053
Md. Touhidur Rahman Mazumder
Bangladesh Water Development Board
Swapan Talukdar
University of Gour Banga
Javed Mallick
King Khalid University
Research Article
Keywords: Channel planform dynamics, Remote sensing, GIS, Ganga-Jamuna, Erosion and deposition
Posted Date: September 13th, 2021
DOI: https://doi.org/10.21203/rs.3.rs-750515/v1
License: This work is licensed under a Creative Commons Attribution 4.0 International License.
Read Full License
Page 1/30
Abstract
The Ganges-Jamuna-Padma confluence is one of the world's most active confluences. The confluence of
two of the world's greatest rivers, the Ganges and the Brahmaputra, makes this a globally significant site.
Severe erosion along the banks has been caused by morphological changes in this region. Riverbank
erosion is one of Bangladesh's most serious problems, as it necessitates costly intervention. Riverbank
erosion in Bangladesh affects millions of people each year as a result of erosion in this confluence zone.
As a result, it's critical to comprehend the confluence's morphological changing pattern. This study aims
to quantify actual bank shifting around the confluence of the Ganges, Jamuna, and Padma in terms of
shifting rate and area during a twenty-five-year period (1990-2015). To conduct this study the collected
satellite image were geo-referenced and digitize bank lines from using ArcGIS program. The bank line is
the linear structure that divides the river channel's outer border from the flood plains. The distance
between the extreme margins of the left and right banks, including mid-channel sandbars, was measured
to determine channel width variation. To assess the maturity of change, this time frame is subdivided into
five phases, each lasting five years. In addition, the long-term shift from 1972 to 2015 is qualitatively
noticeable. This morphological alteration was studied using LANDSAT satellite images. The research
gives current and trustworthy information on the Ganga-Jamuna confluence's planform dynamics. This
research will be useful in the planning and execution of drainage development plans and erosion control
strategies in this critical confluence zone.

1. Introduction
River confluences are important governing points of channel geomorphology (Mosley 1976, Best 1988).
Planform shifting is a natural autogenic phenomenon for rivers that occurs as a result of high discharge
quantity, large sediment load, stream type (perennial or seasonal), terrain, and anthropology of the regime
running through (Roy and Mitra, 2020). One of the world's most serious challenges with alluvial rivers is
channel planform dynamics. Natural hazards such as lateral channel transition, floods, bank erosion, and
disruption to hydraulic structures, transportation networks, agricultural land, and settlements, are all
caused by this. Many water resources experts, engineers, and policymakers rely on a thorough grasp of
the historical planform evolution in rivers over time to carry out river management operations (Roy and
Sinha, 2018; Majumdar and Mandal, 2020). Tremendous endeavors have been undertaken to investigate
channel planform behaviour locally and worldwide over the last three decades (Bora and Goswami, 2021;
Hasanuzzaman et al. 2021). Numerous geospatial technology-based studies have been conducted
across the world, including in the United States on the four rivers of Olympic National park (East et al.,
2017) , Taiwan on the Zhuoshui River and the Gaoping River (Kuo et al., 2017), Italy on the Scrivia river
(Mandarino et al., 2020), Germany on the Old Rhine downstream (Arnaud et al., 2015), China on the lower
yellow river (Kong et al., 2020; Guo et al., 2021) and the lower jingjiang reach (Yang et al., 2013), India on
the Koshi river (Sinha et al., 2014), the Sharda river (Midha and Mathur, 2014), the Dwarkeswar river
(Ghosh and Mukhopadhyay, 2021), the middle lower part of ganga (Pal and pani, 2019), and the
Ramganga river basin (Agnihotri et al., 2020), and Bangladesh on the lower padma river (Rashid, 2020;

                                                  Page 2/30
Nawfee et al., 2018; Halder et al., 2021), the rivers in southern estuarine Region (Islam et al., 2018), the
Lower Meghna river (Mahmud et al., 2020), Madhumati river (Biswas et al., 2021), the lower Teesta river
(Akhter et al., 2019), and the Brahmaputra river (Rashid et al., 2021). Lower sections of rivers regularly
change course as a result of tectonic tilting, hydrological variability, and sedimentological readjustments
(Agnihotri et al., 2020; Talukdar and Pal, 2017, Talukdar and Pal, 2018, Saha and Pal, 2019, Nawfee et al.,
2018, Dewan et al., 2017) and the junction of the Ganga and Jamuna rivers is no exception (Rashid,
2020; Mahmud et al., 2020; Dewan et al., 2017). Any alterations, either natural or anthropogenic, might
cause a shift away from dynamic equilibrium (Sinha et al., 2014; Dewan et al., 2017; Rashid et al., 2021;
Mahmud et al., 2021). As a result, channel instability may occur, producing changes in channel shape
and pattern (Dewan et al., 2017).

Many geomorphologists have observed that channel planform dynamics is a significant issue in
Himalayan rivers, which have always switched channel in their lower reaches (Dewan et al., 2017; Rudra,
2010, 2014; Sinha et al., 2014; Gupta et al. 2013). Because of the large area coverage, synoptic view, and
frequent data acquisition capability, satellite remote sensing data and historical topographic maps
provided an enormous opportunity for fluvial geomorphologists to understand channel planform
dynamics, particularly for long and extremely moveable rivers (Gupta et al. 2013). The use of remote
sensing and geographic information systems (GIS) to analyse and monitor river erosion and central line
movement is becoming more common (Pal and Pani, 2019; Agnihotri et al., 2020; Gupta et al., 2013; Rozo
et al., 2014; Ashwini et al., 2020; Jung et al., 2020; Yang et al., 2015). The advent of GIS has improved the
researcher's ability to identify planform features like as changes in length, centerline migration, and
sinuosity index, among others, by integrating pictures on river planform from various sources. It was
discovered that Landsat images may be utilised to categorise river lengths successfully. A research on
the examination of meandering and braiding features was recently completed, using the middle-lower
portion of the Ganga as the study reach (Pal, 2017). With the aid of Landsat images and streamflow data
over a longer period, the Ganga–Padma river system in Bangladesh was studied for planform changes
from 1973 to 2011. (Dewan et al., 2017). After examining the Ganga River's erosion–deposition data, it
was discovered that during the assessment period, roughly 57 km2 of land was lost on the right bank and
59 km2 was deposited on the left bank (Dewan et al., 2017).

According to earlier studies, the Ganga River's morphology changed dramatically after the installation of
the Farakka barrier (Aswini et al., 2020; Pal and Pani, 2019; Dewan et al., 2017; Rudra, 2014; Agnihotri et
al., 2020; Anand et al., 2018; Sinha and Ghosh, 2012; Raj and Singh, 2020). There have been studies
conducted on the upstream and downstream portions of the Farakka barrage on the Ganga River (Rudra,
2014; Agnihotri et al., 2020; Anand et al., 2018; Sinha and Ghosh, 2012; Raj and Singh, 2020). However,
there have been no contemporary studies on the morphological alterations of the Ganga-Jamuna River,
taking into account both the Ganga river downstream of the Farakka barrier and the Jamuna river
confluence. Thus, the current study attempts to identify historical changes in the planform of the Ganga-
Jamuna River confluence using dynamic fluvial features obtained from Landsat images taken at various
times. This study is being carried out to investigate the planform dynamics of the Ganges-Jamuna

                                                   Page 3/30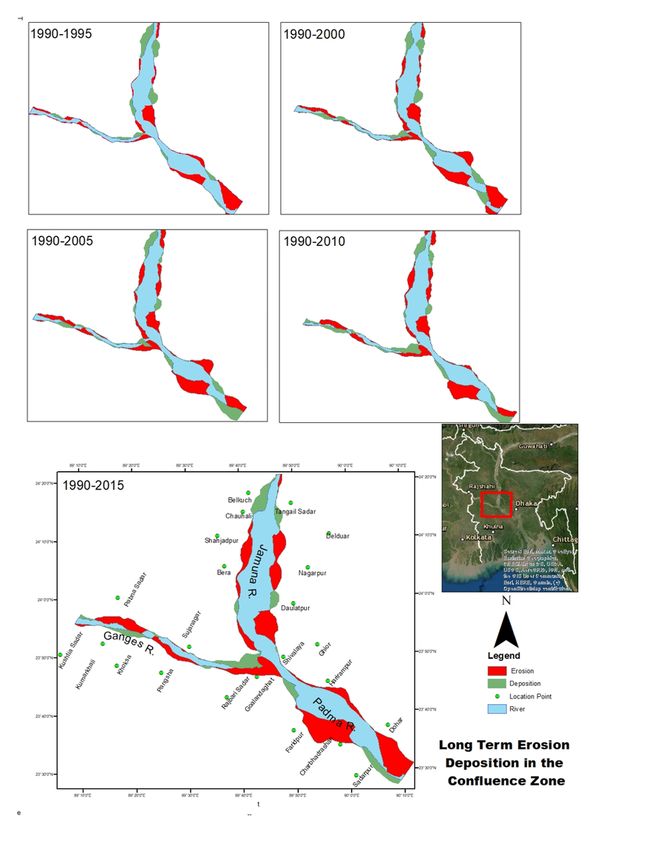
confluence zone during 1990-2015 using Landsat sattelite images. The objectives of this study are as
follow:

  1. To assess the bank shifting near the confluence of the Ganges, Jamuna and Padma rivers in short
    term and long term basis.
  2. To find out the trends on bank line shifting.
  3. To quantify the short term and long term erosion and deposition.
  4. To determine the variation of river widths in different years.

2. Materials And Methodology
2.1 Study area

The Brahmaputra & Ganges Rivers both originated from glaciers in the Himalayas. The Brahmaputra
flows through China, India, and Bangladesh over a length of 2900 km (Islam et al., 1999) and has a
drainage area of about 573,500 km2 of which only 8 percent is inside Bangladesh (Hassan et al., 1999).
Whereas the Ganges has a basin area of over 1.1 million km2 with only 4% of the catchment lying in
Bangladesh. The Ganges-Brahmaputra system brought in sediments during the post-pleistocine period
that shaped the Bengal deep sea fan (Biswas, 1992). The lower Brahmaputra, prominently known as
Jamuna, has a length of 240 km from the point of entry into Bangladesh to its confluence point with the
Ganges. It is very dynamic in nature due to its multi-channel split offs around the bars followed by rejoin,
giving it a braided shape in the process. Jamuna has an average channel width of about 11 km (Sarkar et
al., 2003). In this study, we selected a reach of 60 km from the confluence point to upward. The discharge
of Jamuna ranges from 3000 cumec to 100,000 cumec with a bankful discharge of approximately 48000
cumec (Hossain, 1992). The annual monsoon governs the water and sediment discharge of the Jamuna.
The flow of Jamuna reaches its peak in July or early August. The catchment has an annual average
precipitation of 1900 mm with more than 80% of it occurring during the 5 months of the monsoon (EGIS,
2002). The sandbars of the Jamuna river, locally known as ‘Char’ encompass about 1700 square
kilometers and are used mainly for rice cultivation by the char dwellers. (EGIS, 1999). The movement of
these bars, islands, along with both the banks of Jamuna, is a very common phenomenon, making it
harder for the char dwellers to cope with. Sometimes, the bank lines even shift in the range of kilometers
per year. In contrast, the Ganges is a meandering river less dynamic than the Jamuna as the bank
materials of the Ganges are not homogenous in terms of erodiblity. The Ganges is divided into two
reaches owing to its distinct hydrological characteristics. The upper part is from the border of Bangladesh
with India to the point of confluence and the lower part is from there to Chandpur, where there is another
confluence with Meghna. The length of the upper part is about 87 km while the lower part is about 108
km (Rashid, 1991). The Ganges has an annual average discharge of about 30,000 cumec and a bankfull
discharge of about 75000 cumec (FAP24, 1996). The lower part of the Ganges is much straighter than its
upper part because of the heavy discharges from two mighty rivers. The Ganges system is very important
as it delivers freshwater to the Sundarbans by keeping the salinity front from propagating upward from

                                                     Page 4/30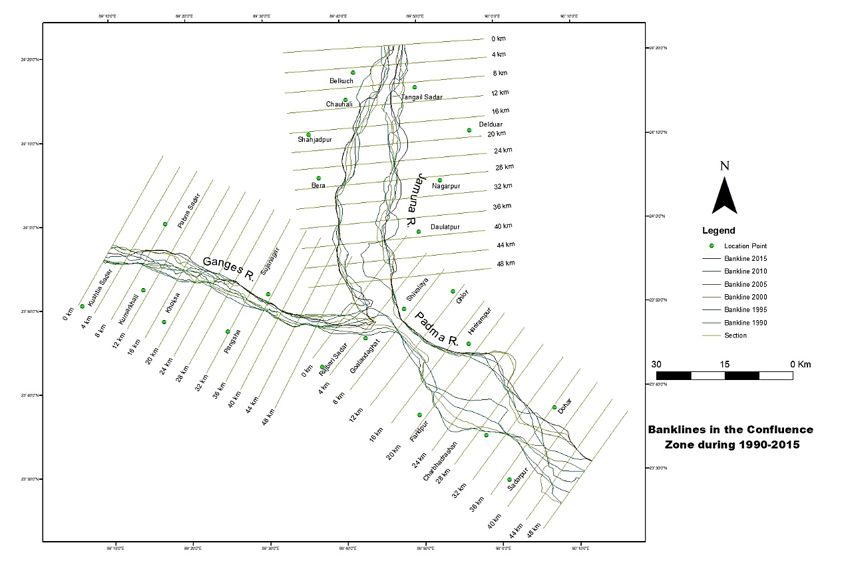
the sea. The Sundarban is the world’s largest mangrove system, having an area of approximately 10,000
square kilometers. So Ganges plays an important role in sustaining the ecosystem of the Sundarban. Like
Jamuna, the Ganges also displays great variability in discharge due to heavy rainfall during the monsoon
and melted snow from the Himalayans. So, both the riverbanks are prone to bank erosion and migration,
which results in land loss and displacement of the population. There is a scarcity of information
regarding the number of displaced people due to erosion. However, a study on the resilience and
vulnerability of 10 major deltas showed that the number of people displaced per year due to erosion
along the river banks of the Ganges delta is higher than 60000 (Bucx et al. 2000). This number is
expected to rise due to climate change (Moors et al. 2011).

In fact, Confluence of Ganges, Brahmaputra, Meghna and their tributaries has formed and shaped the
deltaic plains of Bangladesh. Two of the major rivers of GBM basin are Ganges and Jamuna (Lower
Brahmaputra) meets at a point named Goualondo Ghat situated at Rajbari district of Bangladesh.
Ganges and Brahmaputra are two of the world’s largest river system with a combined catchment area of
16, 30,700 km2 of which only 5.23% lies in Bangladesh (JRCB). Usually confluence morphology is
dictated by three factors namely discharge and sediment loads at upstream control, junction angle of
converging channels and bar formation at the downstream of the confluence (Mosley, 1976). However,
Jamuna river avulsed during the 19th century causing the confluence to shift dramatically to north
(Rahman et al. 2020). Jamuna is a geomorphologically active braided river where sediment loads are
greater than its carrying capacity (Baki, 2012). As a result, sandbars locally known as ‘chars’ separate
flow into multiple channels allowing the river to widen by eroding banks. Dynamics of Ganges-Jamuna
confluence is governed by this channel migration (Best, 1997). In contrast, Ganges is an anabranching
river (Kleinhans, 2010) with sinuosity ranging from 1.2-1.35 (Dewan, 2017). Eighty percent of the
channel’s annual discharge volume is drained to Bay of Bengal during the months of monsoon (July-
October). This highly seasonal variability of discharge coupled with development activities in the
upstream of Ganges have made bank erosion and bed scouring worse in recent times (Sharma et al.
2010). Banks of both Ganges and Jamuna are mostly made up of fine grained clay and silt carried by
these rivers (Datta and Subramanian, 1997). From 1973 to 2017 banks of Ganges, Padma(Lower
Ganges) & Jamuna have eroded around 1540 km2 leaving about 1.6 million people homeless
(Islam,2017). Significant amount of agricultural land was also lost which has created growing concern
about future food security of the country. Several studies have been carried out to understand
morphological characteristics of Ganges and Jamuna river. Dewan 2017 et al. used remotely sensed
imagery and found that Ganges lost 57 km2 lands on its right bank while gaining 59 km2 land on the left
bank during 1973-2011. Baki 2012 investigated short and long term erosion- accretion rate of Jamuna
River using landsat imagery from 1973-2003.

2.2 Materials and methods

Open-source time series satellite imagery (Landsat) has been used extensively to quantify morphological
changes in rivers worldwide. Wong (2020) also used long-term satellite imagery to study bar dynamics of
the Amite and Comite Rivers in the USA. However, moderate resolution Landsat images also provide a
                                                  Page 5/30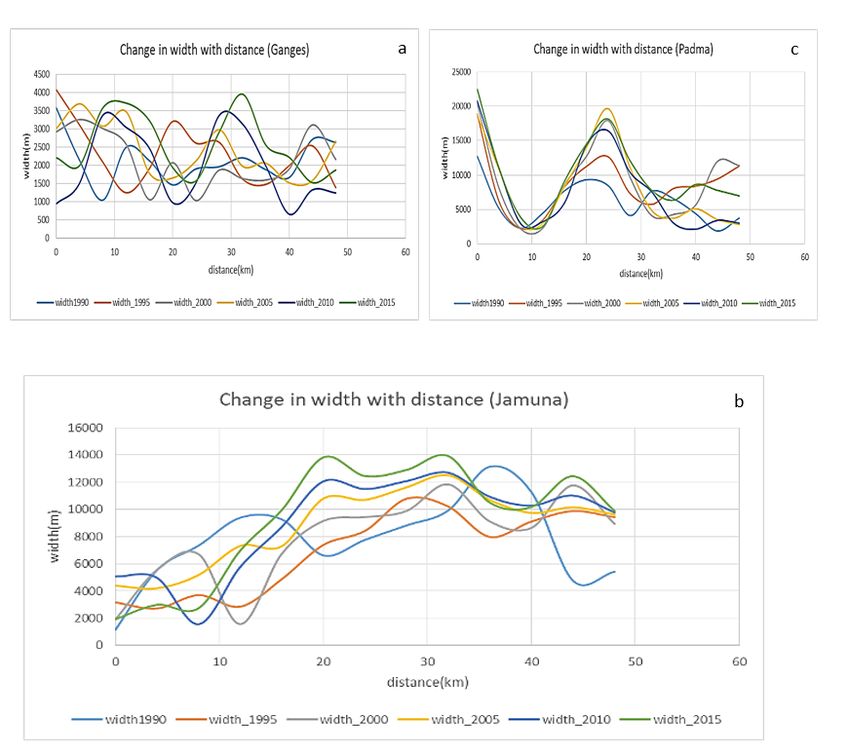
great scope to quantify riverbank migration. Several studies, including Raj (2020), Agnihotri (2018),
investigated the change in morphological parameters over the course of many years. For this study,
Landsat imagery from the years 1972-2015 has been selected for analysis. The details of Landsat
imageries used in the present study have been presented in the Table 1:

Table 1: Details of the Satellite Images

          Year    Date              Satellite data        Image Format                  Resolution

                                                                                        (in meter)

          1972    23-November       Landsat MSS           TIF Format (Geo-referenced)   60

          1990    23-December       Landsat 4-5TM         TIF Format (Geo-referenced)   30

          1995    16-January        Landsat 4-5TM         TIF Format (Geo-referenced)   30

          2000    24-February       Landsat 4-5TM         TIF Format (Geo-referenced)   30

          2005    09-December       Landsat 4-5TM         TIF Format (Geo-referenced)   30

          2010    08-February       Landsat 4-5TM         TIF Format (Geo-referenced)   30

          2015    07-January        Landsat 8OLI          TIF Format (Geo-referenced)   30

To obtain cloud free imagery December to February time frame was selected, as it is the dry season when
the river flows with adequate discharge to fill the main channel and yet remains relatively constant on a
year-to-year basis (Gupta et al. 2013). Simple pre-processing of satellite datasets was performed for
these datasets. Using the layer stack technique in ERDAS software, the satellite images was layered in
one file (single layer). As a result of this procedure, a False Color Composite (FCC) image was created.
Geometric rectification and subsetting were two important processes in extracting the image of the study
region. For the geometric correction of the single-layered picture, the georeferenced toposheet in raster
format was utilised as reference data. GCPs were found in both the toposheet and satellite image (2015
image) during geometric rectification. The overall Root Mean Square (RMS) error was assessed to be less
than 0.5 pixel in the satellite image. The Auto Sync work station tool in ERDAS Imagine Software was
then used to register multitemporal images (1990-2015). The 2015 Landsat 8 image was used as the
reference image. The Landsat 4-5TM images were registered and projected to the UTM WGS 1984 datum
based on the reference image.

The study area was divided into three segments, namely Ganges, Padma & Jamuna. Each segment was
then divided into 13 equal sub segments by 4 km distance for each segment. The total length for each
river reaches extending upto 48 km. A total of 39 sections were generated according to the determined 4
km distance. The combine portion of the three big river segments fall under the downward Padma River.
Figure 2 showed details of the segments including the different location place and bankline of three rivers

                                                     Page 6/30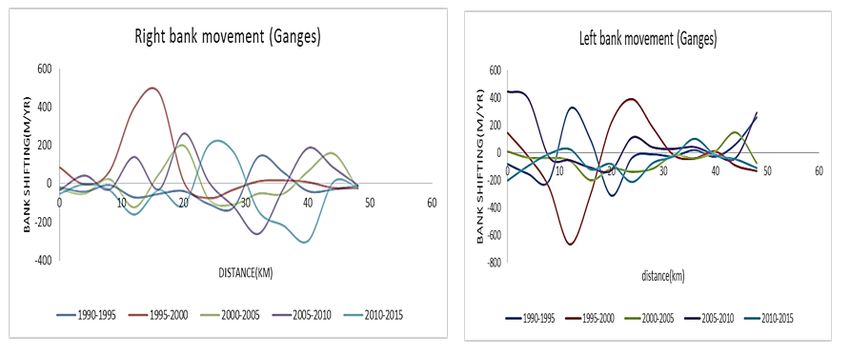
for 5 years intervals from 1990 to 2015. Figure 2 shows that the bankline of the Padma River is prone to
scatter shifting, which occurs due to the combined flow of the upper river.

2.2 Methods for analyzing bank line shifting and channel width changes:

To analyze the bank line and channel width dynamics, the whole work has been performed in ArcGIS 10.5
software. To perform the analysis, the bank lines were digitized from all geo-referenced images. A bank
line is defined as the feature that separates the outer edge of a river channel from the floodplain. All
selected satellite images were carefully analyzed for bank lines and boundaries using the software at a
scale of 1:50,000. Bankline digitization in a consistent manner is one of the important aspects when
changes in the planform, pattern, or position of the channel are being monitored. Digitization of bank
lines from satellite images was carried out using ArcGIS software.

The bank line is taken as the linear feature that separates the outer margin of the river channel from the
flood plains. Hence, all sand bodies (bed and bar features) visible in an image are considered to be part
of the channel except for coarse sediment that is spread over the flood plains during floods that spill over
the bank.

Variation of channel width was analyzed by measuring the distance between the extreme edges of the
left and right bank, including mid channel sandbars. 39 sections were created at equal distances to
evaluate the bank's migratory trend. To quantify the shifting of bank lines, digitised bank lines from two
different years were superimposed on one another.

2.3 Method for measuring sinuosity

The degree of meandering in a river channel is determined by river sinuosity. The ratio between the length
of the river bed (which is channel length) and the shortest distance of the river bed from beginning to
finish is the sinuosity of a river (which is valley length). With more wandering, the sinuosity grows.

Where, SI denotes the sinuosity index, while AC and AV are channel length and valley length.

The sinuosity of the river was computed using Eq.(1) after establishing the mid-channel line of river
courses using the HWATH's tool, which is also an ArcGIS extension (Garca, 2014).

2.4 Mapping of erosion and deposition

The river channel polygons for the years 1990, 1995, 2000, 2005, 2010 and 2015 have been overlaid.
After superimposing these polygons representing river channel erosion and deposition of the research
region owing to river course alteration, long and short term changes were estimated for both the left and
right banks (Deb and Ferreira, 2015). The river flows from north to south, instead of using the terms left
                                                  Page 7/30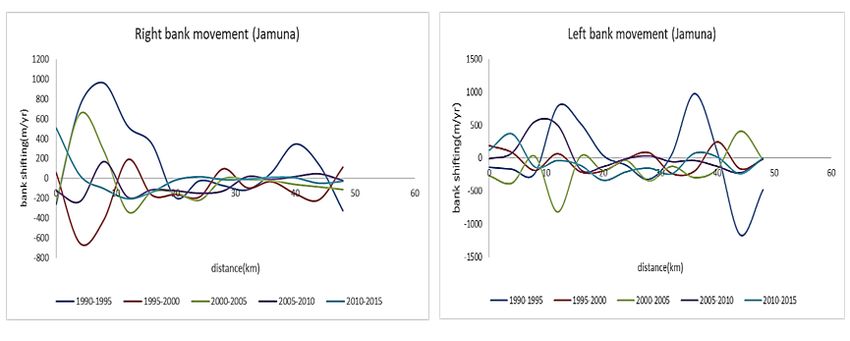
and right banks in the analysis, the terms east and west bank could also be employed. Between 1990-
1995, 1990-2000, 1990-2005, 1990-2010, and 1990-2015, the river's erosion and deposition area was
retrieved using the overlay tool in ArcGIS 10.6.

The 1972 image was digitised for qualitative examination of very long-term change bank lines and char
lands. After that, the most recent image accessible as a base map in ESRI's ArcGIS software was
compared.

3. Results
3.1 Dynamics of river width

River width is an important morphological feature that determines the extent of the river. Figure 4 depicts
the variations in river width over time and space in all of the branches that converge at the confluence.

Figure 3 depicts the morphological instability of the river, which demonstrates how the breadth of the river
fluctuates over time. During this time, Padma's range of variation between maximum and minimum
breadth had widened substantially. Jamuna's average width stayed constant from 1990 to 2010, however
from 2010 to 2015, it was expanded to 1 kilometre. Throughout the research period, Ganges' maximum
and lowest width ranges are very consistent.

The average, maximum, and minimum widths for the Ganges and Padma parts follow a similar trend, as
seen in Fig 3. In the case of the Jamuna River, however, no such tendency was seen. Figure 4 depicts the
spatial pattern of this shift, which shows that the variance in width change as a function of Padma's
distance follows a similar pattern in different years. The Ganges and the Jamuna, on the other hand, do
not follow any pattern. The breadth of the Jamuna is rising in the downstream direction. The greatest
reduction in width was found along the Ganges part of the confluence at the chainage 0 km stretch at
Kushtia Sadar, where the breadth fell by about 3 km between 1995 and 2010. Similarly, between the
1990s and 2000s, the largest width change on the Jamuna stretch was seen at a chainage 12 km portion
near Delduar. During this time, the breadth of this stretch narrowed by about 8 kilometres. In the instance
of the Padma stretch, the river's breadth rose by roughly 10 kilometres in the part near Faridpur, when the
chainage was 24 kilometres.

3.2 Bar Movement & sinuosity:

Extremely dynamic The Ganges-Jamuna confluence shows the net effect of these morphodynamic
processes in the form of a southern movement of the confluence point from 1972 to the present. The
changing tendency and position of the Jamuna River's widest channel altered over this time period. The
broadest channel has a propensity to dominate the right bank of the braidplain in the early stage before
lateral migration in the later stage. Multi-channel flow was prevalent around big islands that were
forested and therefore established. The confluence's meandering Ganges section likewise exhibits a
gradual southerly movement, with bars moving into the confluence zone.

                                                 Page 8/30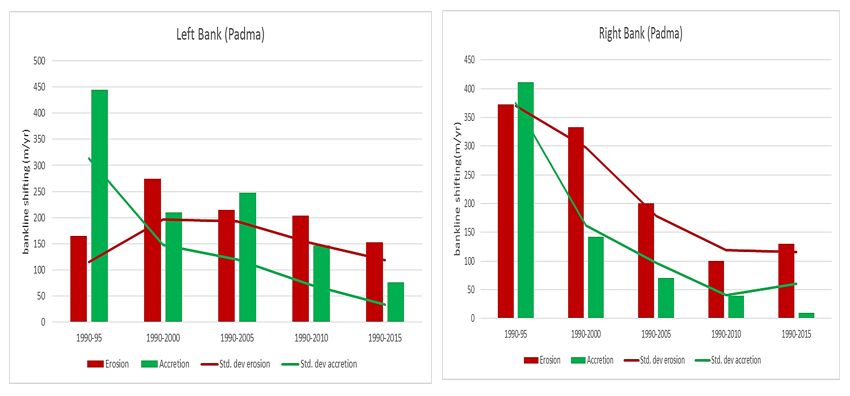
During this time span, the sinuosity of the Ganges section fluctuates from 1.03 to 1.1. Between 1972 and
2015, the sinuosity of the Ganges section reduced. The number of bar spaces has grown qualitatively
throughout the years.

3.3 Bank line shifting

Table 2 shows the average bank erosion and accretion rates for the left and right banks of the confluence
of the Ganges, Jamuna, and Padma at 5-year intervals. Even though it would be ideal to have annual
satellite images, this may not always be possible in practise because Landsat images are taken on a 16-
day cycle and a clear Landsat image for the study site at a specific time of year may not always be
available because the February images may suffer from partial or major cloud cover in the study area in
some years.

Table 2: Short term analysis of Mean Erosion & Accretion Rate (Ganges, Jamuna & Padma segment)

The left bank of the Ganges has a mean short-term erosion rate of 64.5 m/y, whereas the right bank has a
rate of 105.2 m/y. The left bank of the Jamuna has a mean short-term erosion rate of 141.23 m/y,
whereas the right bank has a rate of 210 m/y. Padma's mean short-term erosion rate is 240.4 m/y on the
left bank, and 281.1 m/y on the right bank. The mean accretion rates for the Ganges, Jamuna, and
Padma rivers on the left bank are 115.4 m/y, 239.1 m/y, and 303.2 m/y, respectively, whereas the right
banks are 133.6 m/y, 220.6 m/y, and 152.2 m/y. Between 2005 and 2010, the Ganges had maximum
erosion of 297.2 m/y and maximum accretion of 473.9 m/yr (1995-2000). The highest erosion and
accretion rates on the right bank of the Ganges are 664.544 m/yr (1995-2000) and 445.4 m/yr (2005-
2010), respectively. The highest erosion and accretion rates on the left bank of the Jamuna are 652.6807
m/yr (1995-2000) and 969.2 m/yr (1990-1995), respectively. The highest erosion and accretion rates on
the right bank of the Jamuna are 815 m/yr (2000-2005) and 782.9 m/yr (1990-1995), respectively. The
highest erosion and accretion rates on the left bank of the Padma are 781 m/yr (1990-1995) and 1756

                                                Page 9/30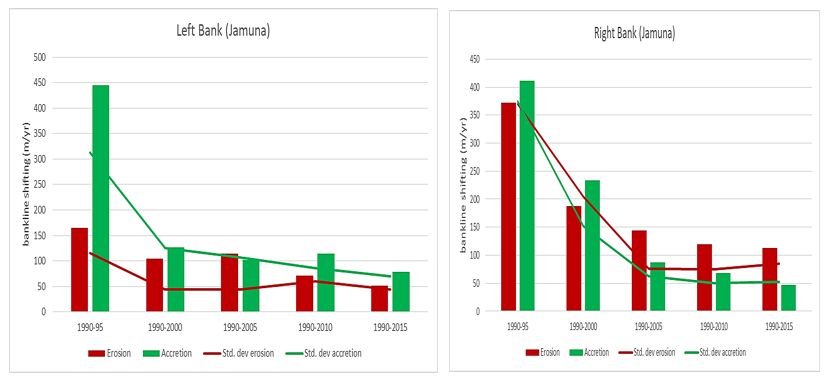
m/yr (2000-2005), respectively. The highest erosion and accretion rates on the right bank of the Padma
are 1118 m/yr (1990-1995) and 727 m/yr (2005-2010), respectively. Table 2 demonstrates that erosion
has grown along the left bank of the Ganges portion throughout the research period, but erosion has
decreased along the left bank of the Padma section till 2010. In compared to the preceding five years,
erosion rose by over 100% from 2010 to 2015. During the research period, erosion on the left bank of the
Jamuna has decreased. The right banks of the Ganges, Jamuna, and Padma segments, on the other
hand, have seen a very uneven erosional pattern.

The Padma segment's left bank has the most erratic accretion propensity. In comparison to the preceding
five years, the accretion tendency increased nearly thrice between 2000 and 2005. However, Padma
section showed a relatively low mean accretion of 9.85 m/yr during the previous 5 years of study.
Between 2005 and 2010, accretion on the left bank of the Jamuna fell dramatically. Throughout the study
period, the left bank of the Ganges exhibits an almost consistent rate of accretion. However, no regular
pattern of accretion was seen on the right bank of any segments.

The right bank of the Ganges is very unstable and shows continuous movement throughout the
confluence zone, as illustrated in Figure 6 from a short term examination of the Ganges part of the
confluence region. However, channel shifting may be seen in the upstream area of the confluence zone on
the left bank of the Ganges. The left bank of the Ganges remained relatively steady around the site of
confluence.

Jamuna's short-term alterations are depicted in Figure 7. The upstream portion of the confluence zone is
more mobile than the zone at the site of confluence in the event of left bank movement, as seen in the
diagram. The right bank of the Jamuna River follows a similar pattern.

Data from the Padma section during a 5-year period reveals that the downstream portion of the right
bank is unstable, with irregular movement, but the area near the confluence is less mobile. The left bank
of the Padma, on the other hand, is relatively stable near the confluence, but the downstream part has a
larger changing propensity, as seen in Figure 8.

For the Ganges, Padma, and Jamuna portions, long-term changes in the confluence region are also
examined. This study gives a clear picture of these rivers' changing tendencies. Figure 9 clearly indicates
that, with the exception of the yatra, the main pattern of the left bank of the Ganges is one of deposition
throughout the year 1990-2005.

The rate of deposition, on the other hand, has steadily reduced over time. The standard deviation of
erosion has remained relatively consistent, implying homogeneous erosion in all portions of the
confluence zone along the Ganges. However, between 1990 and 2000, the standard deviation for
deposition instances was greater, which might indicate a lack of uniformity in deposition along the
sections. Deposition occurred on the right bank of the Ganges between 1990 and 2000, however the bank
quickly became prone to erosion and has continued to do so in recent years.

                                                 Page 10/30
In the long term, the mean erosion and deposition tendency in the left bank of the Jamuna has stayed
comparable, although there has been a depositional trend in recent years, as seen in Figure 10. On the
other hand, In the long run, the right bank of the Jamuna is exhibiting erosional characteristics.
Figure 11 reveals that Long Term bank shifting trend has showed mostly erosional tendency in both the
banks of Padma.
It can be seen from the Figure 12 that during the five year span from 1990 to 1995 the confluence zone
showed erosional tendency in the lower portion of Jamuna at Shivalaya. Areas like Dohar, During this
time, Charbhadrashan, Rajbari sadar, and Pabna sadar all experienced significant erosion. With the
exception of the Dohar region, this erosional trend continued for the following five years. During this time,
Dohar did not experience any severe erosion. As illustrated in Figure 13, the erosional tendency on the
right banks of the Jamuna and Padma Rivers was less severe from 2000 to 2010. During this time, the
right bank of the Padma River saw considerable accretion. However, the riverbanks of the Padma River in
Dohar have been severely eroded in recent years. The erosional tendency can be ascribed to the creation
of sand bars in rivers; as a result, flow is directed towards the rivers' banks, producing erosion. Table 3
summarises the findings of the study.
Table 3: Short & Long term analysis of Erosion & Acretion in terms of area
Short Term Long Term
Year Erosion Deposition Year Erosion Deposition
(sq km) (sq km) (sq km) (sq km)
1990-1995 269.19 174.16 1990-1995 269.19 174.16
1995-2000 194.09 126.72 1990-2000 376.33 214.43
2000-2005 172.03 110.92 1990-2005 409.85 212.17
2005-2010 109.67 173.61 1990-2010 370.53 239.66
2010-2015 201.23 38.05 1990-2015 487.89 173.28
Table 3 shows that during the course of 25 years, the confluence zone lost 487.89 sq km of area while
gaining just 173.28 sq km. It can also be noted that erosional tendency has been on the decline in the
short term between 1990 and 2010. However, between 2010 and 2015, the degraded area nearly doubled
in contrast to the previous five years. Meanwhile, there is no discernible pattern in the deposition
tendency.
4. Discussion
For investigating the bankline movement of the Ganga-Jamuna River, the accuracy of the coarser
resolution Landsat-MSS (80 m) data should be lower than the higher resolution Landsat TM and OLI (30
Page 11/30m) data. Several studies have reported on the effective use of density slicing of Landsat-OLI, TM, or MSS
data to define water bodies, although without comparing the two types of Landsat data quantitatively.
According to Mohajane et al. (2018), TM and OLI digital data are generally more helpful than MSS data in
mapping homogenous, near-urban land covers, but they may be less effective in mapping heterogeneous
urban areas than MSS data. In other words, TM data may not necessarily be more valuable than MSS
data, according to Mohajane et al. (2018). There have also been successful investigations of MSS data-
based multi-spectral classifications of water borders (Bhaskaran et al. 2010).
Ganga-Jamuna's mean channel width is around 11 km, which is significantly larger than the resolution of
Landsat satellite data, particularly Landsat-TM and OLI. The radiometric values of pixels depicting river
banks and water regions ought to be sufficiently homogenous, and the investigation must be suitable for
detecting Ganga-Jamuna backline movement. This is due in part to the fact that the Ganga-Jamuna is a
very active river, and the shift in the bankline between certain processed Landsat photos should be
apparent. The accuracy of identifying differences between two pictures might be somewhere between the
resolution of the satellite data, such as between 30 and 80 m, or better.
The erosion and accretion rates vary considerably throughout the river, and they appear to be impacted by
the river's meandering feature and flow direction, according to early analyses of overlay maps of bank
movement and bank movement as a function of distance during 1990–2015. The magnitude of
accretion on the left bank has typically been greater than the magnitude of erosion on the right bank, and
their rates have only slightly changed from 1990 to 2015, as predicted. Between 1990 and 2015, the left
bank had more accretion than erosion, resulting in lower net movement rates than the right bank, which is
in line with earlier research by Sarif et al. (2021).
The mean erosion and accretion rates estimated from the short-term analysis, where the migration rate is
determined based on short-term changes between six accessible consecutive pictures, are 227 and 271
m/y on the left bank and 187 and 148 m/y on the right bank. In contrast, for the long-term analysis, the
average erosion and accretion rates are 90 and 104 m/y on the left bank, 75 and 50 m/y on the right
bank, respectively, which are identical with the work of Pal and Pani (2019) and Sarif et al. (2021). The
right bank experienced more severe erosion, resulting in a quicker migration rate than the left bank, which
experienced both erosion and accretion, resulting in relatively modest net movement rates (Sarif et al.,
2021). The Ganga-Jamuna River's average short and long-term migration findings show a particularly
dynamic form of erosion and accretion processes that contribute to channel shifting, as seen by its high
short-term range of erosion and accretion rates. Because, Klaassen and Masselink (1992) found that
bank erosion in curved channels occurred at rates ranging from 0 to 500 m/y, with a maximum of around
1000 m/y, and that it occurred mostly at 90 degrees to the major flow direction (in the eastewest
direction). However, between 1990 and 2015, the right bank's declining erosion and accretion patterns
were more constant than the left bank's.
The rivers are constantly transferring water and sediment loads downstream. The Ganga, like other
tropical rivers, has certain distinctive fluvio-geomorphological features. Because more than 80% of yearly
Page 12/30flow passes during the monsoon months, the hydrograph of the Ganga as measured and depicted is
significantly skewed. In September 1998, the maximum peak discharge at Farakka was around 76456
m3/s (Rudra, 2010). The lean season discharge drops to less than 1557 m3/s, prompting tensions
between India and Bangladesh over water sharing (Rudra, 2010). Many scientists have calculated the
amount of suspended silt transported by the river each year. Rudra claims it to be 736 million tonnes
(2010). Explaining the sediment budget of the Ganga–Brahmaputra system, Wasson (2003) determined
that Himalayan tributaries provide more than 90% of the sediment load in the Ganga, whereas peninsular
tributaries contribute less than 10%. Human interaction in the fluvial regime disrupts dynamic equilibrium,
and altering course processes are either slowed or hastened. Therefore, the long-term migration rate for
both banks is lower than the short-term counterpart, owing to human interventions such as the
development of bank protective mechanisms (Rudra, 2014). Human interventions on the Ganga-Jamuna
River over the last 50 years have included: (1) On April 21, 1975, a large barrage at Farakka was opened. It
is near the point where the river's main flow reaches Bangladesh, while the tributary Hooghly (also named
as Bhagirathi) flows through West Bengal towards Kolkata. (2) Kanpur has the Lav Khush Barrage over
the Ganges River, and (3) Tehri Dam was built on the Bhagirathi River, a tributary of the Ganges. It's 1.5
kilometres downstream of Ganesh Prayag, where Bhilangana and Bhagirathi converge. After Devprayag,
Bhagirathi was renamed Ganges, and Bansagar Dam was constructed on the Sone River, a tributary of
the Ganges, for irrigation and hydropower, (5) the construction of a number of bank protection structures
since the early 1960s, such as the Sirajganj town protection work, which began during the British period
and was strengthened in 1964 with brick mattressing, which was washed away in 1969; (6) In 1994–
1998, the Jamuna Bridge Guide Bund (3.2 km on both banks) and Bhuapur Hard Point (5 km upstream of
the Jamuna Bridge) were built. (7) In 1996–1998, the Sirajganj Hard Point, which included the groyne
with the revetment, was built as part of the River Bank Protection Project (RBPP). (8) Under the FAP 21/
22 programme, revetment test structures at Bahadurabad and Ghutail, as well as a groyne test structure
at Kamarjani, were erected in 1996–1997; and (9) the BWDB sponsored Kalitola and Sailabari Groynes
were built in 1980 and 1978, respectively.
The variation in river width between 1990 and 2015 is analogous to that reported by Gupta et al. (2013)
and Gupta (2012), who found that the river widened from 1990 to 2015 but then stayed constant. The
breadth of a river will often expand under the impact of erosion and shrink under the effect of accretion if
the discharge rate does not change significantly. However, assuming that both the sediment load and the
discharge rate stay constant, a common morphological feature of rivers is that as river width grows,
erosion rates should decrease since river flow velocity decreases, and vice versa. In the same way, as a
river narrows, the rate of accretion should accelerate.
For the short-term study, changes in the right (left) bank's erosion (accretion) rate follow the general
morphological pattern of river bank migration, but not so for the right (left) bank's accretion (erosion) rate.
When the left (right) bank undergoes accretion (erosion), the basic morphological characteristic of river
movement appears to apply, but not when the left (right) bank undergoes erosion (accretion). Only the
right bank erosion rate and the left bank accretion rate obey this concept, owing to complexities created
Page 13/30by the intricate interactions of both erosion and accretion processes, as well as the Jamuna River's
meandering characteristic ((Bomer et al., 2020).
For the long-term analysis, the observed erosion rate for the right bank and accretion rate for the left
partly follow the general morphological principle of river migration, i.e., as a river widens, erosion rates
generally decrease because the velocity of river flow decreases, and vice versa, assuming that both the
sediment load and the discharge rate remain roughly unchanged. Because of its braided, meandering, or
anastomosing characteristics, the Jamuna River has problems (for example, unanticipated shifts in bank
erosion or accretion may occur) (Sarker et al., 2014; Best et al., 2007; Richardson and Thorne, 2001).
Instead of island migration, due to the shifting of sediment loads produced by each flood, some islands
may vanish or new islands may develop after a flood. According to Sarker et al. (2014), about 68 percent
of the islands are under the age of six years, or have lasted between one and six years. According to a
frequency analysis of changes in the number of islands in relation to their size in hectares (ha) within the
Jamuna River, islands larger than 150 ha are clearly more stable (fewer temporal changes in size, shape,
and location) than small islands smaller than 50 ha, which tend to be very unstable and subject to fairly
major changes as observed in this 1990–2015 study period.
5. Conclusion
From the analysis, it can be seen that the Ganges-Jamuna confluence has undergone significant changes
over the past few decades. In this paper, these changes are quantified in terms of river width change,
bank line shifting & area of erosion or deposition. It is noted that the maximum width of the Ganges
section is 4078.10 m, observed during the year 1995. Similarly, the maximum width of the Jamuna &
Padma section was 13925 m & 22479.88 m consecutively observed during the year 2015. The maximum
bank line shifting in the left bank of the Ganges segment is 473.92 m/yr observed near Pabna Sadar at
chainage 16 km during 1995–2000. Likewise, the maximum bank line shifting in the right bank of the
Ganges segment is 394.83m/yr observed near Kumarkhali at chainage 4 km during 2005–2010. In the
case of the Jamuna segment, the maximum left bank line shifting is 959.30 m/yr observed near Tangail
at chainage 8 km during 1990–1995. Similarly, maximum right bank line shifting is 975.12 m/yr
observed at chainage 36 km during 1990–1995. The Padma segment also shows significant migration
with a maximum left bank shifting of 1756 m/yr being observed at chainage 48 km near Dohar during
2000–2005. The maximum right bank shifting of the Padma segment is 1502.99 m/yr being noted at
chainage 44 km near Sadarpur during 1990–1995. In terms of area, the confluence zone is losing land at
an alarming rate. It is observed that, confluence zone has lost 201.23 sq km. of land during 2010–2015;
in the same period, the zone has gained only 38.05 sq km. area. This means a net decrease of 163.18 sq
km took place during the last 5 years. This may occur due to the various anthropogenic activities in this
region.
Huge sediment deposition boosts attached bar and island bar, where agricultural farmland, plant cover,
and population agglomeration grew, according to this research paper. Due to repeated morphological
Page 14/30changes, socioeconomic condition has deteriorated. Several built barrages and dams are thought to be a
key source of morphological changes in the river's downstream. This structural structure alters river
morphology by introducing island bars, connected bars, multichannel, increased sedimentation, and a
reduction in water discharge flow velocity. The agriculture system and river aquatic ecology are greatly
influenced by various morphological characteristics generated by morphological changes. In addition to
the study areas, there are some policy implications and management strategies. Any unplanned artificial
constructions, like dams and bridges, can have a negative influence on flow velocity and direction,
causing massive sedimentation, bank-line shifting, and bank narrowing, among other things. To reduce
climatic impacts, the government and other nonprofit organizations should focus on minimizing the
vulnerability of multiple fluvial hazards by stabilizing their banks through numerous restoration
mechanisms such as riparian buffer zones, embankment flood protection systems, waste dumping
processes, and toxic materials.
Declarations
Acknowledgement: Authors would like to thank the USGS for providing free satellite images of this study.
Authors also thank King Khalid University, Saudi Arabia for collaboration and support.
References
1. Abul Basar M, Baki, Thian Yew Gan, Riverbank migration and island dynamics of the braided
Jamuna River of the Ganges–Brahmaputra basin using multi-temporal Landsat images, Quatern Int,
263, 2012, Pages 148–161, ISSN 1040–6182, https://doi.org/10.1016/j.quaint.2012.03.016.
(http://www.sciencedirect.com/science/article/pii/S1040618212001681)
2. Agnihotri AK, Ohri A, Mishra S (2020) Channel planform dynamics of lower Ramganga River, Ganga
basin, GIS and remote sensing analyses. Geocarto International 35(9):934–953
3. Akhter S, Eibek KU, Islam S, Islam ARMT, Chu R, Shuanghe S (2019) Predicting spatiotemporal
changes of channel morphology in the reach of Teesta River, Bangladesh using GIS and ARIMA
modeling. Quatern Int 513:80–94
4. Anand A, Kumar A, Patil RG (2018) Remote Sensing Based Approach on Recent Changes in Platform
of River Ganga from Mirzapur to Ballia. i-Manager's Journal on Future Engineering and Technology,
13(4), p.19
5. Arnaud F, Piégay H, Schmitt L, Rollet AJ, Ferrier V, Béal D (2015) Historical geomorphic analysis
(1932–2011) of a by-passed river reach in process-based restoration perspectives: The Old Rhine
downstream of the Kembs diversion dam (France, Germany). Geomorphology 236:163–177
6. Agnihotri AK, Anurag Ohri & Sachin Mishra (2018) Channel planform dynamics of lower Ramganga
River, Ganga Basin, GIS and Remote Sensing analyses, Geocarto International
7. Ashwini K, Pathan SA, Singh A (2020) Understanding planform dynamics of the Ganga River in
eastern part of India. Spatial Information Research, pp.1–12
Page 15/308. Best JL (1988) Sediment transport and bed morphology at river channel confluences. Sedimentology
35(3):481–498
9. Best JL, Ashworth PJ (1997) Scour in large braided rivers and the recognition of sequence
stratigraphic boundaries. Nature 387(6630):275–277
10. Best JL, Ashworth PJ, Sarker MH, Roden JE (2007) The Brahmaputra-Jamuna River, Bangladesh.
Large rivers: geomorphology and management, pp.395–430
11. Bhaskaran S, Paramananda S, Ramnarayan M (2010) Per-pixel and object-oriented classification
methods for mapping urban features using Ikonos satellite data. Appl Geogr 30(4):650–665
12. Biswas AK (1992) Indus water treaty: The negotiating process. Water Int 17(4):201–209.
https://doi.org/10.1080/02508069208686140
13. Biswas RN, Islam MN, Islam MN, Shawon SS (2021) Modeling on approximation of fluvial landform
change impact on morphodynamics at Madhumati River Basin in Bangladesh. Modeling Earth
Systems Environment 7(1):71–93
14. Bomer EJ, Wilson CA, Hale RP, Hossain ANM, Rahman FA (2020) Surface elevation and
sedimentation dynamics in the Ganges-Brahmaputra tidal delta plain, Bangladesh: Evidence for
mangrove adaptation to human-induced tidal amplification. Catena, 187, p.104312
15. Bora M, Goswami DC (2021) RS-GIS based assessment of the impact of Hatimura embankment on
the channel planform of the Kolong River, Assam, India. Geocarto International, pp.1–17
16. Bucx T, Marchand M, Makaske A, van de Guchte C (2010) Comparative assessment of the
vulnerability and resilience of 10 deltas – synthesis report. Delta Alliance report number 1. Delta
Alliance International, Delft-Wageningen
17. Chandan R, Vivekanand Singh (2020) Assessment of planform changes of the Ganga River from
Bhagalpur to Farakka during 1973–2019 using satellite imagery. ISH Journal of Hydraulic
Engineering. DOI:10.1080/09715010.2020.1812123
18. Datta DK, Subramanian V (1997) Texture and mineralogy of sediments from the Ganges-
Brahmaputra-Meghna river system in the Bengal Basin, Bangladesh and their environmental
implications. Environ Geol 30(3–4):181–188
19. Dewan A, Corner R, Saleem A, Rahman MM, Haider MR, Rahman MM, Sarker MH (2017) Assessing
channel changes of the Ganges-Padma River system in Bangladesh using Landsat and hydrological
data. Geomorphology 276:257–279
20. Dewan A, Corner R, Saleem, Ashty R, Masudur Md, Haider Md, Rafiqul, Rahman Md, Mostafizur,
Sarker, Maminul H, Assessing channel changes of the Ganges-Padma River system in Bangladesh
using Landsat an hydrological data, Geomorphology (2016), doi: 10.1016/j.geomorph.2016.10.017
21. East AE, Jenkins KJ, Happe PJ, Bountry JA, Beechie TJ, Mastin MC, Sankey JB, Randle TJ (2017)
Channel-planform evolution in four rivers of Olympic National Park, Washington, USA: the roles of
physical drivers and trophic cascades. Earth Surf Proc Land 42(7):1011–1032
22. EGIS (Environment and GIS Support Project for Water Sector Planning) (1999) Morphological
Dynamics of the Brahmaputra Jamuna River. Water Resources Planning Organization, Ministry of
Page 16/30Water Resources, Government of the People’s Republic of Bangladesh, Dhaka
23. EGIS Environment and GIS Support Project for Water Sector Planning (2002) Developing and
Updating Empirical Methods for Predicting Morphological Changes of the Jamuna River.
Environment and Geographic Information System (EGIS) Technical Note Series 29, Dhaka,
Bangladesh
24. Ettema R (2008) Management of confluences. In: Rice SP, Roy AG, Rhoads BL (eds) River
Confluences, Tributaries and the Fluvial Network. John Wiley & Sons, Chichester, pp 93–118
25. FAP 24 (Flood Action Plan 24) (1996) River Survey Project. Final Report No. 7, Ministry of Water
Resources. Government of the People’s Republic of Bangladesh, Dhaka
26. Ghosh B, Mukhopadhyay S (2021) Channel planform dynamics, avulsion and bankline migration: a
study in the monsoon-dominated Dwarkeswar river, Eastern India. Arab J Geosci 14(10):1–16
27. Guo X, Gao P, Li Z (2021) Morphological characteristics and changes of two meandering rivers in the
Qinghai-Tibet Plateau, China. Geomorphology, 379, p.107626
28. Gupta N, Atkinson PM, Carling PA (2013) Decadal length changes in the fluvial planform of the River
Ganga: Bringing a mega-river to life with Landsat archives. Remote Sens Lett 4:1–9
29. Gupta N (2012) Channel planform dynamics of the Ganga-Padma system, India (Doctoral
dissertation, University of Southampton)
30. Gupta N, Atkinson PM, Carling PA (2013) Decadal length changes in the fluvial planform of the River
Ganga: bringing a mega-river to life with Landsat archives. Remote sensing letters 4(1):1–9
31. Gupta N, Atkinson PM, Carling PA (2013) Decadal length changes in the fluvial planform of the River
Ganga: bringing a mega-river to life with Landsat archives. Remote sensing letters 4(1):1–9
32. Halder A, Mowla Chowdhury R (2021) Evaluation of the river Padma morphological transition in the
central Bangladesh using GIS and remote sensing techniques. International Journal of River Basin
Management, pp.1–15
33. Hasanuzzaman M, Gayen A, Shit PK (2021) Channel dynamics and geomorphological adjustments
of Kaljani River in Himalayan foothills. Geocarto International, pp.1–28
34. Hossain MM (1992) Total sediment load in the lower Ganges and Jamuna. Journal of the Institution
of Engineers Bangladesh 20(1–2):1–8
35. Islam MA, Parvin S, Farukh MA (2017) Impacts of riverbank erosion hazards in the Brahmaputra
floodplain areas of Mymensingh in Bangladesh. Progressive Agriculture 28(2):73–83
36. Islam MK, Dushtagir M, Rahman MM, Rahman M (2018) Changes in Planform and Meander bends
of Rivers in Southern Estuarine Region of Bangladesh and Its Implications on Development Project.
Changes, 6(1)
37. Joint Rivers Commission Bangladesh [JRCB]. No year. Basin map of the Ganges, the Brahmaputra
and the Meghna river. (Available at:
http://www.jrcb.gov.bd/sites/default/files/files/jrcb.portal.gov.bd/files/37a1f16a_51ea_496f
96ce_f369b2f577bc/Basin%20Map.pdf Accessed on: 2/10/2020)
Page 17/3038. Jung NW, Lee GH, Jung Y, Figueroa SM, Lagamayo KD, Jo TC, Chang J (2021) MorphEst: An
Automated Toolbox for Measuring Estuarine Planform Geometry from Remotely Sensed Imagery and
Its Application to the South Korean Coast. Remote Sensing, 13(2), p.330
39. Klaassen GJ, Masselink G (1992) Planform changes of a braided river with fine sand as bed and
bank material. In: Proceeding of 5th International Symposium, River Sedimentation, Karlsruhe (FR
Germany), vol. I, pp. 459e471
40. Kleinhans MG (2010) Sorting out river channel patterns. Prog Phys Geogr 34(3):287e326
41. Kong D, Latrubesse EM, Miao C, Zhou R (2020) Morphological response of the Lower Yellow River to
the operation of Xiaolangdi Dam, China. Geomorphology, 350, p.106931
42. Kuo CW, Chen CF, Chen SC, Yang TC, Chen CW (2017) Channel planform dynamics monitoring and
channel stability assessment in two sediment-rich rivers in Taiwan. Water, 9(2), p.84
43. Mahmud MI, Mia AJ, Islam MA, Peas MH, Farazi AH, Akhter SH (2020) Assessing bank dynamics of
the Lower Meghna River in Bangladesh: an integrated GIS-DSAS approach. Arab J Geosci 13(14):1–
19
44. Majumdar S, Mandal S (2020) Assessment of relationship of braiding intensities with stream power
and bank erosion rate through Plan Form Index (PFI) method: a study on selected reaches of the
upstream of Ganga river near Malda district, West Bengal, India. Sustainable Water Resources
Management 6(6):1–18
45. Mandarino A, Pepe G, Maerker M, Cevasco A, Brandolini P (2020) Short-term GIS analysis for the
assessment of the recent active-channel planform adjustments in a widening, highly altered river:
The Scrivia River, Italy. Water, 12(2), p.514
46. Midha N, Mathur PK (2014) Channel characteristics and planform dynamics in the Indian Terai,
Sharda River. Environmental management 53(1):120–134
47. Mohajane M, Essahlaoui A, Oudija F, Hafyani ME, Hmaidi AE, Ouali AE, Randazzo G, Teodoro AC
(2018) Land use/land cover (LULC) using landsat data series (MSS, TM, ETM + and OLI) in Azrou
Forest, in the Central Middle Atlas of Morocco. Environments, 5(12), p.131
48. Moors EJ, Groot A, Biemans H, van Scheltinga CT, Siderius C, Stoffel M, Huggel C, Wiltshire A,
Mathison C, Ridley J, Jacob D, Kumar P, Bhadwal S, Gosain A, Collins DN (2011) Adaptation to
changing water resources in the Ganges basin, northern India. Environ Sci Policy 14:758–769
49. Mosley MP (1976) An Experimental Study of Channel Confluences. J Geol 84(5):535–562
50. Nawfee SM, Dewan A, Rashid T (2018) Integrating subsurface stratigraphic records with satellite
images to investigate channel change and bar evolution: a case study of the Padma River,
Bangladesh. Environmental earth sciences 77(3):1–14
51. Pal R (2017) Meandering-braiding aspects of the middle-lower part of the Ganga River, India. Journal
of Indian Geophysics Union 21(3):191–197
52. Pal R, Pani P (2019) Remote sensing and GIS-based analysis of evolving planform morphology of
the middle-lower part of the Ganga River, India. The Egyptian Journal of Remote Sensing Space
Science 22(1):1–10
Page 18/3053. Pal R, Pani P (2019) Remote sensing and GIS-based analysis of evolving planform morphology of
the middle-lower part of the Ganga River, India. The Egyptian Journal of Remote Sensing Space
Science 22(1):1–10
54. Rahman MM et al (2020) Ganges-Brahmaputra-Meghna Delta, Bangladesh and India: A
Transnational Mega-Delta. In: Nicholls R, Adger W, Hutton C, Hanson S (eds) Deltas in the
Anthropocene. Palgrave Macmillan, Cham. https://doi.org/10.1007/978-3-030-23517-8_2
55. Raj C, Singh V (2020) Assessment of planform changes of the Ganga River from Bhagalpur to
Farakka during 1973–2019 using satellite imagery. ISH Journal of Hydraulic Engineering, pp.1–11
56. Rashid HE (1991) Geography of Bangladesh. The University Press Limited, second edition, Dhaka
57. Rashid MB (2020) Channel bar development and bankline migration of the Lower Padma River of
Bangladesh. Arab J Geosci 13(14):1–16
58. Rashid MB, Habib MA, Khan R, Islam ARMT (2021) Land transform and its consequences due to the
route change of the Brahmaputra River in Bangladesh. International Journal of River Basin
Management, (just-accepted), pp.1–38
59. Richard GA, Julien PY, Braid DC (2005) Case study: modelling the lateral mobility of the Rio Grande
below Cochiti Dam, New Mexico. J Hydraul Eng 131(11):931–941
60. Richardson WR, Thorne CR (2001) Multiple thread flow and channel bifurcation in a braided river:
Brahmaputra–Jamuna River, Bangladesh. Geomorphology 38(3–4):185–196
61. Roy AK, Mitra S (2020) Assessment of planform dynamics and anthropogenic stresses in the Balari
Island, Hooghly estuary, India. Spatial Information Research 28(2):227–239
62. Roy NG, Sinha R (2018) Integrating channel form and processes in the Gangetic plains rivers:
Implications for geomorphic diversity. Geomorphology 302:46–61
63. Rozo MG, Nogueira AC, Castro CS (2014) Remote sensing-based analysis of the planform changes in
the Upper Amazon River over the period 1986–2006. J S Am Earth Sci 51:28–44
64. Rudra K (2010) Dynamics of the Ganga in West Bengal, India (1764–2007): Implications for
science–policy interaction. Quatern Int 227(2):161–169
65. Rudra K (2014) Changing river courses in the western part of the Ganga–Brahmaputra delta.
Geomorphology 227:87–100
66. Saha TK, Pal S (2019) Emerging conflict between agriculture extension and physical existence of
wetland in post-dam period in Atreyee River basin of Indo-Bangladesh. Environ Dev Sustain
21(3):1485–1505
67. Sarif MN, Siddiqui L, Islam MS, Parveen N, Saha M (2021) Evolution of river course and
morphometric features of the River Ganga: A case study of up and downstream of Farakka Barrage.
International Soil and Water Conservation Research
68. Sarker MH, Akter J, Rahman MM (2013) Century-scale dynamics of the Bengal delta and future
development. In Proceedings of the International Conference on Water and Flood Management
(pp. 91–104). Dhaka, Bangladesh. https://edepot.wur.nl/317989. (Last accessed 20 August 2018)
Page 19/3069. Sarker MH, Huque I, Alam M (2003) Rivers, chars and char dwellers of Bangladesh. International
Journal of River Basin Management 1 (1)
70. Sarker MH, Thorne CR, Aktar MN, Ferdous MR (2014) Morpho-dynamics of the Brahmaputra–
Jamuna River, Bangladesh. Geomorphology 215:45–59
71. Sharma B, Amarasinghe U, Xueliang C, Condappa D de, Shah T, Mukherji A, Bharati L, Ambili G,
Quershi A, Pant D, Xenarios S, Singh R, Smakhtin V (2010) The Indus and the Ganges: river basins
under extreme pressure. Water Int 35(5):493–521
72. Sinha R, Ghosh S (2012) Understanding dynamics of large rivers aided by satellite remote sensing: a
case study from Lower Ganga plains, India. Geocarto International 27(3):207–219
73. Sinha R, Sripriyanka K, Jain V, Mukul M (2014) Avulsion threshold and planform dynamics of the
Kosi River in north Bihar (India) and Nepal: A GIS framework. Geomorphology 216:157–170
74. Talukdar S, Pal S (2017) Impact of dam on inundation regime of flood plain wetland of punarbhaba
river basin of barind tract of Indo-Bangladesh. International Soil Water Conservation Research
5(2):109–121
75. Talukdar S, Pal S (2018) Impact of dam on flow regime and flood plain modification in Punarbhaba
River Basin of Indo-Bangladesh Barind tract. Water Conservation Science Engineering 3(2):59–77
76. Wasson RJ (2003) Sediment budget in the Ganga Brahmaputra catchment. Curr Sci 84:1041–1047
77. Yang C, Cai X, Wang X, Yan R, Zhang T, Zhang Q, Lu X (2015) Remotely sensed trajectory analysis of
channel migration in Lower Jingjiang Reach during the period of 1983–2013. Remote Sensing
7(12):16241–16256
78. Yang C, Cai X, Wang X, Yan R, Zhang T, Zhang Q, Lu X (2015) Remotely sensed trajectory analysis of
channel migration in Lower Jingjiang Reach during the period of 1983–2013. Remote Sensing
7(12):16241–16256
Figures
Page 20/30You can also read