Working Paper Series - United ...
←
→
Page content transcription
If your browser does not render page correctly, please read the page content below

Working Paper Series
 SD/WP/13/April 2021                                                          ESCAP Statistics Division

           Big data for environment and agriculture statistics

Irina Bernal, Consultant, UNESCAP Statistics Division

Gemma Van Halderen, Director, UNESCAP Statistics Division

Tanja Sejersen, Statistician, UNESCAP Statistics Division

Rikke Munk Hansen, Chief of Economic and Environment Statistics, UNESCAP Statistics Division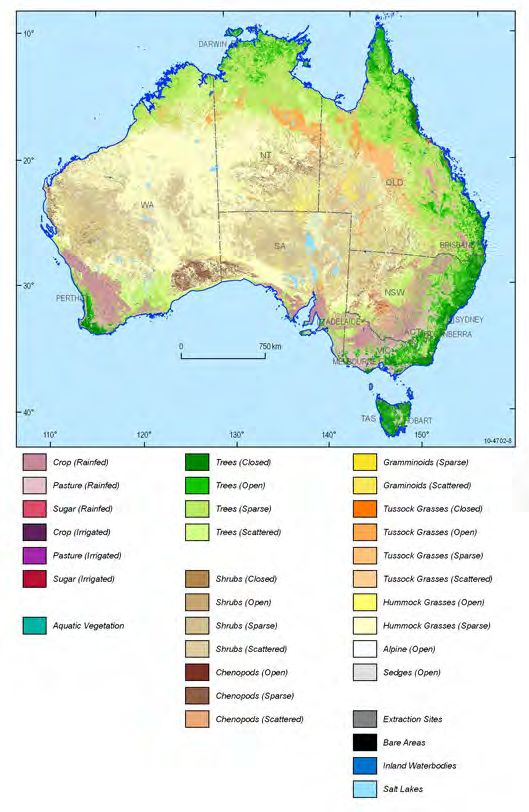
SD/WP/13/April 2021                                                                                 Big data for environment and agriculture statistics

ABSTRACT
This Working Paper gives an overview of how geospatial information and Earth Observation data can be
used to produce environment and agriculture statistics and presents specific country examples from Asia
and the Pacific. It also provides examples of specific country-led efforts to use Earth Observation data for
the compilation of SDG indicators.

This Working Paper is part of ESCAP’s series on the use of non-traditional data sources for official statistics.

Key words: big data, environment and agriculture statistics, Earth Observation data, SDG indicators

TABLE OF CONTENTS
  What are environment statistics? .............................................................................................................1
  What big data sources can support the production of environment statistics? .......................................1
      The Big Data Terminology Soup: Geospatial, Earth Observation, GIS, GPS, and more explained ........1

  Country experiences and examples ..........................................................................................................4
      Land cover and land use statistics ........................................................................................................5

      Forest Surveys .......................................................................................................................................9

      Agricultural statistics...........................................................................................................................10

      Environment-related SDG indicators ..................................................................................................12

  National and regional open data platforms and Open Data Cubes ........................................................14
  Global and regional efforts in integrating geospatial and environment data .........................................16
  Conclusion ...............................................................................................................................................17

Photo credit: - iStock-1089940102.jpg

   The Working Paper Series of ESCAP Statistics Division disseminates latest developments and analysis of statistical
   measurements, methodologies and concepts to users and producers of statistics.
   The Working Paper is prepared by Irina Bernal, Consultant, UNESCAP Statistics Division, with valuable inputs from Gemma
   Van Halderen, Director, UNESCAP Statistics Division, Tanja Sejersen, Statistician, UNESCAP Statistics Division, and Rikke
   Munk Hansen, Chief of Economic and Environment Statistics, UNESCAP Statistics Division. This paper also benefitted from
   discussions and presentations during Asia-Pacific Stats Cafes held on July 29, 2020, October 14, 2020, and March 15,
   2021.This Working Paper is issued without formal editing.
   For more information, please contact:
   Statistics Division
   Economic and Social Commission for Asia and the Pacific (ESCAP)
   United Nations Building, Rajadamnern Nok Avenue, Bangkok 10200, Thailand
   Email: stat.unescap@un.org
   Previous Working Paper Series: https://www.unescap.org/knowledge-products-series/sd-working-papers.

 ESCAP Statistics Division                                                                                                                                i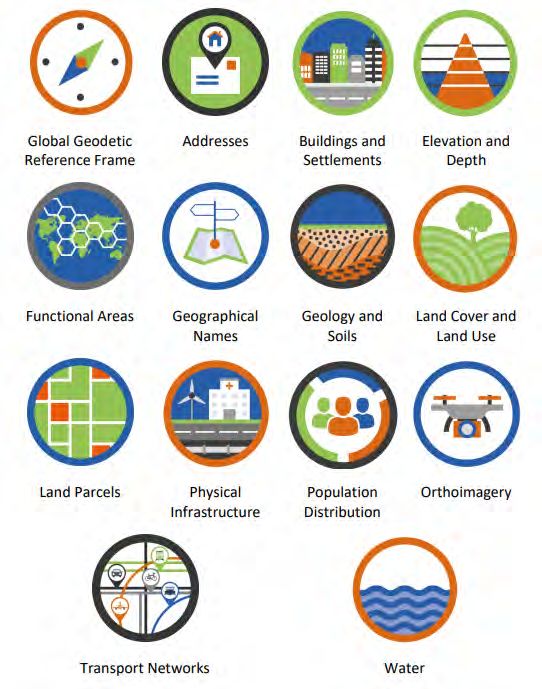
SD/WP/13/April 2021                                                                   Big data for environment and agriculture statistics

                                                                            regulations, governments are increasingly
What are environment statistics?                                            applying geospatial and Earth Observation (EO)
                                                                            data in the production of various environment-
Environment statistics covers ten themes: air and                           related statistics. These data sources are not new
climate, biodiversity, energy and minerals,                                 and several governments and National Statistical
forests, governance, inland water resources, land                           Offices (NSO) in the region have relied on them
and agriculture, marine and coastal areas,                                  for decades. Others have recently begun
natural     disasters    and     waste. 1     While                         researching potential uses of these data in
environmental statistics are still at an early stage                        environment statistics thanks to technological
of development in many countries, big data, such                            advancements, improved data accessibility and
as geospatial and Earth Observation (EO) data,                              availability of new tools and methods for data
coupled with advanced technologies, present                                 processing and analysis.
opportunities for new ways of producing
environment statistics.                                                     The importance of earth observation and
                                                                            geospatial information has also been formally
The production of environment statistics is                                 recognized for delivering on the 2030 Agenda for
guided by the Framework for the Development of                              Sustainable Development, when countries
Environment Statistics (FDES 2013) and the                                  committed to “promote transparent and
System of Environmental-Economic Accounting                                 accountable scaling-up of appropriate public-
(SEEA). 2 FDES 2013 provides an organized                                   private cooperation to exploit the contribution to
structure guiding the scope, collection and                                 be made by a wide range of data, including earth
compilation of environment statistics, while                                observation and geospatial information, while
SEEA provides guidance on integrating economic                              ensuring national ownership in supporting and
and environmental data into a single accounting                             tracking progress.” 3
framework, consistent with the System of
National Accounts. SEEA covers topics such as                               The Big Data Terminology Soup: Geospatial,
agriculture, forestry and fisheries, air emissions,                         Earth Observation, GIS, GPS, and more
energy, water, land, environmental activity, and
                                                                            explained
material flows.

Both FDES and SEEA can support the reporting on                             To provide clarity on the difference between
several of the environment-related Sustainable                              geospatial information and Earth Observation
Development Goals (SDGs). SEEA can serve as                                 data as well as their interconnection, several
the basis for the development of coherent                                   definitions and explanations are presented
environmental-economic        SDG     indicators,                           below.
contributing particularly to SDG 6 (Clean Water                             All countries need geospatial information for
and Sanitation), SDG 14 (Life Below Water), and                             national development and decision-making and
SDG 15 (Life on Land).                                                      geospatial information provides the integrative
                                                                            platform for all digital data that has a location
What big data sources can support the                                       dimension. 4
production of environment statistics?                                       Geospatial data combines location information
                                                                            (coordinates),         attribute      information
While environmental statistics are often                                    (characteristics of the object of phenomena), and
compiled using administrative data sources, such                            often temporal information (time or period at
as land records and information generated from                              which local and attributes exist). 5 Geospatial
administering environmental taxes and other                                 information is often derived from the Global

1       Framework for the Development of Environment Statistics (FDES 2013), https://unstats.un.org/unsd/envstats/fdes.cshtml
2       System of Environmental-Economic Accounting, https://seea.un.org/
3       United Nations, Transforming out world: The 2030 Agenda for sustainable development, A/RES/70/1, paragraph 76,
4       http://ggim.un.org/meetings/GGIM-committee/8th-Session/documents/Part%201-IGIF-Overarching-Strategic-Framework-24July2018.pdf
5       ScienceDirect, Geospatial Data, https://www.sciencedirect.com/topics/computer-science/geospatial-data

    ESCAP Statistics Division                                                                                                             1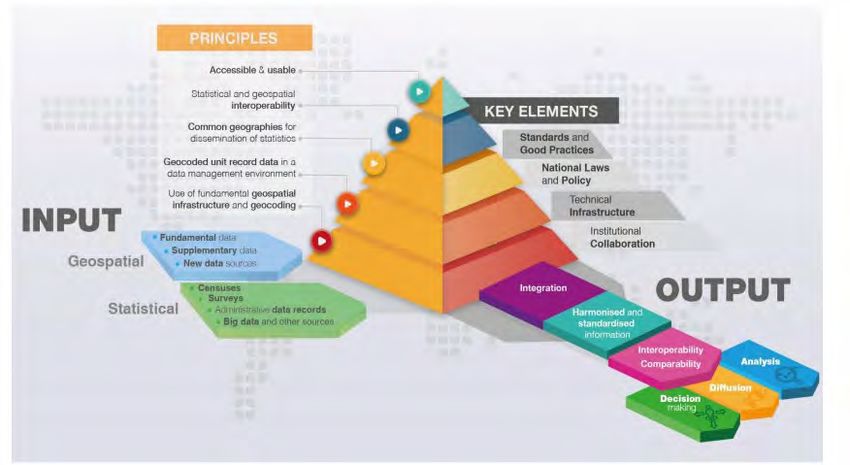
Big data for environment and agriculture statistics                                                               SD/WP/13/April 2021

Positioning System (GPS), the space-based                                   geospatial data layers across environment,
navigation system that provides location and                                economic and social domains to support the
time information in all weather conditions,                                 SDGs, as illustrated in Figure 1 and Figure 2.
anywhere on or near the earth where there is an
unobstructed line of sight to four or more GPS                              Geographical Information System (GIS) or
satellites. 6                                                               Geospatial Information System is a system
                                                                            designed to capture, store, manipulate, analyze,
The United Nations Committee of Experts on                                  manage, and present all types of spatial or
Global Geospatial Information Management                                    geographical data. What goes beyond a GIS is a
(UN-GGIM) has identified fourteen global                                    spatial data infrastructure. 7
fundamental geospatial data themes and

                                  Figure 1 | Global Fundamental Geospatial Data Themes

                                                             Source: UN-GGIM

6       https://sustainabledevelopment.un.org/topics/informationforintegrateddecision-making/geospatialinformation
7       Geospatial Information for Sustainable Development, https://sustainabledevelopment.un.org/topics/informationforintegrateddecision-
        making/geospatialinformation

    2                                                                                                           ESCAP Statistics Division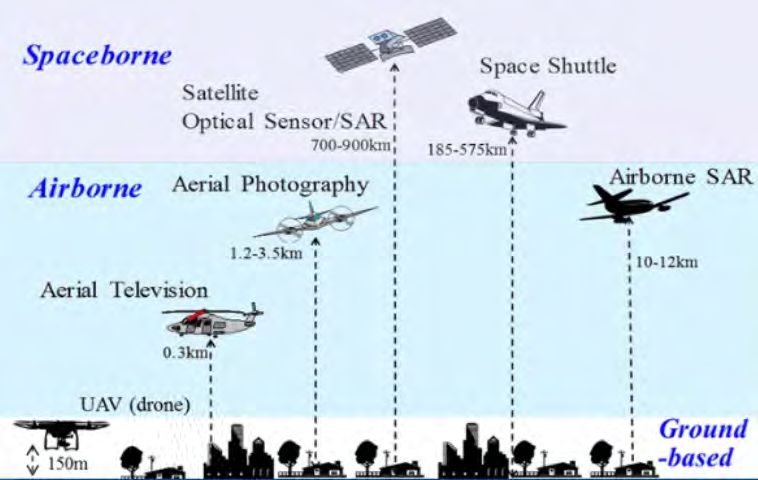
SD/WP/13/April 2021                                                                    Big data for environment and agriculture statistics

               Figure 2 | Geospatial data layers supporting the Sustainable Development Goals

                                                              Source: UN-GGIM

Earth Observation (EO) is the gathering of                                   status of and changes in the natural and
information about planet Earth’s physical,                                   manmade environment. 8 As Earth Observation
chemical, and biological systems via remote                                  data are images of the Earth’s surface, they need
sensing technologies (ground-based, airborne or                              to undergo pre-processing to correct for
spaceborne), usually involving satellites,                                   radiometric and geometric distortions of data
unmanned aerial vehicles (UAV, also referred to                              before performing analysis, and are often
as “drones”) or other technology carrying                                    integrated with administrative data, such as
imaging devices, as depicted in Figure 3. Earth                              administrative boundaries or elevation during
Observation is used to monitor and assess the                                the analysis.

                                                Figure 3 | Earth Observation data

                                                          Source: mapscaping.com

8       EU Science Hub, Earth observation, https://ec.europa.eu/jrc/en/research-topic/earth-observation

    ESCAP Statistics Division                                                                                                              3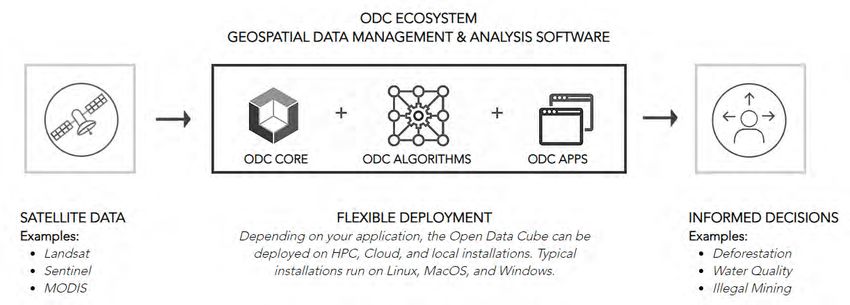
Big data for environment and agriculture statistics                                                              SD/WP/13/April 2021

                                                                           Framework 9 and is reviewing the Spatial data
Country experiences and examples                                           infrastructure law.

Governments in the region have been actively                               A leader on geospatial and statistical integration,
developing their national geospatial frameworks                            the Australian Bureau of Statistics (ABS), has
to guide the use and integration of geospatial                             developed an Australian Statistical Spatial
information. For example, the Government of                                Framework with the main attributes depicted in
Indonesia launched the One Map Initiative to                               Figure 4.10 The Australian Framework formed
bring together and incorporate land use, land                              the basis of the global Statistical-Geospatial
tenure and other spatial data into one database                            Framework 11    adopted by          two      global
for the country. The Government of Mongolia                                intergovernmental bodies: the UN Statistical
developed an Integrated Geospatial Information                             Commission and the UN-GGIM.

                                     Figure 4 | Statistical Spatial Framework for Australia

                                                                Source: ABS

Earth Observation (EO) data has also been                                  statistics are shared across multiple institutions,
actively explored by countries in the region.                              such as the NSOs and specialized ministries (e.g.
Many national Space Agencies and Space                                     Ministry of the Environment, Natural Resources,
Programmes are developing frameworks on the                                Agriculture, Forests, Waters and Land and others
use of Earth Observation data for monitoring                               depending on administration), while in others,
purposes across areas such as agriculture,                                 these responsibilities are unclear or non-existing.
environment, and disasters.                                                Few NSOs in the region have integrated or are
                                                                           exploring the integration of EO into the
In many countries in the region, the national                              production of official statistics. However,
responsibilities for producing environment                                 government agencies are actively exploring EO

9       Bayarmaa Enkhtur, presentation “Segment V. Operationalizing the Integrated Geospatial Information Framework in Mongolia”,
        https://ggim.un.org/meetings/2020/Virtual_HLF/documents/Bayarmaa_Enkhtur_2Jun.pdf
10      Australian Bureau of Statistics, Statistical Spatial Framework Overview,
        https://www.abs.gov.au/websitedbs/D3310114.nsf/home/Statistical+Spatial+Framework#:~:text=The%20foundation%20of%20the%20St
        atistical%20Spatial%20Framework%20for,each%20person%2C%20household%20or%20business%20in%20a%20dataset.
11      The Global Statistical Geospatial Framework, http://ggim.un.org/meetings/GGIM-committee/9th-Session/documents/The_GSGF.pdf

    4                                                                                                           ESCAP Statistics Division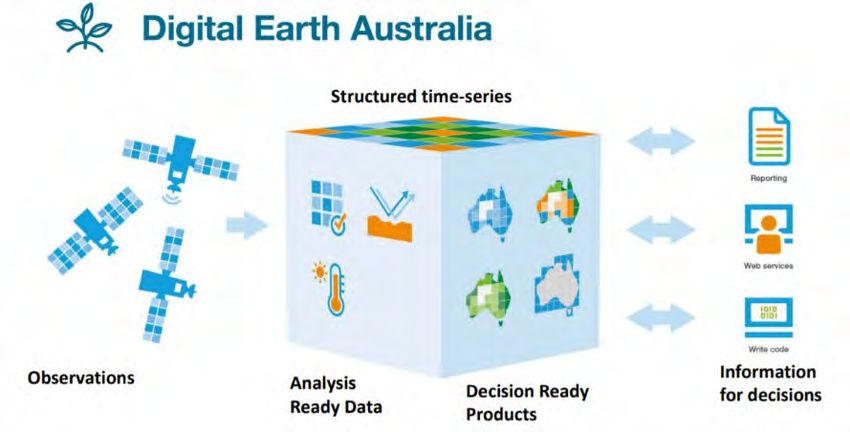
SD/WP/13/April 2021                                                                        Big data for environment and agriculture statistics

data for the development of environment                                      description of the Open Data Cube efforts and
related monitoring systems, often in                                         access to analysis-ready data at the regional and
collaboration with the national Space, Remote                                global levels.
Sensing or Mapping Agencies and Programmes.
Thus, many EO-related efforts are concentrated                               Land cover and land use statistics
on environmental monitoring and considerably
less attention is paid to the use of EO in official                          Land cover and land use status and changes refer
statistics.                                                                  to information about the coverage of land, and
                                                                             changes in that land and associated activities
Integration of EO data into official statistics is                           across time. 12 Land cover refers to the
confronted with a series of challenges. Satellite                            (bio)physical coverage on the earth’s surface,
imagery needs to be pre-processed to become                                  such as water surfaces, vegetation, buildings,
analysis-ready for statistical purposes. NSOs                                and roads. The types of land cover include
often lack technical skills for imagery pre-                                 different types of crops, grassland, tree-covered
processing, but lately, particularly with the                                areas, mangroves, permanent snow and glacier,
development of the data cubes, access and                                    water bodies, etc. Land use refers to the
availability of pre-processed imagery has been                               socioeconomic activities performed on land.
growing. Other challenges include technical,                                 There are multiple land uses, and they include
human, and financial resources necessary for                                 activities such as agriculture, forestry,
data storage, processing, and analysis. Despite                              aquaculture, etc. Land cover and land use change
the technological developments that render EO                                (LUCC) indicates the changes that occur to the
more accessible, these challenges need to be                                 land cover and land use over time.
addressed for a successful integration of EO data
into environment statistics. However, in some                                The SEEA Land Accounts can provide an
countries, the Statistics Law also limits the data                           assessment of the changing shares of different
sources that could be used to produce official                               land uses and land cover within a country. 13 SEEA
statistics, hindering exploration of big data.                               Land Accounts consist of two main types of
                                                                             accounts to record land use and land cover and
Close collaboration between the NSOs, Mapping                                their links to the economy: 1) physical asset
Agencies, Space Agencies and specialized                                     accounts – describing changes in land stock
Environment Agencies could help address many                                 associated with human activity and natural
of those challenges. International development                               processing, 2) monetary asset accounts –
partners, such as ESCAP and ADB, as well as the                              describing changes to the value of land for
specialized funds and programmes of the UN that                              agriculture, forestry, human activity, among
are custodians of the environment-related SDG                                other usage, due to the revaluation of land.
indicators (such as FAO) are supporting the
national statistical systems in the use of EO data                           Traditionally, land cover and land use statistics
for environment and agriculture statistics                                   are collected though administrative data and
through pilots, trainings and technical guidelines.                          from in situ data collection exercise, meaning
                                                                             that data are gathered through direct
The remainder of this paper focuses on specific                              observations on the ground. For example, the
country examples, from the NSOs and ministries,                              European Union conducts a three-yearly
of using Earth Observation data to produce                                   harmonized regional Land use and land cover
environment statistics and environment-related                               survey (LUCAS). 14
SDG indicators. The areas of environment
statistics explored are land cover and land use                              Few NSOs in Asia and the Pacific are integrating
statistics, forest surveys, and agriculture                                  Earth Observation data, particularly from
statistics. These examples are followed by a                                 satellite imagery, to produce land cover and land

12   United Nations Statistics Division, Manual of the Basic Set of Environment Statistics of the FDES 2013,
     https://unstats.un.org/unsd/environment/FDES/MS_1.2.1_2.3.1_Land%20Cover_Land%20Use.pdf
13   United Nations, System of Environmental and Economic Accounting, Land Accounts, https://seea.un.org/content/land-accounts
14   Eurostat, Land use and land cover survey, https://ec.europa.eu/eurostat/statistics-explained/index.php/LUCAS_-
     _Land_use_and_land_cover_survey#How_is_LUCAS_conducted.3F

 ESCAP Statistics Division                                                                                                                  5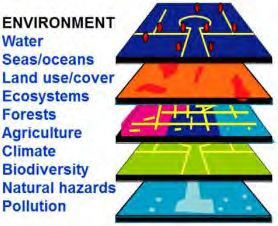
Big data for environment and agriculture statistics                                                                  SD/WP/13/April 2021

use statistics. Two prominent case studies                                    on a periodic basis on a 1:50,000 scale and on a
presented are from the Ministry of Statistics and                             yearly basis on a 1:250,000 scale. 17 The LULC data
Programme Implementation (MoSPI) of India                                     are grouped by classes (built-up, agriculture,
and the Australian Bureau of Statistics (ABS). The                            forest, grass/grazing, barren/unculturable/
third example from Kazakhstan illustrates the                                 wasteland, wetlands/water bodies, snow and
collaboration between the Ministry of                                         glacier).
Agriculture and the Remote Sensing Agency for
space monitoring of rational use of land                                      The national level land degradation mapping is
resources. While these case studies provide an                                conducted by the National Remote Sensing
understanding of how EO data are used to                                      Center (NRSC), in association with the
produce land cover and land use statistics, they                              Department of Space and Department of Land
do not constitute a complete overview of the                                  Resources (DoLR) and the Ministry of Rural
regional experience in this area.                                             Development (MoRD) at a regular interval since
                                                                              1986. The “Wastelands Atlas of India” is
•       Improving land statistics                    with   Earth             compiled using remote sensing satellite data at a
        Observation data in India                                             1:50,000 scale. 18

The Ministry of Statistics and Programme                                      •      Integrating multiple data sources for land
Implementation (MoSPI) of India is one of the                                        accounts, land cover, and monitoring
few statistical institutions in the region that                                      changing vegetation patterns in Australia
produces Environment Accounts using remote
sensing data. To fulfil its mandate of issuing                                The ABS recognizes land use datasets as essential
environmental accounts fit for policy, the MoSPI                              statistical assets for Australia and the Australia
constituted an Inter-Ministerial Group (IMG) on                               and New Zealand Land Information Council
Environmental Accounting-India comprising the                                 recognizes the same datasets as Foundation
Ministry of Environment, Forests and Climate                                  Spatial Datasets. 19
Change (MoEFCC), Ministry of Jal Shakti, Ministry
                                                                              The development and maintenance of
of Earth Sciences, the National Remote Sensing
                                                                              information on land use and land management
Center and the Comptroller and Auditor General
                                                                              practices in Australia is promoted by the
of India. 15
                                                                              Australian Collaborative Land Use and
The three main datasets on land available in India                            Management Program (ACLUMP), comprising
are land-use and land-cover (LULC), land                                      multiple actors including the ABS, Geoscience
degraded by various natural and anthropogenic                                 Australia, Department of Agriculture and Water
processes, and the wastelands in the country. 16                              Resources, Bureau of Meteorology, the
The land-use and land-cover statistics are                                    Commonwealth Scientific and Industrial
maintained by the National Remote Sensing                                     Research Organisation (CSIRO) and others. 20
Centre (NRSC) of the Indian Space Research
                                                                              In Australia, land use mapping is conducted at
Organization (ISRO) operating under the
                                                                              two scales: nation scale and catchment scales.
Department of Space (DOS) through a
                                                                              Nation scale mapping (1:2,500,000) integrates
component on LULC mapping of the Natural
                                                                              satellite imagery, agricultural commodity data,
Resources Census (NRC). LULC datasets are made
                                                                              and other land information. Catchment scale
available by the National Remote Sensing Centre

15      EnviStats India 2020 : Vol. II – Environment Accounts, http://www.mospi.nic.in/publication/envistats-india-2020-vol-ii-environment-
        accounts
16      EnviStats India 2020 : Vol. II – Environment Accounts. Land : A finite resource,
        http://mospi.nic.in/sites/default/files/reports_and_publication/statistical_publication/EnviStats2/b1_ES2_2020.pdf, page 12
17      Indian Geo-Platform of ISRO, https://bhuvan-app1.nrsc.gov.in/thematic/thematic/index.php
18      Department of Land Resources, National Remote Sensing Center, Government of India, 2019, “Wastelands Atlas of India”,
        https://dolr.gov.in/sites/default/files/Wastelands%20Atlas%20-%20Cover%2C%20Preface%2C%20Contents%2C%20Project%20Team%2C
        %20Executive%20Summary%2C%20Introduction%20-%20Result.pdf
19      Department of Agriculture and Water Resources, Australian Government, Land use information for Australia,
        https://www.agriculture.gov.au/sites/default/files/abares/aclump/documents/LandUseInfoForAustralia_v1.0.0.pdf
20      Idem.

    6                                                                                                               ESCAP Statistics Division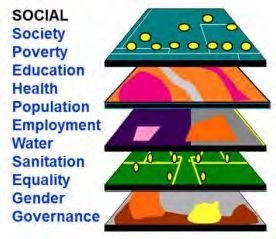
SD/WP/13/April 2021                                                                      Big data for environment and agriculture statistics

mapping integrates state cadastre, public land                             rainfall, monthly soil moisture, and livestock
databases, fine-scale satellite data, and other                            density for Australia global land use. It also
land data. 21 Land use datasets provide the basis                          serves as a spatial data platform for the
for regional and national reporting of land use                            Rangeland and Pasture Productivity and is an
and land management practices.                                             activity of the Global Agricultural Monitoring
                                                                           (GEOGLAM) initiative of the Group on Earth
The land cover dataset is developed and                                    Observations (GEO). RaPP supported the
maintained by Geoscience Australia and the                                 national reporting of erosion in the Australia
Australian Bureau of Agricultural and Resource                             State of the Environment 2016 report 26 and
Economics and Sciences (ABARES). It comprises                              provided data to the New South Wales
the National Dynamic Land Cover Dataset for                                Government’s      DustWatch      program       for
Australia, a series of derived mapping products                            monitoring wind erosion and caring for soils. The
and technical information. The Dynamic Land                                DustWatch programme is a citizen-science
Cover Dataset of Australia 22 is the first nationally                      program, which relies on the community of
consistent and thematically comprehensive land                             volunteers around Australia to record data and
cover reference for Australia developed from                               observations about dust in their area and share
remote sensing. The dataset provides a baseline                            them with the Department. 27
for identifying and reporting on change and
trends in vegetation cover and extent, with data                           The ABS has produced several experimental land
available for Australia since 2001 at two-year                             accounts, each time improving the methods and
intervals. The Dataset is a time series of                                 revisiting the previous accounts. The land
Enhanced Vegetation Index (EVI) data from the                              accounts are prepared by combining State Valuer
Moderate             Resolution              Imaging                       General land titles data with Australian Business
Spectroradiometer (MODIS) on the Terra and                                 Register using GIS software. 28 The Data Cube
Aqua satellites operated by NASA. 23                                       with Landsat imagery developed by Geoscience
                                                                           Australia provides a model infrastructure for
The Ground Cover Monitoring for Australia                                  time series analysis with consistent methods and
allows for monitoring and regular reporting on                             resolution. One example of Land Accounts is the
the vegetation cover using satellite imagery. 24                           Queensland Experimental Land Account
The RaPP Map tool, 25 supported by CSIRO,                                  Estimates for 2011-2016. 29 This experimental
provides data on vegetation cover, monthly                                 Land Account was developed in line with SEEA.

21   Australian Government, Department of Agriculture, Water and the Environment, Land use mapping,
     https://www.agriculture.gov.au/abares/aclump/land-use/land-use-mapping
22   Geoscience Australia, National Land Cover Dataset, http://www.ga.gov.au/scientific-topics/earth-obs/accessing-satellite-
     imagery/landcover
23   Dynamic Land Cover Dataset, https://data.gov.au/data/dataset/1556b944-731c-4b7f-a03e-14577c7e68db
24   Department of Agriculture, Water and the Environment, Australian Government, Ground Cover Monitoring for Australia,
     https://www.agriculture.gov.au/abares/aclump/land-cover/ground-cover-monitoring-for-australia
25   GEOGLAM RAPP Map, https://map.geo-rapp.org/#australia
26   Australia State of the Environment 2016, https://soe.environment.gov.au/theme/land
27   New South Wales Government, Community DustWatch, https://www.environment.nsw.gov.au/topics/land-and-soil/soil-
     degradation/wind-erosion/community-dustwatch
28   Tim Walter, Australian Bureau of Statistics, presentation “Lessons Learned: The ABS Land Accounting Experience”,
     https://www.wavespartnership.org/sites/waves/files/images/Phil_5.%20Lessons%20Learned%20ABS%20Land%20Accounting%20Experie
     nce%20Sept2014.pdf
29   Australian Bureau of Statistics, Land Account: Queensland, Experimental Estimates, 2011-2016,
     https://www.abs.gov.au/ausstats/abs@.nsf/Latestproducts/4609.0.55.003Main%20Features12011%20-%202016?opendocument&tabna
     me=Summary&prodno=4609.0.55.003&issue=2011%20-%202016&num=&view=

 ESCAP Statistics Division                                                                                                                7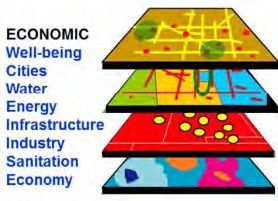
Big data for environment and agriculture statistics                                                      SD/WP/13/April 2021

                                          Figure 5 | Land Cover map for Australia

            Source: Geoscience Australia and Australian Bureau of Agricultural and Resource Economics and Sciences

8                                                                                                   ESCAP Statistics Division
SD/WP/13/April 2021 Big data for environment and agriculture statistics
• Using satellite data for monitoring rational Experimental Land Cover Account using satellite
use of land resources in Kazakhstan imagery and the above mentioned tools. 33
In the Republic of Kazakhstan, the Land Forest Surveys
Resources Management Committee of the
Ministry of Agriculture partnered with the state Forest surveys are used to collect information
agency “Kazakhstan Gharysh Sapary”, national about the boundaries of the forest area, the
operator of a High-Accuracy Satellite Navigation condition of the forest, information about
System Services and provider of remote sensing diseases affecting the forest as well as
products and services, to develop several information about logging activities.
geoservices based on satellite data. These
services focus on space monitoring of the At the global level, Food and Agriculture
rational use of land resources in the northern Organization (FAO) oversees the Global Forest
regions of the country, identification of Resources Assessment, a global remote sensing
unaccounted and free lands, and the assessment survey aiming to improve estimates of forest
of pasture. 30 The monitoring mechanism uses area change at global and regional scales. In this
data from national satellites (KazEOSat-1, regard, FAO has established a global network of
KazEOSat-2, and KazSTSAT), data from the State officially nominated National Correspondents
Land Cadastre, data from local authorities, and and has been conducting national capacity
farm animal identification data. building in data collection using remote sensing
tools specifically developed for this purpose.
To address the growing interest in the region Collect Earth Online 34 is part of FAO’s Open Foris
from the national statistical systems in using suite of tools developed by NASA and FAO with
Earth Observation data for land statistics, UN the support from Google to guide countries in
ESCAP has been developing technical manuals the implementation of multi-purpose forest
and training materials to guide them in the inventories.
integration of Earth Observation data in the
production of environment statistics. Among the The Forest Resources Assessments process plays
most recent knowledge products and tools are a central part in monitoring progress towards
the Step by step guide on the use of QGIS and SDG 15 (Life on Land) and in particular indicator
RStudio for Producing land cover change maps 15.1.1 (forest area as a proportion of total land
and statistics, 31 and the more advanced guide on area) and 15.2.1 (progress towards sustainable
Producing land cover change maps and statistics: forest management). 35 FAO is the custodian for
Guide on advanced use of QGIS and RStudio, 32 to 21 SDG indicators, including three under SDG 15.
guide countries in compiling their land cover
change maps compatible with the SEEA At the national level, forest surveys are usually
reporting. ESCAP Statistics Division has also conducted by the Ministry of Environment,
directly supported the National Statistics Office Natural Resources or Forests. Examples from
of Fiji in their successful production of India, Thailand and Kazakhstan illustrate the use
of EO data in forest surveys.
30 Timur Myrzagaliev, presentation “Space monitoring of the rational use of land resources of the Republic of Kazakhstan” at the Regional
Inception Workshop on Integrating Statistical Geospatial Data for Land Accounts and Statistics in Central Asia, Tashkent, Uzbekistan,
November 2019,
https://www.unescap.org/sites/default/files/10.%20Space%20Monitoring%20of%20Rational%20Use%20of%20Land%20Resources%20of
%20Kazakhstan.pdf
31 ESCAP, Producing land cover change maps and statistics: Step by step guide on the use of QGIS and RStudio, October 2020,
https://www.unescap.org/resources/producing-land-cover-change-maps-and-statistics-step-step-guide-use-qgis-and-rstudio
32 ESCAP, Producing land cover change maps and statistics: Guide on advanced use of QGIS and RStudio, February 2021,
https://www.unescap.org/kp/2021/producing-land-cover-change-maps-and-statistics-guide-advanced-use-qgis-and-rstudio#
33 Litia Kurisaqila-Mate, presentation “Compiling Fiji’s Experimental Land Cover Account,” ESCAP Stats Café, 15 March 2021,
https://www.unescap.org/sites/default/d8files/event-documents/Fiji_experimental_land_cover_Stats_Cafe_15Mar2021.pdf
34 Collect Earth, http://www.openforis.org/tools/collect-earth.html
35 FAO, Global Forest Resources Assessment, http://www.fao.org/forest-resources-assessment/en/
ESCAP Statistics Division 9Big data for environment and agriculture statistics SD/WP/13/April 2021
In India, the Forest Survey of India (FSI), an Agricultural statistics
organization under the Ministry of Environment,
Forests and Climate Change oversees the Agricultural statistics provide information on the
evaluation of forest cover and has been production of yield and cultural crops, the extent
conducting biennial national forest assessment of arable land and sown area, number of
using remote sensing techniques since 1987. livestock, prices of land and agricultural
Since 2001, the Forest Survey of India has been products. Traditional sources of agricultural and
conducting surveys covering the entire country rural statistics include administrative reporting
through the digital assessment. The latest systems, household surveys, and censuses of
satellite data for nation-wide forest cover agriculture. The increasing demand for more
mapping are procured from the National Remote granular, timely, accurate and reliable data are
Sensing Centre (NRSC) 36 and the results are pushing national statistical agencies to explore
published in the India State of Forest Report innovative and more efficient methods of
(ISFR). 37 collecting agricultural data.
In Thailand, most of the data related to Land In some countries in the region, the NSOs and
Accounts are derived from administrative Ministries have been integrating EO data with
records and agriculture census. 38 However, the survey data for crop identification and
estimation of the Forest Cover, which falls under estimation of the area under specific crops.
the responsibility of the Royal Forest Department International development partners, such as
of the Ministry of Natural Resources and ADB, are also supporting countries in exploring
Environment, is assessed through satellite the use of EO data for agriculture statistics. In
imagery, particularly the LANDSAT-5TM satellite addition to contributing to agriculture statistics,
interpretation imageries with the exclusion of EO data are also used in national agriculture-
fruit tree orchards and rubber plantations. 39 related assessment, monitoring and forecasting
systems.
In Kazakhstan, state agency “Kazakhstan
Gharysh Sapary”, the provider of remote sensing • Experimental sugarcane statistics with non-
services, suppliess geospatial data to the survey data in Australia
Committee of Forestry and Wildlife of the
Ministry of Ecology and Natural Resources. On In Australia, the ABS collaborates with
the industry geoportal, the state agency shares Geoscience Australia on developing agricultural
satellite images of the national KazEOSat-1 crop maps and statistics using satellite data. 41
satellite with a spatial resolution of 1 meter for The ABS is collaborating with agricultural experts
creating forest management plans and maps, to co-design methods to integrate existing data
producing forest maps and reducing the cost of from administrative sources and satellite
field work, and making changes to cartographic imagery with traditional survey data. One
materials and the electronic database of the example of this new approach is the
State Forest Fund of the Republic of experimental sugarcane statistics. 42
Kazakhstan. 40 Traditionally, sugarcane statistics are produced
by the ABS through the annual Rural
36 Forest Survey of India, Forest Cover Mapping, https://fsi.nic.in/introduction?pgID=introduction
37 Forest Survey of India, An Introduction, https://www.fsi.nic.in/
38 National Statistics Office, presentation “State of Land and Land Use in Thailand,” Regional expert workshop on land accounting for SDGs
monitoring and reporting, Bangkok, 25-27 September 2017,
https://www.unescap.org/sites/default/files/Land_statistics_accounts_Thailand_Workshop_25-27Sep2017_0.pdf
39 Ministry of Natural Resources and Environment of Thailand, Forestry in Thailand, http://forprod.forest.go.th/forprod/ebook/การป่ าไม ้ใน
ประเทไทย/Forest%20in%20thailand%20eng.pdf
40 KGS, Space Monitoring of forest resources of the Republic of Kazakhstan, https://www.gharysh.kz/monitoringlesa/
41 Australian Bureau of Statistics, Improving agricultural crop statistics using satellite data, 26 June 2020,
https://www.abs.gov.au/research/industry/agriculture/improving-agricultural-crop-statistics-using-satellite-data
42 Australian Bureau of Statistics, Sugarcane, experimental regional estimates using new method data sources and methods, 17 June 2020,
https://www.abs.gov.au/statistics/industry/agriculture/sugarcane-experimental-regional-estimates-using-new-data-sources-and-
methods/2019-20
10 ESCAP Statistics DivisionSD/WP/13/April 2021 Big data for environment and agriculture statistics
Environment and Agricultural Commodities Besides FASAL, the National Crop Forecast
Survey (REACS). The experimental sugarcane Center manages NADAMS (National Agricultural
statistics were produced with new data sources Drought Assessment and Monitoring System). 44
(non-survey data) and methods of production, NADAMS project provides near real-time
with potential to reduce reporting burden on information on prevalence, severity level and
farmers. Geospatial validation and outlier persistence of agricultural drought across 17
adjustments in the production of statistics were states of India at the district and sub-district
based on satellite data-derived maps identifying levels. The assessment is carried out using
areas where sugarcane was grown. The rainfall data, Remote Sensing Vegetation Index
experimental estimates were published nine and Moisture adequacy Index during the Kharif
months earlier than those usually produced from season regularly generating underlying statistics.
REACS. The ABS co-designed this approach with
industry experts from Sugar Research Australia • Remote sensing for crop identification in
(SRA), Australian Sugar Milling Council, China
Canegrowers, the Australian Cane Farmers
In China, the National Bureau of Statistics (NBS)
Association, and the Queensland Government.
deploys remote sensing for crop identification
• Remote sensing for forecasting agricultural and uses geospatial technology to build the area
output in India sampling frame for agricultural surveys 45. The
first agricultural survey vehicle integrated
To address the need for timely and accurate satellite imagery, aero photography from the
data, the India’s Ministry of Agriculture and UAV and field observation generating geospatial
Farmers’ Welfare established Mahalanobis samples and estimations of crop area, crop
National Crop Forecast Centre (MNCFC) under condition and total production. In conducting the
the Department of Agriculture in 2012. MNCFC agricultural remote sensing survey, the NBS
was set up to provide in-season crop forecasts collaborates with the Ministry of Land Resource,
and assessment of the drought situation using National Bureau of Mapping and Geo-
techniques and methodologies developed by the Information, the National Geo-Information
Indian Space Research Organization (ISRO). The Center, and private companies. The geo-spatial
Space Application Centre (SAC), one of the major base data framework includes full coverage
centers of the ISRO, is already at an advanced satellite imagery, land use census data and other
stage of experimenting with the approach of data types, such as geo-referenced statistics,
remote sensing to estimate the area under meteorology, phenology, and hydrology data. In
principal crops through the scheme known as addition to monitoring the growth of major grain,
“Forecasting Agricultural output using Space, the NBS is exploring the application of remote
Agro-meteorology and Land based observations” sensing in livestock statistics.
(FASAL). 43 Under FASAL, MNCFC regularly
generates crop acreage estimation, crop • Using satellite imagery for maize detection in
condition assessment and produces forecasts at East Java, Indonesia
the district, state and national levels for nine
In Indonesia, BPS Statistics Indonesia conducted
major crops of the country (jute, kharif rice,
a study on the use of satellite imagery to detect
sugarcane, cotton, rapeseed and mustard, rabi
maize (one of the most important food crops
sorghum, wheat, rabi pulses and rabi rice), using
along with rice in Indonesia) field area in East
both optical and microwave data and the
Java Province. The machine learning model with
procedures developed by the Space Applications
random forest (RF) as the classifier was used to
Centre.
detect maize field areas using multispectral
43 FASAL (Forecasting Agricultural output using Space, Agro-meteorology and Land based observations),
https://www.ncfc.gov.in/about_fasal.html
44 NADAMAS (National Agricultural Drought Assessment and Monitoring System), https://www.ncfc.gov.in/nadams.html
45 Yu Xinhua, presentation “Remote Sensing Applications in Agricultural Statistics at China NBS”, 2014,
https://unstats.un.org/unsd/trade/events/2014/Beijing/presentations/day2/morning/3.%20Remote%20Sensing%20Applications%20in%2
0Agricultural%20Statistics--Yu%20Xi%20-1.pdf
ESCAP Statistics Division 11Big data for environment and agriculture statistics SD/WP/13/April 2021
imagery acquired by Landsat-8, Sentinel-1, and Environment-related SDG indicators
Sentinel-2 satellites. 46 Official statistical surveys
published by BPS-Statistics Indonesia are used as Over half of the SDGs have an environment
the ground truth labels to validate the proposed dimension. Out of the 93 environment-related
model. The results of the experiment suggest a SDG indicators identified by UNEP, 49 23 can be
promising accuracy in detecting the food crops supported by or need geospatial data for
area. compilation. 50 Other types of big data, such as
mobile phone data and citizen-science data could
• Remote sensing for estimating paddy areas also contribute to the compilation of the
in Lao People’s Democratic Republic, environment-related SDG indicators, but at a
Philippines, Thailand, and Viet Nam lesser extent.
The Asian Development Bank (ADB) piloted the SEEA can contribute to the development of
use of satellite data to estimate paddy area and coherent environmental-economic SDG
rice production in Savannakhet, Lao People’s indicators. Several indicators could be partly
Democratic Republic; Nueva Ecija, Philippines; generated by the SEEA framework, such as SEEA
Ang Thong, Thailand; and Thai Binh, Viet Nam. Water Accounts contributing to indicators 6.3.1,
The implementing agencies for the project 6.3.2, 6.4.2, and 6.6.1; SEEA Land Cover Account
included the Center for Agricultural Statistics, and Ecosystem Extent for 6.6.1, 11.7.1, 15.1.1,
Ministry of Agriculture and Forestry in the Lao 15.2.1, 15.3.1, 15.4.2; and SEEA Central
PDR; the Philippine Statistics Authority in the Framework Asset Accounts (Fisheries) for
Philippines; the Office of Agricultural Economics, 14.1.1. 51
the Ministry of Agriculture and Cooperatives, and
GeoInformatics and Space Technology In the Stats Brief “Geospatial Information and the
Development Agency in Thailand; and the Center 2030 Agenda for Sustainable Development”
for Informatics and Statistics, Ministry of ESCAP highlighted the uses of geospatial and
Agriculture and Rural Development in Viet Nam. Earth Observation data in the compilation on
Following the project, ADB developed the SDG indicators by countries. 52 In the area of the
handbook Use of Remote Sensing to Estimate environment-related SDG indicators, only a few
Paddy Areas and Production 47 along with a web- countries explored the EO use in their
based training 48 with the tools and techniques, compilation. These examples come for Australia
encouraging the NSOs and Ministries of (SDG 6.3.2, 14.1.1), China (SDGs 2.4.1, 6.3.2,
Agriculture to pilot satellite-based techniques as 11.2.1, 11.3.1, 11.4.1, 11.6.2, 11.7.1, 14.1.1,
an alternative to existing methods. 14.2.1, 15.1.2, 15.5.1), 53 India (SDG 11.3.1), New
Zealand (SDG 15.4.2), Turkey (SDG 15.4.2) and
Japan (SDG 15.4.2). The Stats Brief also presents
case studies from countries in other regions.
46 Wijayanto, Arie Wahyu & Triscowati, Dwi Wahyu & Marsuhandi, Arif. (2020). Maize Field Area Detection in East Java, Indonesia: An
Integrated Multispectral Remote Sensing and Machine Learning Approach,
https://www.researchgate.net/publication/344906996_Maize_Field_Area_Detection_in_East_Java_Indonesia_An_Integrated_Multispect
ral_Remote_Sensing_and_Machine_Learning_Approach
47 Asian Development Bank, A Handbook: Use of remote sensing to estimate paddy area and production, April 2019,
https://www.unescap.org/sites/default/d8files/knowledge-products/Stats_Brief_Issue27_Dec2020_Geospatial_data_for_SDGs.pdf
48 CARS: Community for Agricultural and Rural Statistics, http://cars.adbx.online/
49 UNEP, Measuring Progress: Towards Achieving the Environmental Dimension of the SDGs, 13 March 2019,
https://www.unenvironment.org/resources/report/measuring-progress-towards-achieving-environmental-dimension-sdgs
50 Jimena Juarez, presentation “WGGI’s Indicators shortlist: national assessment of the SDG indicators and observations”,
https://ggim.un.org/meetings/2020/WG-GI-Mexico-City/documents/6.Jimena-Juarez.pdf
51 UNSD developed a matrix of SDG indicators correspondence with the basic Set of Environment Statistics of the FDES 2013,
https://unstats.un.org/unsd/envstats/fdes/sdgsind_basicsetmatrix.pdf
52 Stats Brief, December 2020 (Issue no. 27): Geospatial information and the 2030 Agenda for Sustainable Development,
https://www.unescap.org/sites/default/d8files/knowledge-products/Stats_Brief_Issue27_Dec2020_Geospatial_data_for_SDGs.pdf
53 Additional SDGs explored by the Chinese Academy of Sciences were identified: SDGs 6.4.2, 6.6.1, 15.1.1, 15.3.1.
12 ESCAP Statistics DivisionSD/WP/13/April 2021 Big data for environment and agriculture statistics
In Asia-Pacific, China is one of the most advanced In Japan, the Geospatial Information Authority
in the use of geospatial and Earth Observation stresses the importance of collaboration
data in the area of the SDGs. The efforts are between Statistics, Space and Geospatial bodies.
registered at both national and regional levels. At The Authority has identified its contribution of
the national level, the Chinese Academy of the Digital Elevation Model and Coastline Data to
Sciences conducted pilots compiling SDG the Statistics Authority for the compilation of
indicators using Earth Observation data. 54 At the SDG 15.4.2 (Mountain Green Cover Index). 58 In
provincial level, in 2017, China piloted an SDG New Zealand, the Ministry of the Environment
Local Monitoring project in Deqing, initiative led uses Sentinel-2 imagery as a basis for Land Cover
by the Ministry of Natural Resources of China and database and LUCAS Land Use Map, contributing
Zhejiang Provincial Government, and supported to SDG indicators 15.1.1 (Forest area as a
by the National Bureau of Statistics. 55 This was proportion of total land area) and 15.4.2. 59 In
the world’s first comprehensive measurement of Turkey, for the compilation of the same
progress towards the SDGs at the county level indicator, Turkstat relies on Collect Earth tool,
using geospatial and statistical data. 56 FAO’s technical support and collaboration with
academia on the calculations of the indicator,
The Ministry of Statistics and Programme registering differences from the custodian
Implementation (MoSPI) of India compiled an agency’s results. 60 BPS-Statistics Indonesia is
experimental compilation of SDG 11.3.1 to researching the uses of different big data sources
understand the populations’ growth rate across and is considering the use of satellite imagery for
the million plus cities. The estimates were the SDG indicators 15.3.1 (Proportion of land
compiled using the Land Use Efficiency tool that is degraded over total land area) and 15.4.2.
(LUE) 57 developed by the Joint Research Center
(JRC) of the European Union, and the open and Increasingly more data and technical resources
free Global Human Settlement Layer (GHSL). The are available to support the integration of Earth
global layer on built-up surfaces is produced Observation data into the national compilation
from Landsat images, while the population of the SDG indicators. For example, CSIRO and
estimates were nationally adjusted to the UNCCD released a Good Practice Guidance for
population totals from the UN World Population SDG 15.3.1 and Trends Earth released technical
Prospects: The 2015 Revision. The estimates are guidance on generation of SDG 15.3.1 61 and SDG
experimental in nature, as they have been 11.3.1 (Ration of land consumption rate to
compiled using data available under GHSL, which population growth). 62
may differ from the official estimates of
population growth and built-up areas in these Guidance on accessing and using satellite
cities. imagery in the SDG context is also provided. For
example, the UN Statistics Division
54 Chinese Academy of Sciences, Big Earth Data in Support of the Sustainable Development Goals, September 2019,
https://www.fmprc.gov.cn/mfa_eng/topics_665678/2030kcxfzyc/P020190924800116340503.pdf and Chinese Academy of Sciences, Big
Earth Data in Support of the Sustainable Development Goals, September 2020,
https://www.fmprc.gov.cn/mfa_eng/topics_665678/2030kcxfzyc/P020200927650108183958.pdf
55 SDGs Local Monitoring – China’s Pilot Practice, https://sustainabledevelopment.un.org/partnership/?p=29982
56 Group on Earth Observations, Member spotlight: China, 7 January 2019, https://earthobservations.org/geo_blog_obs.php?id=336
57 European Commission, GHSL – Global Human Settlement Layer, https://ghsl.jrc.ec.europa.eu/tools.php
58 Hidenori Fujimura, presentation “Partnerships Activities for Geospatial-Statistical Integration”, UN-GGIM-AP WG3 webinar on “Integrating
Geospatial Information and Statistics, answering SDG’s Challenge, 7 October 2020, https://speakerdeck.com/hfu/partnership-activities-
for-geospatial-statistical-integration?slide=7
59 Group on Earth Observations, Country Use Case of EO Use for SDG Indicator, New Zealand, https://eo4sdg.org/wp-
content/uploads/2020/04/NZ_15.11_15.4.2.pdf
60 Ovunc Uysal, presentation “Mountain Green Cover Index (MGCI): A baseline calculation case for Turkey”, Workshop on Statistics for SDGs,
Geneva, 17-18 April 2019,
https://unece.org/fileadmin/DAM/stats/documents/ece/ces/ge.32/2019/mtg2/S_2_4_Mountain_Green_Cover_Index__MGCI__Turkey.p
df
61 Trends.Earth, SDG Indicator 15.3.1, http://trends.earth/docs/en/background/understanding_indicators15.html
62 Trends.Earth, SDG Indicator 11.3.1, http://trends.earth/docs/en/background/understanding_indicators11.html
ESCAP Statistics Division 13Big data for environment and agriculture statistics SD/WP/13/April 2021
Marketplace 63 guides users on accessing via Open Source Geospatial Data Management and
Amazon S3 the Landsat 8 data, which is available Analysis Software. The project was born out of
since 1972 and generated daily. Additionally, the initiative Unlocking the Landsat Archive of
Specifications of land cover datasets for SDG the Australian Geoscience Data Cube (AGDC) and
indicator monitoring64 have also been compiled is supported by six institutional partners:
and are available as open data with Geoscience Australia (GA), NASA / Committee on
corresponding sources. Earth Observation Satellite (CEOS), United States
Geological Survey (USGS), CSIRO, Catapult
Satellite Applications, and Analytical Mechanics
National and regional open data Associates (AMA). 65
platforms and Open Data Cubes
The ABS collaborates with Geoscience Australia
From NASA’s MODIS and Landsat Data, which are on using satellite imagery for remote sensing and
used in almost any environmental discipline, to compiling environment statistics, and multiple
the European Union’s Earth Observation products have been developed from the Open
Programme Copernicus, Earth Observations Data Cube. Some of the examples include the
from satellite imagery are growing in coverage, Map of Wet Lands, showcasing changes in water
resolution, and accessibility. Nevertheless, content through time, which could be generated
despite the wealth of satellite data collected over for every single wetland in the country and
the past 40 years, little has been effectively put performed every five days; Map of
to good use. The main challenge has been Waterbodies 66, a total of 295,903 waterbodies,
transforming images into analysis-ready data, and the world’s first continent-scale map of
while correcting for atmospheric effect and surface water; Water Quality Monitoring tool;
continental drifts and lining up those images Measurement of changes in agriculture field
through time. Effective use for decision-making productivity; Coastal Change over time. The
and development of new products requires data advantage of these tools is that they can produce
preparation performed by remote sensing an equivalent of a routine census, rather than a
specialists before statisticians can proceed to the survey, with a monitoring capability for
analysis. environment statistics.
Digital Earth Australia addressed this issue by The analysis-ready satellite imagery is stored in
transforming satellite observations into analysis- the cloud and all the applications are
ready data and making them available in the documented online with an open access on
Open Data Cube (ODC), which has emerged as an opendatacube.org.
Figure 6 | The stages of satellite imagery processing at Digital Earth Australia
Source: Geoscience Australia
63 UN Statistics Division Marketplace, https://docs.opendata.aws/landsat-pds/readme.htm
64 Global Observation for Forest Cover and Land Dynamics (GOFC-GOLD) Land Cover Project at Wageningen University
http://ggim.un.org/documents/Paper_Land_cover_datasets_for_SDGs.pdf
65 Open Data Cube, https://www.opendatacube.org/about
66 Geoscience Australia, DEA Waterbodies, https://www.ga.gov.au/dea/products/dea-waterbodies
14 ESCAP Statistics DivisionSD/WP/13/April 2021 Big data for environment and agriculture statistics
Figure 7 | The Open Data Cube Ecosystem
Source: opendatacube.org
The ease of data access coupled with the utility detection and water quality. The Open Data Cube
of the Open Data Cube, led to the development is VNSC’s core data architecture for becoming
of the Open Data Cube in other continents. the Earth Observation provider in Vietnam.
Digital Earth Africa 67 provides Earth Observations
for policy making covering the entire continent. At the regional level, ESCAP, as the Secretariat of
Another one currently under development with UN-GGIM-AP, has begun a ten-year initiative
support from CSIRO and the Pacific Community is from 2020 to 2030 to provide member States
Digital Earth Pacific, focusing on marine and with an integrated geospatial data hub through
water-related aspects, covering climate change the operation of an Asia-Pacific geospatial
impacts, coastal change, coral bleaching, information platform across countries. It aims to
maritime surveillance, marine water quality, promote the sharing and use of geospatial
agriculture, water, and vegetation. 68 This was the information services and products among
quickest data cube, taking 3.5 hours to generate member states, strengthen UN-GGIM-AP
for all of Vanuatu. Furthermore, in addition to geospatial data sharing platform and provide
the Open Data Cube, the collaboration between advisory services and capacity building
GeoScience, Energy and Maritime Division of the programmes to ESCAP and UN-GGIM-AP
Pacific Community, University of Sydney, and member states. On 16 October 2020, ESCAP
Geoscience Australia resulted in PacGeo - an organized an initial exploratory ‘Regional
open access geospatial data repository providing Workshop for Promoting the Asia-Pacific
geophysical, geodetic, and marine spatial data Geospatial Information Platform’, to discuss
sets covering the Pacific Island Countries. 69 concept, possibilities and challenges of such an
information platform. 70
Another example in the region is the Vietnam
Open Data Cube launched by the Vietnam
National Space Center (VNSC). The platform
provides information services on coastal change,
forest, NDVI anomaly, urbanization, water
67 Digital Earth Africa, https://www.digitalearthafrica.org/
68 Stuart Minchin presentation “Digital Earth Australia, Africa, and Pacific: Big Earth Data for Sustainable Development” at ESCAP Stats Café
on October 14, 2020, https://www.unescap.org/sites/default/files/Digital_Earth_SPC_Stats_Cafe_14Oct2020.pdf
69 PacGeo, http://www.pacgeo.org/
70 UN-GGIM-AP, Regional Workshop for Promoting the Asia-Pacific Geospatial Information Platform, https://www.un-ggim-
ap.org/meeting/regional-workshop-promoting-asia-pacific-geospatial-information-platform
ESCAP Statistics Division 15Big data for environment and agriculture statistics SD/WP/13/April 2021
inventory and spatial and statistical analysis of
Global and regional efforts in historic climate data. To inform countries about
integrating geospatial and the EO potential for statistics, Task Team
environment data released a Guide on Earth Observations for
Official Statistics. 72
Multiple actors and communities at the global,
Another UN global effort is the Expert Group on
regional, and country levels are using big data for
the Integration of Statistical and Geospatial
environmental monitoring and statistics, and in
Information, 73 which was established by the
particular geospatial data and Earth
United Nations Statistical Commission (UNSC)
Observations.
and the United Nations Committee of Experts on
At the global level, the UN Committee of Experts Global Geospatial Information Management
on Big Data and Data Science for Official Statistics (UN-GGIM). The Expert Group adopted the
(UN-CEBD) includes a Task Team on Earth Global Statistical Geospatial Framework (GSGF) 74
Observation Data (EO), 71 which explores the in 2019. The GSGF relies on five fundamental
applications of EO for official statistics, in principles and permits the production of
particular agricultural statistics and land cover standardized and integrated geospatially
and land use statistics. Other pilot projects of the enabled statistical data to facilitate data-driven
Task Team cover crop density mapping, crude oil decision-making.
Figure 8 | Global Statistical Geospatial Framework.
Source: UN-GGIM, UN Statistical Commission: UN Statistics Commission, Global Geospatial Information Management
Secretariat, The Global Statistical Geospatial Framework.
71 Earth Observation data, Task Team of the UN Committee of Experts on Big Data and Data Science for Official Statistics; Mission and
Strategies, https://unstats.un.org/bigdata/task-teams/earth-observation/index.cshtml
72 Satellite Imagery and Geospatial Data Task Team report, Earth Observations for Official Statistics, 2017
https://acems.org.au/sites/default/files/ungwg_satellite_task_team_report_whitecover_0.pdf
73 UN-GGIM, http://ggim.un.org/UNGGIM-expert-group
74 Global Statistical Geospatial Framework
https://unstats.un.org/wiki/display/GSGF/Part+1%3A+The+Global+Statistical+Geospatial+Framework
16 ESCAP Statistics DivisionYou can also read